
 Login Sign Up


| |||||
 |  | ||||

| 12Stocks.com Market Intelligence |
Best Tech Stocks
| In a hurry? Tech Stocks Lists: Performance & Trends, Stock Charts, FANG Stocks
Sort Tech stocks: Daily, Weekly, Year-to-Date, Market Cap & Trends. Filter Tech stocks list by size:All Tech Large Mid-Range Small and MicroCap |
| 12Stocks.com Tech Stocks Performances & Trends Daily | |||||||||
|
|  The overall Smart Investing & Trading Score is 68 (0-bearish to 100-bullish) which puts Technology sector in short term neutral to bullish trend. The Smart Investing & Trading Score from previous trading session is 58 and hence an improvement of trend.
| ||||||||
Here are the Smart Investing & Trading Scores of the most requested Technology stocks at 12Stocks.com (click stock name for detailed review):
|


| 12Stocks.com: Investing in Technology sector with Stocks | |
|
The following table helps investors and traders sort through current performance and trends (as measured by Smart Investing & Trading Score) of various
stocks in the Tech sector. Quick View: Move mouse or cursor over stock symbol (ticker) to view short-term technical chart and over stock name to view long term chart. Click on  to add stock symbol to your watchlist and to add stock symbol to your watchlist and  to view watchlist. Click on any ticker or stock name for detailed market intelligence report for that stock. to view watchlist. Click on any ticker or stock name for detailed market intelligence report for that stock. |
12Stocks.com Performance of Stocks in Tech Sector
| Ticker | Stock Name | Watchlist | Category | Recent Price | Smart Investing & Trading Score | Change % | YTD Change% |
| CHT | Chunghwa Telecom |   | Telecom | 38.15 | 51 | 0.70 | -2.37% |
| BCE | BCE | | Telecom | 32.84 | 45 | 0.66 | -16.62% |
| WIT | Wipro | | IT | 5.50 | 49 | 0.64 | -1.35% |
| QRVO | Qorvo | | Semiconductor | 117.50 | 100 | 0.64 | 4.34% |
| GLW | Corning | | Electronics | 31.52 | 35 | 0.61 | 3.51% |
| NTAP | NetApp | | Data Storage | 101.93 | 83 | 0.59 | 15.62% |
| MSGE | Madison Square | | Entertainment | 39.65 | 69 | 0.58 | 24.65% |
| CRWD | CrowdStrike | | Security Software | 305.81 | 75 | 0.57 | 19.78% |
| VEEV | Veeva Systems | | Healthcare Information | 202.04 | 32 | 0.56 | 4.94% |
| DASH | DoorDash | | Internet Content & Information | 132.85 | 56 | 0.56 | 34.45% |
| BR | Broadridge Financial | | IT | 195.18 | 35 | 0.53 | -5.14% |
| ALGM | Allegro MicroSystems | | Semiconductors | 30.26 | 86 | 0.53 | -0.10% |
| FDS | FactSet Research | | IT | 423.68 | 42 | 0.52 | -11.19% |
| AKAM | Akamai | | Internet | 102.21 | 27 | 0.52 | -13.64% |
| INFY | Infosys | | IT | 17.02 | 35 | 0.50 | -7.37% |
| NXPI | NXP Semiconductors | | Semiconductor | 243.85 | 100 | 0.47 | 6.17% |
| IAC | IAC/InterActiveCorp | | Internet | 48.84 | 57 | 0.45 | -6.76% |
| GRMN | Garmin | | Instruments | 144.05 | 78 | 0.42 | 12.07% |
| TMUS | T-Mobile US | | Wireless | 164.55 | 88 | 0.36 | 2.63% |
| TTWO | Take-Two Interactive | | Software | 144.96 | 42 | 0.34 | -9.94% |
| EA | Electronic Arts | | Software | 128.32 | 49 | 0.33 | -6.21% |
| KLAC | KLA | | Semiconductor | 708.37 | 100 | 0.30 | 21.86% |
| LHX | L3Harris | | Communication | 215.13 | 100 | 0.28 | 2.14% |
| ADP | Automatic Data | | Software | 243.70 | 15 | 0.26 | 4.61% |
| MSI | Motorola | | Communication | 347.34 | 83 | 0.25 | 10.94% |
| For chart view version of above stock list: Chart View ➞ 0 - 25 , 25 - 50 , 50 - 75 , 75 - 100 , 100 - 125 , 125 - 150 , 150 - 175 , 175 - 200 | ||
 | Click To Change The Sort Order: By Market Cap or Company Size Performance: Year-to-date, Week and Day |  |
|
Get the most comprehensive stock market coverage daily at 12Stocks.com ➞ Best Stocks Today ➞ Best Stocks Weekly ➞ Best Stocks Year-to-Date ➞ Best Stocks Trends ➞  Best Stocks Today 12Stocks.com Best Nasdaq Stocks ➞ Best S&P 500 Stocks ➞ Best Tech Stocks ➞ Best Biotech Stocks ➞ |
| Detailed Overview of Tech Stocks |
| Tech Technical Overview, Leaders & Laggards, Top Tech ETF Funds & Detailed Tech Stocks List, Charts, Trends & More |
| Tech Sector: Technical Analysis, Trends & YTD Performance | |
| Technology sector is composed of stocks
from semiconductors, software, web, social media
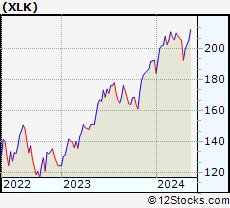
and services subsectors. Technology sector, as represented by XLK, an exchange-traded fund [ETF] that holds basket of tech stocks (e.g, Intel, Google) is up by 4.14% and is currently underperforming the overall market by -2.36% year-to-date. Below is a quick view of technical charts and trends: |
|
 XLK Weekly Chart |
|
| Long Term Trend: Good | |
| Medium Term Trend: Not Good | |
 XLK Daily Chart |
|
| Short Term Trend: Very Good | |
| Overall Trend Score: 68 | |
| YTD Performance: 4.14% | |
| **Trend Scores & Views Are Only For Educational Purposes And Not For Investing | |
| 12Stocks.com: Top Performing Technology Sector Stocks | ||||||||||||||||||||||||||||||||||||||||||||||||
 The top performing Technology sector stocks year to date are
Now, more recently, over last week, the top performing Technology sector stocks on the move are


|
||||||||||||||||||||||||||||||||||||||||||||||||
| 12Stocks.com: Investing in Tech Sector using Exchange Traded Funds | |
|
The following table shows list of key exchange traded funds (ETF) that
help investors track Tech Index. For detailed view, check out our ETF Funds section of our website. Quick View: Move mouse or cursor over ETF symbol (ticker) to view short-term technical chart and over ETF name to view long term chart. Click on ticker or stock name for detailed view. Click on to add stock symbol to your watchlist and to view watchlist. |
12Stocks.com List of ETFs that track Tech Index
| Ticker | ETF Name | Watchlist | Recent Price | Smart Investing & Trading Score | Change % | Week % | Year-to-date % |
| XLK | Technology | | 200.44 | 68 | 0.31 | 0.31 | 4.14% |
| QQQ | QQQ | | 431.87 | 68 | 0.20 | 0.2 | 5.46% |
| IYW | Technology | | 130.98 | 68 | 0.02 | 0.02 | 6.7% |
| VGT | Information Technology | | 505.39 | 75 | 0.29 | 0.29 | 4.42% |
| IXN | Global Tech | | 71.92 | 58 | 0.17 | 0.17 | 5.49% |
| IGV | Tech-Software | | 81.03 | 35 | -0.07 | -0.07 | -0.12% |
| XSD | Semiconductor | | 226.15 | 100 | 0.65 | 0.65 | 0.61% |
| TQQQ | QQQ | | 55.65 | 68 | 0.67 | 0.67 | 9.76% |
| SQQQ | Short QQQ | | 11.36 | 27 | -0.61 | -0.61 | -15.54% |
| SOXL | Semicondct Bull 3X | | 39.83 | 63 | 0.19 | 0.19 | 26.83% |
| SOXS | Semicondct Bear 3X | | 35.17 | 51 | 0.21 | 0.21 | 504.38% |
| SOXX | PHLX Semiconductor | | 216.99 | 78 | 0.04 | 0.04 | 12.99% |
| QTEC | First -100-Tech | | 183.52 | 75 | -0.26 | -0.26 | 4.59% |
| SMH | Semiconductor | | 216.94 | 63 | -0.32 | -0.32 | 24.06% |
| 12Stocks.com: Charts, Trends, Fundamental Data and Performances of Tech Stocks | |
|
We now take in-depth look at all Tech stocks including charts, multi-period performances and overall trends (as measured by Smart Investing & Trading Score). One can sort Tech stocks (click link to choose) by Daily, Weekly and by Year-to-Date performances. Also, one can sort by size of the company or by market capitalization. |
| Select Your Default Chart Type: | |||||
| |||||
| Click on stock symbol or name for detailed view. Click on to add stock symbol to your watchlist and to view watchlist. Quick View: Move mouse or cursor over "Daily" to quickly view daily technical stock chart and over "Weekly" to view weekly technical stock chart. | |||||


 | CHT Chunghwa Telecom Co., Ltd. |
| Sector: Technology | |
| SubSector: Telecom Services - Domestic | |
| MarketCap: 28101.3 Millions | |
| Recent Price: 38.15 Smart Investing & Trading Score: 51 | |
| Day Percent Change: 0.70% Day Change: 0.27 | |
| Week Change: 0.7% Year-to-date Change: -2.4% | |
| CHT Links: Profile News Message Board | |
| Charts:- Daily , Weekly | |
| Add CHT to Watchlist: View: Get Complete CHT Trend Analysis ➞ | |
 | BCE BCE Inc. |
| Sector: Technology | |
| SubSector: Telecom Services - Domestic | |
| MarketCap: 37288.3 Millions | |
| Recent Price: 32.84 Smart Investing & Trading Score: 45 | |
| Day Percent Change: 0.66% Day Change: 0.22 | |
| Week Change: 0.66% Year-to-date Change: -16.6% | |
| BCE Links: Profile News Message Board | |
| Charts:- Daily , Weekly | |
| Add BCE to Watchlist: View: Get Complete BCE Trend Analysis ➞ | |
 | WIT Wipro Limited |
| Sector: Technology | |
| SubSector: Information Technology Services | |
| MarketCap: 15101.3 Millions | |
| Recent Price: 5.50 Smart Investing & Trading Score: 49 | |
| Day Percent Change: 0.64% Day Change: 0.04 | |
| Week Change: 0.64% Year-to-date Change: -1.4% | |
| WIT Links: Profile News Message Board | |
| Charts:- Daily , Weekly | |
| Add WIT to Watchlist: View: Get Complete WIT Trend Analysis ➞ | |
 | QRVO Qorvo, Inc. |
| Sector: Technology | |
| SubSector: Semiconductor - Broad Line | |
| MarketCap: 9524.32 Millions | |
| Recent Price: 117.50 Smart Investing & Trading Score: 100 | |
| Day Percent Change: 0.64% Day Change: 0.75 | |
| Week Change: 0.64% Year-to-date Change: 4.3% | |
| QRVO Links: Profile News Message Board | |
| Charts:- Daily , Weekly | |
| Add QRVO to Watchlist: View: Get Complete QRVO Trend Analysis ➞ | |
 | GLW Corning Incorporated |
| Sector: Technology | |
| SubSector: Diversified Electronics | |
| MarketCap: 16287.6 Millions | |
| Recent Price: 31.52 Smart Investing & Trading Score: 35 | |
| Day Percent Change: 0.61% Day Change: 0.19 | |
| Week Change: 0.61% Year-to-date Change: 3.5% | |
| GLW Links: Profile News Message Board | |
| Charts:- Daily , Weekly | |
| Add GLW to Watchlist: View: Get Complete GLW Trend Analysis ➞ | |
 | NTAP NetApp, Inc. |
| Sector: Technology | |
| SubSector: Data Storage Devices | |
| MarketCap: 9028.89 Millions | |
| Recent Price: 101.93 Smart Investing & Trading Score: 83 | |
| Day Percent Change: 0.59% Day Change: 0.60 | |
| Week Change: 0.59% Year-to-date Change: 15.6% | |
| NTAP Links: Profile News Message Board | |
| Charts:- Daily , Weekly | |
| Add NTAP to Watchlist: View: Get Complete NTAP Trend Analysis ➞ | |
 | MSGE Madison Square Garden Entertainment Corp. |
| Sector: Technology | |
| SubSector: Entertainment | |
| MarketCap: 18837 Millions | |
| Recent Price: 39.65 Smart Investing & Trading Score: 69 | |
| Day Percent Change: 0.58% Day Change: 0.23 | |
| Week Change: 0.58% Year-to-date Change: 24.7% | |
| MSGE Links: Profile News Message Board | |
| Charts:- Daily , Weekly | |
| Add MSGE to Watchlist: View: Get Complete MSGE Trend Analysis ➞ | |
 | CRWD CrowdStrike Holdings, Inc. |
| Sector: Technology | |
| SubSector: Security Software & Services | |
| MarketCap: 11803.6 Millions | |
| Recent Price: 305.81 Smart Investing & Trading Score: 75 | |
| Day Percent Change: 0.57% Day Change: 1.74 | |
| Week Change: 0.57% Year-to-date Change: 19.8% | |
| CRWD Links: Profile News Message Board | |
| Charts:- Daily , Weekly | |
| Add CRWD to Watchlist: View: Get Complete CRWD Trend Analysis ➞ | |
 | VEEV Veeva Systems Inc. |
| Sector: Technology | |
| SubSector: Healthcare Information Services | |
| MarketCap: 21492.1 Millions | |
| Recent Price: 202.04 Smart Investing & Trading Score: 32 | |
| Day Percent Change: 0.56% Day Change: 1.13 | |
| Week Change: 0.56% Year-to-date Change: 4.9% | |
| VEEV Links: Profile News Message Board | |
| Charts:- Daily , Weekly | |
| Add VEEV to Watchlist: View: Get Complete VEEV Trend Analysis ➞ | |
 | DASH DoorDash, Inc. |
| Sector: Technology | |
| SubSector: Internet Content & Information | |
| MarketCap: 59087 Millions | |
| Recent Price: 132.85 Smart Investing & Trading Score: 56 | |
| Day Percent Change: 0.56% Day Change: 0.74 | |
| Week Change: 0.56% Year-to-date Change: 34.5% | |
| DASH Links: Profile News Message Board | |
| Charts:- Daily , Weekly | |
| Add DASH to Watchlist: View: Get Complete DASH Trend Analysis ➞ | |
 | BR Broadridge Financial Solutions, Inc. |
| Sector: Technology | |
| SubSector: Information Technology Services | |
| MarketCap: 10633.8 Millions | |
| Recent Price: 195.18 Smart Investing & Trading Score: 35 | |
| Day Percent Change: 0.53% Day Change: 1.03 | |
| Week Change: 0.53% Year-to-date Change: -5.1% | |
| BR Links: Profile News Message Board | |
| Charts:- Daily , Weekly | |
| Add BR to Watchlist: View: Get Complete BR Trend Analysis ➞ | |
 | ALGM Allegro MicroSystems, Inc. |
| Sector: Technology | |
| SubSector: Semiconductors | |
| MarketCap: 50287 Millions | |
| Recent Price: 30.26 Smart Investing & Trading Score: 86 | |
| Day Percent Change: 0.53% Day Change: 0.16 | |
| Week Change: 0.53% Year-to-date Change: -0.1% | |
| ALGM Links: Profile News Message Board | |
| Charts:- Daily , Weekly | |
| Add ALGM to Watchlist: View: Get Complete ALGM Trend Analysis ➞ | |
 | FDS FactSet Research Systems Inc. |
| Sector: Technology | |
| SubSector: Information & Delivery Services | |
| MarketCap: 9024.37 Millions | |
| Recent Price: 423.68 Smart Investing & Trading Score: 42 | |
| Day Percent Change: 0.52% Day Change: 2.21 | |
| Week Change: 0.52% Year-to-date Change: -11.2% | |
| FDS Links: Profile News Message Board | |
| Charts:- Daily , Weekly | |
| Add FDS to Watchlist: View: Get Complete FDS Trend Analysis ➞ | |
 | AKAM Akamai Technologies, Inc. |
| Sector: Technology | |
| SubSector: Internet Information Providers | |
| MarketCap: 14495.5 Millions | |
| Recent Price: 102.21 Smart Investing & Trading Score: 27 | |
| Day Percent Change: 0.52% Day Change: 0.53 | |
| Week Change: 0.52% Year-to-date Change: -13.6% | |
| AKAM Links: Profile News Message Board | |
| Charts:- Daily , Weekly | |
| Add AKAM to Watchlist: View: Get Complete AKAM Trend Analysis ➞ | |
 | INFY Infosys Limited |
| Sector: Technology | |
| SubSector: Information Technology Services | |
| MarketCap: 33819.1 Millions | |
| Recent Price: 17.02 Smart Investing & Trading Score: 35 | |
| Day Percent Change: 0.50% Day Change: 0.08 | |
| Week Change: 0.5% Year-to-date Change: -7.4% | |
| INFY Links: Profile News Message Board | |
| Charts:- Daily , Weekly | |
| Add INFY to Watchlist: View: Get Complete INFY Trend Analysis ➞ | |
 | NXPI NXP Semiconductors N.V. |
| Sector: Technology | |
| SubSector: Semiconductor - Broad Line | |
| MarketCap: 22497.9 Millions | |
| Recent Price: 243.85 Smart Investing & Trading Score: 100 | |
| Day Percent Change: 0.47% Day Change: 1.15 | |
| Week Change: 0.47% Year-to-date Change: 6.2% | |
| NXPI Links: Profile News Message Board | |
| Charts:- Daily , Weekly | |
| Add NXPI to Watchlist: View: Get Complete NXPI Trend Analysis ➞ | |
 | IAC IAC/InterActiveCorp |
| Sector: Technology | |
| SubSector: Internet Information Providers | |
| MarketCap: 12561.2 Millions | |
| Recent Price: 48.84 Smart Investing & Trading Score: 57 | |
| Day Percent Change: 0.45% Day Change: 0.22 | |
| Week Change: 0.45% Year-to-date Change: -6.8% | |
| IAC Links: Profile News Message Board | |
| Charts:- Daily , Weekly | |
| Add IAC to Watchlist: View: Get Complete IAC Trend Analysis ➞ | |
 | GRMN Garmin Ltd. |
| Sector: Technology | |
| SubSector: Scientific & Technical Instruments | |
| MarketCap: 13909.3 Millions | |
| Recent Price: 144.05 Smart Investing & Trading Score: 78 | |
| Day Percent Change: 0.42% Day Change: 0.60 | |
| Week Change: 0.42% Year-to-date Change: 12.1% | |
| GRMN Links: Profile News Message Board | |
| Charts:- Daily , Weekly | |
| Add GRMN to Watchlist: View: Get Complete GRMN Trend Analysis ➞ | |
 | TMUS T-Mobile US, Inc. |
| Sector: Technology | |
| SubSector: Wireless Communications | |
| MarketCap: 71949 Millions | |
| Recent Price: 164.55 Smart Investing & Trading Score: 88 | |
| Day Percent Change: 0.36% Day Change: 0.59 | |
| Week Change: 0.36% Year-to-date Change: 2.6% | |
| TMUS Links: Profile News Message Board | |
| Charts:- Daily , Weekly | |
| Add TMUS to Watchlist: View: Get Complete TMUS Trend Analysis ➞ | |
 | TTWO Take-Two Interactive Software, Inc. |
| Sector: Technology | |
| SubSector: Multimedia & Graphics Software | |
| MarketCap: 12479.6 Millions | |
| Recent Price: 144.96 Smart Investing & Trading Score: 42 | |
| Day Percent Change: 0.34% Day Change: 0.49 | |
| Week Change: 0.34% Year-to-date Change: -9.9% | |
| TTWO Links: Profile News Message Board | |
| Charts:- Daily , Weekly | |
| Add TTWO to Watchlist: View: Get Complete TTWO Trend Analysis ➞ | |
 | EA Electronic Arts Inc. |
| Sector: Technology | |
| SubSector: Multimedia & Graphics Software | |
| MarketCap: 27296.5 Millions | |
| Recent Price: 128.32 Smart Investing & Trading Score: 49 | |
| Day Percent Change: 0.33% Day Change: 0.42 | |
| Week Change: 0.33% Year-to-date Change: -6.2% | |
| EA Links: Profile News Message Board | |
| Charts:- Daily , Weekly | |
| Add EA to Watchlist: View: Get Complete EA Trend Analysis ➞ | |
 | KLAC KLA Corporation |
| Sector: Technology | |
| SubSector: Semiconductor Equipment & Materials | |
| MarketCap: 20663.8 Millions | |
| Recent Price: 708.37 Smart Investing & Trading Score: 100 | |
| Day Percent Change: 0.30% Day Change: 2.11 | |
| Week Change: 0.3% Year-to-date Change: 21.9% | |
| KLAC Links: Profile News Message Board | |
| Charts:- Daily , Weekly | |
| Add KLAC to Watchlist: View: Get Complete KLAC Trend Analysis ➞ | |
 | LHX L3Harris Technologies, Inc. |
| Sector: Technology | |
| SubSector: Communication Equipment | |
| MarketCap: 37906.1 Millions | |
| Recent Price: 215.13 Smart Investing & Trading Score: 100 | |
| Day Percent Change: 0.28% Day Change: 0.59 | |
| Week Change: 0.28% Year-to-date Change: 2.1% | |
| LHX Links: Profile News Message Board | |
| Charts:- Daily , Weekly | |
| Add LHX to Watchlist: View: Get Complete LHX Trend Analysis ➞ | |
 | ADP Automatic Data Processing, Inc. |
| Sector: Technology | |
| SubSector: Business Software & Services | |
| MarketCap: 54966.5 Millions | |
| Recent Price: 243.70 Smart Investing & Trading Score: 15 | |
| Day Percent Change: 0.26% Day Change: 0.63 | |
| Week Change: 0.26% Year-to-date Change: 4.6% | |
| ADP Links: Profile News Message Board | |
| Charts:- Daily , Weekly | |
| Add ADP to Watchlist: View: Get Complete ADP Trend Analysis ➞ | |
 | MSI Motorola Solutions, Inc. |
| Sector: Technology | |
| SubSector: Communication Equipment | |
| MarketCap: 26573.3 Millions | |
| Recent Price: 347.34 Smart Investing & Trading Score: 83 | |
| Day Percent Change: 0.25% Day Change: 0.86 | |
| Week Change: 0.25% Year-to-date Change: 10.9% | |
| MSI Links: Profile News Message Board | |
| Charts:- Daily , Weekly | |
| Add MSI to Watchlist: View: Get Complete MSI Trend Analysis ➞ | |
| For tabular summary view of above stock list: Summary View ➞ 0 - 25 , 25 - 50 , 50 - 75 , 75 - 100 , 100 - 125 , 125 - 150 , 150 - 175 , 175 - 200 | ||
| Click To Change The Sort Order: By Market Cap or Company Size Performance: Year-to-date, Week and Day | |
| Select Chart Type: | ||
|
Best Stocks Today 12Stocks.com |
© 2024 12Stocks.com Terms & Conditions Privacy Contact Us
All Information Provided Only For Education And Not To Be Used For Investing or Trading. See Terms & Conditions


One More Thing ... Get Best Stocks Delivered Daily!
Never Ever Miss A Move With Our Top Ten Stocks Lists
Find Best Stocks In Any Market - Bull or Bear Market
Take A Peek At Our Top Ten Stocks Lists: Daily, Weekly, Year-to-Date & Top Trends
Find Best Stocks In Any Market - Bull or Bear Market
Take A Peek At Our Top Ten Stocks Lists: Daily, Weekly, Year-to-Date & Top Trends
Technology Stocks With Best Up Trends [0-bearish to 100-bullish]: Bakkt [100], Koninklijke Philips[100], GDS [100], Baidu [100], Ouster [100], Liberty Latin[100], Turkcell Iletisim[100], Liberty Latin[100], Rogers [100], America Movil[100], Cognex [100]
Best Technology Stocks Year-to-Date:
Bakkt [363.68%], MediaCo Holding[277.93%], Super Micro[208.09%], CXApp [180.31%], Smith Micro[179.66%], Uxin [175.32%], CuriosityStream [107.37%], MicroStrategy [106.96%], NextNav [103.15%], Cheetah Mobile[87.41%], GigaCloud [85.14%] Best Technology Stocks This Week:
Bakkt [2486.94%], Koninklijke Philips[29.57%], 21Vianet [12.66%], Phoenix New[12%], Velo3D [11.5%], 2U [10.57%], LivePerson [9.92%], Cogint [8.97%], GDS [8.83%], WiMi Hologram[8.33%], Canadian Solar[7.92%] Best Technology Stocks Daily:
Bakkt [2486.94%], Koninklijke Philips[29.57%], 21Vianet [12.66%], Phoenix New[12.00%], Velo3D [11.50%], 2U [10.57%], LivePerson [9.92%], Cogint [8.97%], GDS [8.83%], WiMi Hologram[8.33%], Canadian Solar[7.92%]