
 Login Sign Up


| |||||
 |  | ||||

| 12Stocks.com Market Intelligence |
Best SmallCap Stocks
|
| In a hurry? Small Cap Stock Lists: Performance Trends Table, Stock Charts
Sort Small Cap stocks: Daily, Weekly, Year-to-Date, Market Cap & Trends. Filter Small Cap stocks list by sector: Show all, Tech, Finance, Energy, Staples, Retail, Industrial, Materials, Utilities and HealthCare Filter Small Cap stocks list by size: All Large Medium Small and MicroCap |
| 12Stocks.com Small Cap Stocks Performances & Trends Daily | |||||||||
|
|  The overall Smart Investing & Trading Score is 44 (0-bearish to 100-bullish) which puts Small Cap index in short term neutral trend. The Smart Investing & Trading Score from previous trading session is 58 and hence a deterioration of trend.
| ||||||||
Here are the Smart Investing & Trading Scores of the most requested small cap stocks at 12Stocks.com (click stock name for detailed review):
|


| 12Stocks.com: Investing in Smallcap Index with Stocks | |
|
The following table helps investors and traders sort through current performance and trends (as measured by Smart Investing & Trading Score) of various
stocks in the Smallcap Index. Quick View: Move mouse or cursor over stock symbol (ticker) to view short-term technical chart and over stock name to view long term chart. Click on  to add stock symbol to your watchlist and to add stock symbol to your watchlist and  to view watchlist. Click on any ticker or stock name for detailed market intelligence report for that stock. to view watchlist. Click on any ticker or stock name for detailed market intelligence report for that stock. |
12Stocks.com Performance of Stocks in Smallcap Index
| Ticker | Stock Name | Watchlist | Category | Recent Price | Smart Investing & Trading Score | Change % | YTD Change% |
| SLVM | Sylvamo |   | Materials | 61.63 | 93 | -0.90% | 25.49% |
| PRMW | Primo Water | | Consumer Staples | 18.85 | 95 | 0.00% | 25.25% |
| OMI | Owens & Minor | | Services & Goods | 24.12 | 54 | -2.51% | 25.17% |
| APPF | AppFolio | | Technology | 216.65 | 25 | 0.35% | 25.06% |
| ITRI | Itron | | Technology | 94.39 | 88 | -0.03% | 25.00% |
| ACTG | Acacia Research | | Services & Goods | 4.89 | 68 | -1.81% | 24.74% |
| TNC | Tennant | | Industrials | 115.46 | 63 | -1.58% | 24.57% |
| PCT | PureCycle | | Industrials | 5.05 | 53 | 2.33% | 24.54% |
| KALU | Kaiser Aluminum | | Materials | 88.49 | 36 | 1.33% | 24.30% |
| WTTR | Select Energy | | Industrials | 9.42 | 61 | 0.64% | 24.11% |
| CNK | Cinemark | | Services & Goods | 17.48 | 46 | -1.30% | 24.06% |
| NRIX | Nurix | | Health Care | 12.81 | 46 | -6.70% | 24.01% |
| MLI | Mueller Industries | | Industrials | 58.41 | 100 | 0.78% | 23.88% |
| MLP | Maui Land | | Financials | 19.65 | 58 | 1.60% | 23.66% |
| AVAV | AeroVironment | | Industrials | 155.64 | 93 | -1.49% | 23.48% |
| PRCT | PROCEPT BioRobotics | | Health Care | 52.28 | 90 | -0.74% | 23.48% |
| MGY | Magnolia Oil | | Energy | 26.28 | 46 | 0.65% | 23.44% |
| RVMD | Revolution Medicines | | Health Care | 35.38 | 73 | -0.59% | 23.36% |
| BRY | Berry | | Energy | 8.66 | 63 | 0.41% | 23.26% |
| BAND | Bandwidth | | Technology | 17.78 | 53 | -3.63% | 22.87% |
| MRSN | Mersana | | Health Care | 2.85 | 10 | -1.04% | 22.84% |
| TROX | Tronox | | Materials | 17.37 | 93 | -1.36% | 22.67% |
| KPTI | Karyopharm | | Health Care | 1.06 | 46 | -2.75% | 22.54% |
| DY | Dycom Industries | | Industrials | 140.95 | 75 | 1.13% | 22.47% |
| CMPO | CompoSecure | | Industrials | 6.69 | 68 | 3.16% | 22.30% |


| Too many stocks? View smallcap stocks filtered by marketcap & sector |
| Marketcap: All SmallCap Stocks (default-no microcap), Large, Mid-Range, Small |
| Smallcap Sector: Tech, Finance, Energy, Staples, Retail, Industrial, Materials, & Medical |
|
Get the most comprehensive stock market coverage daily at 12Stocks.com ➞ Best Stocks Today ➞ Best Stocks Weekly ➞ Best Stocks Year-to-Date ➞ Best Stocks Trends ➞  Best Stocks Today 12Stocks.com Best Nasdaq Stocks ➞ Best S&P 500 Stocks ➞ Best Tech Stocks ➞ Best Biotech Stocks ➞ |
| Detailed Overview of SmallCap Stocks |
| SmallCap Technical Overview, Leaders & Laggards, Top SmallCap ETF Funds & Detailed SmallCap Stocks List, Charts, Trends & More |
| Smallcap: Technical Analysis, Trends & YTD Performance | |
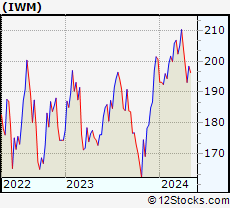
| SmallCap segment as represented by
IWM, an exchange-traded fund [ETF], holds basket of thousands of smallcap stocks from across all major sectors of the US stock market. The smallcap index (contains stocks like Riverbed & Sotheby's) is down by -2.11% and is currently underperforming the overall market by -7.27% year-to-date. Below is a quick view of technical charts and trends: | |
 IWM Weekly Chart |
|
| Long Term Trend: Good | |
| Medium Term Trend: Not Good | |
 IWM Daily Chart |
|
| Short Term Trend: Very Good | |
| Overall Trend Score: 44 | |
| YTD Performance: -2.11% | |
| **Trend Scores & Views Are Only For Educational Purposes And Not For Investing | |
| 12Stocks.com: Top Performing Small Cap Index Stocks | ||||||||||||||||||||||||||||||||||||||||||||||||
 The top performing Small Cap Index stocks year to date are
Now, more recently, over last week, the top performing Small Cap Index stocks on the move are


|
||||||||||||||||||||||||||||||||||||||||||||||||
| 12Stocks.com: Investing in Smallcap Index using Exchange Traded Funds | |
|
The following table shows list of key exchange traded funds (ETF) that
help investors track Smallcap index. The following list also includes leveraged ETF funds that track twice or thrice the daily returns of Smallcap indices. Short or inverse ETF funds move in the opposite direction to the index they track and are useful during market pullbacks or during bear markets. Quick View: Move mouse or cursor over ETF symbol (ticker) to view short-term technical chart and over ETF name to view long term chart. Click on ticker or stock name for detailed view. Click on to add stock symbol to your watchlist and to view watchlist. |
12Stocks.com List of ETFs that track Smallcap Index
| Ticker | ETF Name | Watchlist | Recent Price | Smart Investing & Trading Score | Change % | Week % | Year-to-date % |
| IWM | iShares Russell 2000 | | 196.48 | 44 | -0.61 | 1.73 | -2.11% |
| IJR | iShares Core S&P Small-Cap | | 104.86 | 78 | -0.80 | 1.59 | -3.13% |
| VTWO | Vanguard Russell 2000 ETF | | 79.45 | 63 | -0.60 | 1.75 | -2.03% |
| IWN | iShares Russell 2000 Value | | 150.18 | 68 | -0.73 | 1.62 | -3.32% |
| IWO | iShares Russell 2000 Growth | | 249.86 | 51 | -0.56 | 1.86 | -0.94% |
| IJS | iShares S&P Small-Cap 600 Value | | 96.69 | 60 | -1.04 | 1.13 | -6.19% |
| IJT | iShares S&P Small-Cap 600 Growth | | 125.06 | 63 | -0.25 | 2.33 | -0.06% |
| XSLV | PowerShares S&P SmallCap Low Volatil ETF | | 42.54 | 73 | -0.93 | 0.85 | -3.65% |
| SDD | ProShares UltraShort SmallCap600 | | 19.58 | 42 | 0.46 | -3.74 | 6.26% |
| SBB | ProShares Short SmallCap600 | | 16.50 | 40 | 0.79 | -2.02 | 3.58% |
| SMLV | SPDR SSGA US Small Cap Low Volatil ETF | | 107.33 | 73 | -1.01 | 1.17 | -4.61% |
| SAA | ProShares Ultra SmallCap600 | | 22.66 | 58 | -1.52 | 3.94 | -9.18% |
| 12Stocks.com: Charts, Trends, Fundamental Data and Performances of SmallCap Stocks | |
|
We now take in-depth look at all SmallCap stocks including charts, multi-period performances and overall trends (as measured by Smart Investing & Trading Score). One can sort SmallCap stocks (click link to choose) by Daily, Weekly and by Year-to-Date performances. Also, one can sort by size of the company or by market capitalization. |
| Select Your Default Chart Type: | |||||
| |||||
| Click on stock symbol or name for detailed view. Click on to add stock symbol to your watchlist and to view watchlist. Quick View: Move mouse or cursor over "Daily" to quickly view daily technical stock chart and over "Weekly" to view weekly technical stock chart. | |||||

 | SLVM Sylvamo Corporation |
| Sector: Materials | |
| SubSector: Paper & Paper Products | |
| MarketCap: 1710 Millions | |
| Recent Price: 61.63 Smart Investing & Trading Score: 93 | |
| Day Percent Change: -0.90% Day Change: -0.56 | |
| Week Change: 5.42% Year-to-date Change: 25.5% | |
| SLVM Links: Profile News Message Board | |
| Charts:- Daily , Weekly | |
| Add SLVM to Watchlist: View: Get Complete SLVM Trend Analysis ➞ | |
 | PRMW Primo Water Corporation |
| Sector: Consumer Staples | |
| SubSector: Beverages - Soft Drinks | |
| MarketCap: 1479.7 Millions | |
| Recent Price: 18.85 Smart Investing & Trading Score: 95 | |
| Day Percent Change: 0.00% Day Change: 0.00 | |
| Week Change: 2.28% Year-to-date Change: 25.3% | |
| PRMW Links: Profile News Message Board | |
| Charts:- Daily , Weekly | |
| Add PRMW to Watchlist: View: Get Complete PRMW Trend Analysis ➞ | |
 | OMI Owens & Minor, Inc. |
| Sector: Services & Goods | |
| SubSector: Medical Equipment Wholesale | |
| MarketCap: 403.92 Millions | |
| Recent Price: 24.12 Smart Investing & Trading Score: 54 | |
| Day Percent Change: -2.51% Day Change: -0.62 | |
| Week Change: -2.7% Year-to-date Change: 25.2% | |
| OMI Links: Profile News Message Board | |
| Charts:- Daily , Weekly | |
| Add OMI to Watchlist: View: Get Complete OMI Trend Analysis ➞ | |
 | APPF AppFolio, Inc. |
| Sector: Technology | |
| SubSector: Application Software | |
| MarketCap: 3412.02 Millions | |
| Recent Price: 216.65 Smart Investing & Trading Score: 25 | |
| Day Percent Change: 0.35% Day Change: 0.75 | |
| Week Change: 3.91% Year-to-date Change: 25.1% | |
| APPF Links: Profile News Message Board | |
| Charts:- Daily , Weekly | |
| Add APPF to Watchlist: View: Get Complete APPF Trend Analysis ➞ | |
 | ITRI Itron, Inc. |
| Sector: Technology | |
| SubSector: Scientific & Technical Instruments | |
| MarketCap: 2222.23 Millions | |
| Recent Price: 94.39 Smart Investing & Trading Score: 88 | |
| Day Percent Change: -0.03% Day Change: -0.03 | |
| Week Change: 5.25% Year-to-date Change: 25.0% | |
| ITRI Links: Profile News Message Board | |
| Charts:- Daily , Weekly | |
| Add ITRI to Watchlist: View: Get Complete ITRI Trend Analysis ➞ | |
 | ACTG Acacia Research Corporation |
| Sector: Services & Goods | |
| SubSector: Business Services | |
| MarketCap: 112.782 Millions | |
| Recent Price: 4.89 Smart Investing & Trading Score: 68 | |
| Day Percent Change: -1.81% Day Change: -0.09 | |
| Week Change: 0.2% Year-to-date Change: 24.7% | |
| ACTG Links: Profile News Message Board | |
| Charts:- Daily , Weekly | |
| Add ACTG to Watchlist: View: Get Complete ACTG Trend Analysis ➞ | |
 | TNC Tennant Company |
| Sector: Industrials | |
| SubSector: Diversified Machinery | |
| MarketCap: 1097.96 Millions | |
| Recent Price: 115.46 Smart Investing & Trading Score: 63 | |
| Day Percent Change: -1.58% Day Change: -1.85 | |
| Week Change: 0.49% Year-to-date Change: 24.6% | |
| TNC Links: Profile News Message Board | |
| Charts:- Daily , Weekly | |
| Add TNC to Watchlist: View: Get Complete TNC Trend Analysis ➞ | |
 | PCT PureCycle Technologies, Inc. |
| Sector: Industrials | |
| SubSector: Pollution & Treatment Controls | |
| MarketCap: 1610 Millions | |
| Recent Price: 5.05 Smart Investing & Trading Score: 53 | |
| Day Percent Change: 2.33% Day Change: 0.12 | |
| Week Change: -3.63% Year-to-date Change: 24.5% | |
| PCT Links: Profile News Message Board | |
| Charts:- Daily , Weekly | |
| Add PCT to Watchlist: View: Get Complete PCT Trend Analysis ➞ | |
 | KALU Kaiser Aluminum Corporation |
| Sector: Materials | |
| SubSector: Aluminum | |
| MarketCap: 969.808 Millions | |
| Recent Price: 88.49 Smart Investing & Trading Score: 36 | |
| Day Percent Change: 1.33% Day Change: 1.16 | |
| Week Change: -1.12% Year-to-date Change: 24.3% | |
| KALU Links: Profile News Message Board | |
| Charts:- Daily , Weekly | |
| Add KALU to Watchlist: View: Get Complete KALU Trend Analysis ➞ | |
 | WTTR Select Energy Services, Inc. |
| Sector: Industrials | |
| SubSector: Pollution & Treatment Controls | |
| MarketCap: 347.075 Millions | |
| Recent Price: 9.42 Smart Investing & Trading Score: 61 | |
| Day Percent Change: 0.64% Day Change: 0.06 | |
| Week Change: 0.86% Year-to-date Change: 24.1% | |
| WTTR Links: Profile News Message Board | |
| Charts:- Daily , Weekly | |
| Add WTTR to Watchlist: View: Get Complete WTTR Trend Analysis ➞ | |
 | CNK Cinemark Holdings, Inc. |
| Sector: Services & Goods | |
| SubSector: Movie Production, Theaters | |
| MarketCap: 1776.29 Millions | |
| Recent Price: 17.48 Smart Investing & Trading Score: 46 | |
| Day Percent Change: -1.30% Day Change: -0.23 | |
| Week Change: -4.06% Year-to-date Change: 24.1% | |
| CNK Links: Profile News Message Board | |
| Charts:- Daily , Weekly | |
| Add CNK to Watchlist: View: Get Complete CNK Trend Analysis ➞ | |
 | NRIX Nurix Therapeutics, Inc. |
| Sector: Health Care | |
| SubSector: Biotechnology | |
| MarketCap: 16787 Millions | |
| Recent Price: 12.81 Smart Investing & Trading Score: 46 | |
| Day Percent Change: -6.70% Day Change: -0.92 | |
| Week Change: -9.57% Year-to-date Change: 24.0% | |
| NRIX Links: Profile News Message Board | |
| Charts:- Daily , Weekly | |
| Add NRIX to Watchlist: View: Get Complete NRIX Trend Analysis ➞ | |
 | MLI Mueller Industries, Inc. |
| Sector: Industrials | |
| SubSector: Metal Fabrication | |
| MarketCap: 1259.5 Millions | |
| Recent Price: 58.41 Smart Investing & Trading Score: 100 | |
| Day Percent Change: 0.78% Day Change: 0.45 | |
| Week Change: 11.73% Year-to-date Change: 23.9% | |
| MLI Links: Profile News Message Board | |
| Charts:- Daily , Weekly | |
| Add MLI to Watchlist: View: Get Complete MLI Trend Analysis ➞ | |
 | MLP Maui Land & Pineapple Company, Inc. |
| Sector: Financials | |
| SubSector: Real Estate Development | |
| MarketCap: 186.619 Millions | |
| Recent Price: 19.65 Smart Investing & Trading Score: 58 | |
| Day Percent Change: 1.60% Day Change: 0.31 | |
| Week Change: 1.45% Year-to-date Change: 23.7% | |
| MLP Links: Profile News Message Board | |
| Charts:- Daily , Weekly | |
| Add MLP to Watchlist: View: Get Complete MLP Trend Analysis ➞ | |
 | AVAV AeroVironment, Inc. |
| Sector: Industrials | |
| SubSector: Aerospace/Defense Products & Services | |
| MarketCap: 1502.41 Millions | |
| Recent Price: 155.64 Smart Investing & Trading Score: 93 | |
| Day Percent Change: -1.49% Day Change: -2.35 | |
| Week Change: 3.75% Year-to-date Change: 23.5% | |
| AVAV Links: Profile News Message Board | |
| Charts:- Daily , Weekly | |
| Add AVAV to Watchlist: View: Get Complete AVAV Trend Analysis ➞ | |
 | PRCT PROCEPT BioRobotics Corporation |
| Sector: Health Care | |
| SubSector: Medical Devices | |
| MarketCap: 1600 Millions | |
| Recent Price: 52.28 Smart Investing & Trading Score: 90 | |
| Day Percent Change: -0.74% Day Change: -0.39 | |
| Week Change: 4.16% Year-to-date Change: 23.5% | |
| PRCT Links: Profile News Message Board | |
| Charts:- Daily , Weekly | |
| Add PRCT to Watchlist: View: Get Complete PRCT Trend Analysis ➞ | |
 | MGY Magnolia Oil & Gas Corporation |
| Sector: Energy | |
| SubSector: Independent Oil & Gas | |
| MarketCap: 1088.93 Millions | |
| Recent Price: 26.28 Smart Investing & Trading Score: 46 | |
| Day Percent Change: 0.65% Day Change: 0.17 | |
| Week Change: 2.58% Year-to-date Change: 23.4% | |
| MGY Links: Profile News Message Board | |
| Charts:- Daily , Weekly | |
| Add MGY to Watchlist: View: Get Complete MGY Trend Analysis ➞ | |
 | RVMD Revolution Medicines, Inc. |
| Sector: Health Care | |
| SubSector: Biotechnology | |
| MarketCap: 28087 Millions | |
| Recent Price: 35.38 Smart Investing & Trading Score: 73 | |
| Day Percent Change: -0.59% Day Change: -0.21 | |
| Week Change: 1.23% Year-to-date Change: 23.4% | |
| RVMD Links: Profile News Message Board | |
| Charts:- Daily , Weekly | |
| Add RVMD to Watchlist: View: Get Complete RVMD Trend Analysis ➞ | |
 | BRY Berry Corporation |
| Sector: Energy | |
| SubSector: Independent Oil & Gas | |
| MarketCap: 254.793 Millions | |
| Recent Price: 8.66 Smart Investing & Trading Score: 63 | |
| Day Percent Change: 0.41% Day Change: 0.03 | |
| Week Change: 2.97% Year-to-date Change: 23.3% | |
| BRY Links: Profile News Message Board | |
| Charts:- Daily , Weekly | |
| Add BRY to Watchlist: View: Get Complete BRY Trend Analysis ➞ | |
 | BAND Bandwidth Inc. |
| Sector: Technology | |
| SubSector: Business Software & Services | |
| MarketCap: 1549.38 Millions | |
| Recent Price: 17.78 Smart Investing & Trading Score: 53 | |
| Day Percent Change: -3.63% Day Change: -0.67 | |
| Week Change: 2.48% Year-to-date Change: 22.9% | |
| BAND Links: Profile News Message Board | |
| Charts:- Daily , Weekly | |
| Add BAND to Watchlist: View: Get Complete BAND Trend Analysis ➞ | |
 | MRSN Mersana Therapeutics, Inc. |
| Sector: Health Care | |
| SubSector: Biotechnology | |
| MarketCap: 224.385 Millions | |
| Recent Price: 2.85 Smart Investing & Trading Score: 10 | |
| Day Percent Change: -1.04% Day Change: -0.03 | |
| Week Change: -12.44% Year-to-date Change: 22.8% | |
| MRSN Links: Profile News Message Board | |
| Charts:- Daily , Weekly | |
| Add MRSN to Watchlist: View: Get Complete MRSN Trend Analysis ➞ | |
 | TROX Tronox Holdings plc |
| Sector: Materials | |
| SubSector: Chemicals - Major Diversified | |
| MarketCap: 807 Millions | |
| Recent Price: 17.37 Smart Investing & Trading Score: 93 | |
| Day Percent Change: -1.36% Day Change: -0.24 | |
| Week Change: 7.29% Year-to-date Change: 22.7% | |
| TROX Links: Profile News Message Board | |
| Charts:- Daily , Weekly | |
| Add TROX to Watchlist: View: Get Complete TROX Trend Analysis ➞ | |
 | KPTI Karyopharm Therapeutics Inc. |
| Sector: Health Care | |
| SubSector: Biotechnology | |
| MarketCap: 1471.85 Millions | |
| Recent Price: 1.06 Smart Investing & Trading Score: 46 | |
| Day Percent Change: -2.75% Day Change: -0.03 | |
| Week Change: -9.4% Year-to-date Change: 22.5% | |
| KPTI Links: Profile News Message Board | |
| Charts:- Daily , Weekly | |
| Add KPTI to Watchlist: View: Get Complete KPTI Trend Analysis ➞ | |
 | DY Dycom Industries, Inc. |
| Sector: Industrials | |
| SubSector: Heavy Construction | |
| MarketCap: 576.295 Millions | |
| Recent Price: 140.95 Smart Investing & Trading Score: 75 | |
| Day Percent Change: 1.13% Day Change: 1.58 | |
| Week Change: 3.98% Year-to-date Change: 22.5% | |
| DY Links: Profile News Message Board | |
| Charts:- Daily , Weekly | |
| Add DY to Watchlist: View: Get Complete DY Trend Analysis ➞ | |
 | CMPO CompoSecure, Inc. |
| Sector: Industrials | |
| SubSector: Metal Fabrication | |
| MarketCap: 535 Millions | |
| Recent Price: 6.69 Smart Investing & Trading Score: 68 | |
| Day Percent Change: 3.16% Day Change: 0.21 | |
| Week Change: 2.45% Year-to-date Change: 22.3% | |
| CMPO Links: Profile News Message Board | |
| Charts:- Daily , Weekly | |
| Add CMPO to Watchlist: View: Get Complete CMPO Trend Analysis ➞ | |
| Too many stocks? View smallcap stocks filtered by marketcap & sector |
| Marketcap: All SmallCap Stocks (default-no microcap), Large, Mid-Range, Small & MicroCap |
| Sector: Tech, Finance, Energy, Staples, Retail, Industrial, Materials, Utilities & Medical |
|
Best Stocks Today 12Stocks.com |
© 2024 12Stocks.com Terms & Conditions Privacy Contact Us
All Information Provided Only For Education And Not To Be Used For Investing or Trading. See Terms & Conditions


One More Thing ... Get Best Stocks Delivered Daily!
Never Ever Miss A Move With Our Top Ten Stocks Lists
Find Best Stocks In Any Market - Bull or Bear Market
Take A Peek At Our Top Ten Stocks Lists: Daily, Weekly, Year-to-Date & Top Trends
Find Best Stocks In Any Market - Bull or Bear Market
Take A Peek At Our Top Ten Stocks Lists: Daily, Weekly, Year-to-Date & Top Trends
Smallcap Stocks With Best Up Trends [0-bearish to 100-bullish]: B. Riley[100], Central Pacific[100], California Water[100], Cricut [100], Carpenter [100], Haemonetics [100], Sanmina [100], Trustmark [100], Comstock Resources[100], EchoStar [100], Mueller Industries[100]
Best Smallcap Stocks Year-to-Date:
CareMax [490.72%], Janux [338.34%], Viking [270.02%], Alpine Immune[239.52%], Longboard [218%], Super Micro[177%], Arcutis Bio[166.56%], Avidity Biosciences[159.79%], Vera [149.94%], Hippo [128.87%], Stoke [122.15%] Best Smallcap Stocks This Week:
Matterport [168.97%], B. Riley[73.54%], Impinj [33.73%], ProKidney [32.84%], Seres [32.65%], Riot Blockchain[32.64%], Ribbon [25.58%], Cullinan Oncology[22.92%], P.A.M. Transportation[22.85%], NuScale Power[21.44%], Hibbett Sports[21.03%] Best Smallcap Stocks Daily:
Impinj [28.65%], P.A.M. Transportation[17.95%], B. Riley[16.61%], Strategic Education[16.28%], OptiNose [14.56%], JELD-WEN Holding[11.54%], Sonic Automotive[10.86%], Intevac [10.54%], SiTime [8.84%], Noodles & [8.08%], ProKidney [7.75%]