
 Login Sign Up


| |||||
 |  | ||||

| 12Stocks.com Market Intelligence |
Best SmallCap Stocks
|
| In a hurry? Small Cap Stock Lists: Performance Trends Table, Stock Charts
Sort Small Cap stocks: Daily, Weekly, Year-to-Date, Market Cap & Trends. Filter Small Cap stocks list by sector: Show all, Tech, Finance, Energy, Staples, Retail, Industrial, Materials, Utilities and HealthCare Filter Small Cap stocks list by size: All Large Medium Small and MicroCap |
| 12Stocks.com Small Cap Stocks Performances & Trends Daily | |||||||||
|
|  The overall Smart Investing & Trading Score is 23 (0-bearish to 100-bullish) which puts Small Cap index in short term bearish to neutral trend. The Smart Investing & Trading Score from previous trading session is 13 and hence an improvement of trend.
| ||||||||
Here are the Smart Investing & Trading Scores of the most requested small cap stocks at 12Stocks.com (click stock name for detailed review):
|


| 12Stocks.com: Investing in Smallcap Index with Stocks | |
|
The following table helps investors and traders sort through current performance and trends (as measured by Smart Investing & Trading Score) of various
stocks in the Smallcap Index. Quick View: Move mouse or cursor over stock symbol (ticker) to view short-term technical chart and over stock name to view long term chart. Click on  to add stock symbol to your watchlist and to add stock symbol to your watchlist and  to view watchlist. Click on any ticker or stock name for detailed market intelligence report for that stock. to view watchlist. Click on any ticker or stock name for detailed market intelligence report for that stock. |
12Stocks.com Performance of Stocks in Smallcap Index
| Ticker | Stock Name | Watchlist | Category | Recent Price | Smart Investing & Trading Score | Change % | YTD Change% |
| ARR | ARMOUR Residential |   | Financials | 17.71 | 25 | 1.14% | -8.33% |
| PBI | Pitney Bowes | | Consumer Staples | 4.03 | 17 | 2.54% | -8.41% |
| INVA | Innoviva | | Health Care | 14.69 | 42 | 1.45% | -8.42% |
| HA | Hawaiian | | Transports | 12.99 | 12 | -1.96% | -8.52% |
| INN | Summit Hotel | | Financials | 6.14 | 10 | -0.49% | -8.63% |
| AAT | American Assets | | Financials | 20.56 | 35 | 0.49% | -8.66% |
| YOU | Clear Secure | | Technology | 18.93 | 43 | 0.61% | -8.66% |
| IVR | Invesco Mortgage | | Financials | 8.09 | 20 | -0.49% | -8.69% |
| CPRX | Catalyst | | Health Care | 15.34 | 41 | -2.97% | -8.74% |
| SKYT | SkyWater | | Technology | 8.79 | 33 | 0.46% | -8.77% |
| TRC | Tejon Ranch | | Financials | 15.69 | 87 | 5.44% | -8.78% |
| MFA | MFA Financial | | Financials | 10.28 | 10 | 0.29% | -8.78% |
| FBRT | Franklin BSP | | Financials | 12.43 | 32 | 1.76% | -8.83% |
| WSFS | WSFS Financial | | Financials | 41.85 | 20 | 0.26% | -8.88% |
| DHX | DHI Group | | Services & Goods | 2.36 | 68 | 2.61% | -8.88% |
| NSP | Insperity | | Services & Goods | 106.80 | 52 | 0.99% | -8.89% |
| CVGW | Calavo Growers | | Consumer Staples | 26.78 | 85 | 2.88% | -8.94% |
| THR | Thermon Group | | Industrials | 29.65 | 0 | -0.44% | -8.97% |
| NXRT | NexPoint Residential | | Financials | 31.33 | 49 | 1.79% | -9.00% |
| CSGS | CSG Systems | | Technology | 48.40 | 32 | 0.83% | -9.04% |
| VRTS | Virtus | | Financials | 219.80 | 10 | 0.56% | -9.08% |
| EVTC | EVERTEC | | Technology | 37.19 | 17 | 0.27% | -9.16% |
| NRDS | NerdWallet | | Financials | 13.57 | 32 | 1.72% | -9.17% |
| MC | Moelis & | | Financials | 50.97 | 10 | -0.57% | -9.19% |
| LKFN | Lakeland Financial | | Financials | 59.12 | 23 | 0.75% | -9.27% |


| Too many stocks? View smallcap stocks filtered by marketcap & sector |
| Marketcap: All SmallCap Stocks (default-no microcap), Large, Mid-Range, Small |
| Smallcap Sector: Tech, Finance, Energy, Staples, Retail, Industrial, Materials, & Medical |
|
Get the most comprehensive stock market coverage daily at 12Stocks.com ➞ Best Stocks Today ➞ Best Stocks Weekly ➞ Best Stocks Year-to-Date ➞ Best Stocks Trends ➞  Best Stocks Today 12Stocks.com Best Nasdaq Stocks ➞ Best S&P 500 Stocks ➞ Best Tech Stocks ➞ Best Biotech Stocks ➞ |
| Detailed Overview of SmallCap Stocks |
| SmallCap Technical Overview, Leaders & Laggards, Top SmallCap ETF Funds & Detailed SmallCap Stocks List, Charts, Trends & More |
| Smallcap: Technical Analysis, Trends & YTD Performance | |
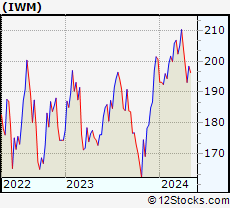
| SmallCap segment as represented by
IWM, an exchange-traded fund [ETF], holds basket of thousands of smallcap stocks from across all major sectors of the US stock market. The smallcap index (contains stocks like Riverbed & Sotheby's) is down by -3.92% and is currently underperforming the overall market by -8.11% year-to-date. Below is a quick view of technical charts and trends: | |
 IWM Weekly Chart |
|
| Long Term Trend: Not Good | |
| Medium Term Trend: Not Good | |
 IWM Daily Chart |
|
| Short Term Trend: Not Good | |
| Overall Trend Score: 23 | |
| YTD Performance: -3.92% | |
| **Trend Scores & Views Are Only For Educational Purposes And Not For Investing | |
| 12Stocks.com: Top Performing Small Cap Index Stocks | ||||||||||||||||||||||||||||||||||||||||||||||||
 The top performing Small Cap Index stocks year to date are
Now, more recently, over last week, the top performing Small Cap Index stocks on the move are


|
||||||||||||||||||||||||||||||||||||||||||||||||
| 12Stocks.com: Investing in Smallcap Index using Exchange Traded Funds | |
|
The following table shows list of key exchange traded funds (ETF) that
help investors track Smallcap index. The following list also includes leveraged ETF funds that track twice or thrice the daily returns of Smallcap indices. Short or inverse ETF funds move in the opposite direction to the index they track and are useful during market pullbacks or during bear markets. Quick View: Move mouse or cursor over ETF symbol (ticker) to view short-term technical chart and over ETF name to view long term chart. Click on ticker or stock name for detailed view. Click on to add stock symbol to your watchlist and to view watchlist. |
12Stocks.com List of ETFs that track Smallcap Index
| Ticker | ETF Name | Watchlist | Recent Price | Smart Investing & Trading Score | Change % | Week % | Year-to-date % |
| IWM | iShares Russell 2000 | | 192.84 | 23 | -0.08 | -2.94 | -3.92% |
| IJR | iShares Core S&P Small-Cap | | 102.34 | 10 | 0.21 | -2.08 | -5.46% |
| VTWO | Vanguard Russell 2000 ETF | | 77.95 | 23 | -0.13 | -2.95 | -3.88% |
| IWN | iShares Russell 2000 Value | | 146.33 | 10 | 0.21 | -2.69 | -5.79% |
| IJS | iShares S&P Small-Cap 600 Value | | 94.51 | 18 | 0.41 | -1.73 | -8.31% |
| IWO | iShares Russell 2000 Growth | | 246.94 | 36 | -0.44 | -3.3 | -2.09% |
| IJT | iShares S&P Small-Cap 600 Growth | | 121.57 | 13 | -0.22 | -2.57 | -2.85% |
| XSLV | PowerShares S&P SmallCap Low Volatil ETF | | 41.65 | 25 | 0.56 | -1.05 | -5.66% |
| SAA | ProShares Ultra SmallCap600 | | 21.62 | 10 | -0.18 | -4.17 | -13.35% |
| SMLV | SPDR SSGA US Small Cap Low Volatil ETF | | 103.83 | 10 | 0.16 | -1.13 | -7.72% |
| SBB | ProShares Short SmallCap600 | | 16.98 | 100 | 0.77 | 2.62 | 6.59% |
| SDD | ProShares UltraShort SmallCap600 | | 20.69 | 95 | 0.44 | 4.33 | 12.28% |
| 12Stocks.com: Charts, Trends, Fundamental Data and Performances of SmallCap Stocks | |
|
We now take in-depth look at all SmallCap stocks including charts, multi-period performances and overall trends (as measured by Smart Investing & Trading Score). One can sort SmallCap stocks (click link to choose) by Daily, Weekly and by Year-to-Date performances. Also, one can sort by size of the company or by market capitalization. |
| Select Your Default Chart Type: | |||||
| |||||
| Click on stock symbol or name for detailed view. Click on to add stock symbol to your watchlist and to view watchlist. Quick View: Move mouse or cursor over "Daily" to quickly view daily technical stock chart and over "Weekly" to view weekly technical stock chart. | |||||

 | ARR ARMOUR Residential REIT, Inc. |
| Sector: Financials | |
| SubSector: Mortgage Investment | |
| MarketCap: 578.739 Millions | |
| Recent Price: 17.71 Smart Investing & Trading Score: 25 | |
| Day Percent Change: 1.14% Day Change: 0.20 | |
| Week Change: -3.85% Year-to-date Change: -8.3% | |
| ARR Links: Profile News Message Board | |
| Charts:- Daily , Weekly | |
| Add ARR to Watchlist: View: Get Complete ARR Trend Analysis ➞ | |
 | PBI Pitney Bowes Inc. |
| Sector: Consumer Staples | |
| SubSector: Business Equipment | |
| MarketCap: 408.067 Millions | |
| Recent Price: 4.03 Smart Investing & Trading Score: 17 | |
| Day Percent Change: 2.54% Day Change: 0.10 | |
| Week Change: -0.98% Year-to-date Change: -8.4% | |
| PBI Links: Profile News Message Board | |
| Charts:- Daily , Weekly | |
| Add PBI to Watchlist: View: Get Complete PBI Trend Analysis ➞ | |
 | INVA Innoviva, Inc. |
| Sector: Health Care | |
| SubSector: Biotechnology | |
| MarketCap: 1023.15 Millions | |
| Recent Price: 14.69 Smart Investing & Trading Score: 42 | |
| Day Percent Change: 1.45% Day Change: 0.21 | |
| Week Change: 0.41% Year-to-date Change: -8.4% | |
| INVA Links: Profile News Message Board | |
| Charts:- Daily , Weekly | |
| Add INVA to Watchlist: View: Get Complete INVA Trend Analysis ➞ | |
 | HA Hawaiian Holdings, Inc. |
| Sector: Transports | |
| SubSector: Regional Airlines | |
| MarketCap: 509.47 Millions | |
| Recent Price: 12.99 Smart Investing & Trading Score: 12 | |
| Day Percent Change: -1.96% Day Change: -0.26 | |
| Week Change: -0.15% Year-to-date Change: -8.5% | |
| HA Links: Profile News Message Board | |
| Charts:- Daily , Weekly | |
| Add HA to Watchlist: View: Get Complete HA Trend Analysis ➞ | |
 | INN Summit Hotel Properties, Inc. |
| Sector: Financials | |
| SubSector: Real Estate Development | |
| MarketCap: 402.019 Millions | |
| Recent Price: 6.14 Smart Investing & Trading Score: 10 | |
| Day Percent Change: -0.49% Day Change: -0.03 | |
| Week Change: -5.54% Year-to-date Change: -8.6% | |
| INN Links: Profile News Message Board | |
| Charts:- Daily , Weekly | |
| Add INN to Watchlist: View: Get Complete INN Trend Analysis ➞ | |
 | AAT American Assets Trust, Inc. |
| Sector: Financials | |
| SubSector: REIT - Retail | |
| MarketCap: 1580.54 Millions | |
| Recent Price: 20.56 Smart Investing & Trading Score: 35 | |
| Day Percent Change: 0.49% Day Change: 0.10 | |
| Week Change: -1.01% Year-to-date Change: -8.7% | |
| AAT Links: Profile News Message Board | |
| Charts:- Daily , Weekly | |
| Add AAT to Watchlist: View: Get Complete AAT Trend Analysis ➞ | |
 | YOU Clear Secure, Inc. |
| Sector: Technology | |
| SubSector: Software - Application | |
| MarketCap: 3510 Millions | |
| Recent Price: 18.93 Smart Investing & Trading Score: 43 | |
| Day Percent Change: 0.61% Day Change: 0.12 | |
| Week Change: -2.3% Year-to-date Change: -8.7% | |
| YOU Links: Profile News Message Board | |
| Charts:- Daily , Weekly | |
| Add YOU to Watchlist: View: Get Complete YOU Trend Analysis ➞ | |
 | IVR Invesco Mortgage Capital Inc. |
| Sector: Financials | |
| SubSector: Mortgage Investment | |
| MarketCap: 1182.19 Millions | |
| Recent Price: 8.09 Smart Investing & Trading Score: 20 | |
| Day Percent Change: -0.49% Day Change: -0.04 | |
| Week Change: -4.49% Year-to-date Change: -8.7% | |
| IVR Links: Profile News Message Board | |
| Charts:- Daily , Weekly | |
| Add IVR to Watchlist: View: Get Complete IVR Trend Analysis ➞ | |
 | CPRX Catalyst Pharmaceuticals, Inc. |
| Sector: Health Care | |
| SubSector: Biotechnology | |
| MarketCap: 365.185 Millions | |
| Recent Price: 15.34 Smart Investing & Trading Score: 41 | |
| Day Percent Change: -2.97% Day Change: -0.47 | |
| Week Change: 0.79% Year-to-date Change: -8.7% | |
| CPRX Links: Profile News Message Board | |
| Charts:- Daily , Weekly | |
| Add CPRX to Watchlist: View: Get Complete CPRX Trend Analysis ➞ | |
 | SKYT SkyWater Technology, Inc. |
| Sector: Technology | |
| SubSector: Semiconductors | |
| MarketCap: 394 Millions | |
| Recent Price: 8.79 Smart Investing & Trading Score: 33 | |
| Day Percent Change: 0.46% Day Change: 0.04 | |
| Week Change: -9.79% Year-to-date Change: -8.8% | |
| SKYT Links: Profile News Message Board | |
| Charts:- Daily , Weekly | |
| Add SKYT to Watchlist: View: Get Complete SKYT Trend Analysis ➞ | |
 | TRC Tejon Ranch Co. |
| Sector: Financials | |
| SubSector: Property Management | |
| MarketCap: 346.442 Millions | |
| Recent Price: 15.69 Smart Investing & Trading Score: 87 | |
| Day Percent Change: 5.44% Day Change: 0.81 | |
| Week Change: 3.22% Year-to-date Change: -8.8% | |
| TRC Links: Profile News Message Board | |
| Charts:- Daily , Weekly | |
| Add TRC to Watchlist: View: Get Complete TRC Trend Analysis ➞ | |
 | MFA MFA Financial, Inc. |
| Sector: Financials | |
| SubSector: Mortgage Investment | |
| MarketCap: 1869.69 Millions | |
| Recent Price: 10.28 Smart Investing & Trading Score: 10 | |
| Day Percent Change: 0.29% Day Change: 0.03 | |
| Week Change: -4.1% Year-to-date Change: -8.8% | |
| MFA Links: Profile News Message Board | |
| Charts:- Daily , Weekly | |
| Add MFA to Watchlist: View: Get Complete MFA Trend Analysis ➞ | |
 | FBRT Franklin BSP Realty Trust, Inc. |
| Sector: Financials | |
| SubSector: REIT - Mortgage | |
| MarketCap: 1170 Millions | |
| Recent Price: 12.43 Smart Investing & Trading Score: 32 | |
| Day Percent Change: 1.76% Day Change: 0.21 | |
| Week Change: 0.53% Year-to-date Change: -8.8% | |
| FBRT Links: Profile News Message Board | |
| Charts:- Daily , Weekly | |
| Add FBRT to Watchlist: View: Get Complete FBRT Trend Analysis ➞ | |
 | WSFS WSFS Financial Corporation |
| Sector: Financials | |
| SubSector: Regional - Mid-Atlantic Banks | |
| MarketCap: 1191.29 Millions | |
| Recent Price: 41.85 Smart Investing & Trading Score: 20 | |
| Day Percent Change: 0.26% Day Change: 0.11 | |
| Week Change: -2.11% Year-to-date Change: -8.9% | |
| WSFS Links: Profile News Message Board | |
| Charts:- Daily , Weekly | |
| Add WSFS to Watchlist: View: Get Complete WSFS Trend Analysis ➞ | |
 | DHX DHI Group, Inc. |
| Sector: Services & Goods | |
| SubSector: Staffing & Outsourcing Services | |
| MarketCap: 144.728 Millions | |
| Recent Price: 2.36 Smart Investing & Trading Score: 68 | |
| Day Percent Change: 2.61% Day Change: 0.06 | |
| Week Change: 3.96% Year-to-date Change: -8.9% | |
| DHX Links: Profile News Message Board | |
| Charts:- Daily , Weekly | |
| Add DHX to Watchlist: View: Get Complete DHX Trend Analysis ➞ | |
 | NSP Insperity, Inc. |
| Sector: Services & Goods | |
| SubSector: Business Services | |
| MarketCap: 1385.32 Millions | |
| Recent Price: 106.80 Smart Investing & Trading Score: 52 | |
| Day Percent Change: 0.99% Day Change: 1.05 | |
| Week Change: 0.83% Year-to-date Change: -8.9% | |
| NSP Links: Profile News Message Board | |
| Charts:- Daily , Weekly | |
| Add NSP to Watchlist: View: Get Complete NSP Trend Analysis ➞ | |
 | CVGW Calavo Growers, Inc. |
| Sector: Consumer Staples | |
| SubSector: Farm Products | |
| MarketCap: 935.287 Millions | |
| Recent Price: 26.78 Smart Investing & Trading Score: 85 | |
| Day Percent Change: 2.88% Day Change: 0.75 | |
| Week Change: 9.57% Year-to-date Change: -8.9% | |
| CVGW Links: Profile News Message Board | |
| Charts:- Daily , Weekly | |
| Add CVGW to Watchlist: View: Get Complete CVGW Trend Analysis ➞ | |
 | THR Thermon Group Holdings, Inc. |
| Sector: Industrials | |
| SubSector: Diversified Machinery | |
| MarketCap: 492.816 Millions | |
| Recent Price: 29.65 Smart Investing & Trading Score: 0 | |
| Day Percent Change: -0.44% Day Change: -0.13 | |
| Week Change: -4.14% Year-to-date Change: -9.0% | |
| THR Links: Profile News Message Board | |
| Charts:- Daily , Weekly | |
| Add THR to Watchlist: View: Get Complete THR Trend Analysis ➞ | |
 | NXRT NexPoint Residential Trust, Inc. |
| Sector: Financials | |
| SubSector: REIT - Residential | |
| MarketCap: 839.161 Millions | |
| Recent Price: 31.33 Smart Investing & Trading Score: 49 | |
| Day Percent Change: 1.79% Day Change: 0.55 | |
| Week Change: -1.76% Year-to-date Change: -9.0% | |
| NXRT Links: Profile News Message Board | |
| Charts:- Daily , Weekly | |
| Add NXRT to Watchlist: View: Get Complete NXRT Trend Analysis ➞ | |
 | CSGS CSG Systems International, Inc. |
| Sector: Technology | |
| SubSector: Business Software & Services | |
| MarketCap: 1336.78 Millions | |
| Recent Price: 48.40 Smart Investing & Trading Score: 32 | |
| Day Percent Change: 0.83% Day Change: 0.40 | |
| Week Change: 0.48% Year-to-date Change: -9.0% | |
| CSGS Links: Profile News Message Board | |
| Charts:- Daily , Weekly | |
| Add CSGS to Watchlist: View: Get Complete CSGS Trend Analysis ➞ | |
 | VRTS Virtus Investment Partners, Inc. |
| Sector: Financials | |
| SubSector: Asset Management | |
| MarketCap: 601.303 Millions | |
| Recent Price: 219.80 Smart Investing & Trading Score: 10 | |
| Day Percent Change: 0.56% Day Change: 1.22 | |
| Week Change: -2.58% Year-to-date Change: -9.1% | |
| VRTS Links: Profile News Message Board | |
| Charts:- Daily , Weekly | |
| Add VRTS to Watchlist: View: Get Complete VRTS Trend Analysis ➞ | |
 | EVTC EVERTEC, Inc. |
| Sector: Technology | |
| SubSector: Business Software & Services | |
| MarketCap: 1646.08 Millions | |
| Recent Price: 37.19 Smart Investing & Trading Score: 17 | |
| Day Percent Change: 0.27% Day Change: 0.10 | |
| Week Change: -0.48% Year-to-date Change: -9.2% | |
| EVTC Links: Profile News Message Board | |
| Charts:- Daily , Weekly | |
| Add EVTC to Watchlist: View: Get Complete EVTC Trend Analysis ➞ | |
 | NRDS NerdWallet, Inc. |
| Sector: Financials | |
| SubSector: Credit Services | |
| MarketCap: 759 Millions | |
| Recent Price: 13.57 Smart Investing & Trading Score: 32 | |
| Day Percent Change: 1.72% Day Change: 0.23 | |
| Week Change: -2.02% Year-to-date Change: -9.2% | |
| NRDS Links: Profile News Message Board | |
| Charts:- Daily , Weekly | |
| Add NRDS to Watchlist: View: Get Complete NRDS Trend Analysis ➞ | |
 | MC Moelis & Company |
| Sector: Financials | |
| SubSector: Asset Management | |
| MarketCap: 1675.93 Millions | |
| Recent Price: 50.97 Smart Investing & Trading Score: 10 | |
| Day Percent Change: -0.57% Day Change: -0.29 | |
| Week Change: -2.07% Year-to-date Change: -9.2% | |
| MC Links: Profile News Message Board | |
| Charts:- Daily , Weekly | |
| Add MC to Watchlist: View: Get Complete MC Trend Analysis ➞ | |
 | LKFN Lakeland Financial Corporation |
| Sector: Financials | |
| SubSector: Regional - Midwest Banks | |
| MarketCap: 903.27 Millions | |
| Recent Price: 59.12 Smart Investing & Trading Score: 23 | |
| Day Percent Change: 0.75% Day Change: 0.44 | |
| Week Change: 1.09% Year-to-date Change: -9.3% | |
| LKFN Links: Profile News Message Board | |
| Charts:- Daily , Weekly | |
| Add LKFN to Watchlist: View: Get Complete LKFN Trend Analysis ➞ | |
| Too many stocks? View smallcap stocks filtered by marketcap & sector |
| Marketcap: All SmallCap Stocks (default-no microcap), Large, Mid-Range, Small & MicroCap |
| Sector: Tech, Finance, Energy, Staples, Retail, Industrial, Materials, Utilities & Medical |
|
Best Stocks Today 12Stocks.com |
© 2024 12Stocks.com Terms & Conditions Privacy Contact Us
All Information Provided Only For Education And Not To Be Used For Investing or Trading. See Terms & Conditions


One More Thing ... Get Best Stocks Delivered Daily!
Never Ever Miss A Move With Our Top Ten Stocks Lists
Find Best Stocks In Any Market - Bull or Bear Market
Take A Peek At Our Top Ten Stocks Lists: Daily, Weekly, Year-to-Date & Top Trends
Find Best Stocks In Any Market - Bull or Bear Market
Take A Peek At Our Top Ten Stocks Lists: Daily, Weekly, Year-to-Date & Top Trends
Smallcap Stocks With Best Up Trends [0-bearish to 100-bullish]: Badger Meter[100], Cullinan Oncology[100], Oscar Health[100], NextNav [100], EchoStar [100], Victory Capital[100], Macatawa Bank[100], IMAX [100], Envestnet [100], ALX Oncology[100], Argan [95]
Best Smallcap Stocks Year-to-Date:
Agenus [500.31%], CareMax [417.53%], Janux [348.12%], Viking [247.5%], Alpine Immune[238.5%], Super Micro[226.63%], Longboard [194.76%], Arcutis Bio[192.57%], Vera [161.3%], Avidity Biosciences[154.87%], Hippo [128.32%] Best Smallcap Stocks This Week:
Macatawa Bank[44.42%], 23andMe Holding[33.3%], ProKidney [32%], Snap One[29.73%], Vertex Energy[25.96%], ALX Oncology[20.64%], Vanda [20.63%], Expensify [18.37%], Badger Meter[16.72%], ContextLogic [15%], Cullinan Oncology[13.89%] Best Smallcap Stocks Daily:
23andMe Holding[65.91%], Vertex Energy[33.78%], Zura Bio[17.20%], Badger Meter[16.65%], ContextLogic [15.81%], Expensify [15.23%], Montrose Environmental[12.84%], Vaxxinity [10.05%], Cipher Mining[8.65%], FiscalNote [8.61%], Vuzix [8.15%]