
 Login Sign Up


| |||||
 |  | ||||

| 12Stocks.com Market Intelligence |
Best SmallCap Stocks
|
| In a hurry? Small Cap Stock Lists: Performance Trends Table, Stock Charts
Sort Small Cap stocks: Daily, Weekly, Year-to-Date, Market Cap & Trends. Filter Small Cap stocks list by sector: Show all, Tech, Finance, Energy, Staples, Retail, Industrial, Materials, Utilities and HealthCare Filter Small Cap stocks list by size: All Large Medium Small and MicroCap |
| 12Stocks.com Small Cap Stocks Performances & Trends Daily | |||||||||
|
|  The overall Smart Investing & Trading Score is 56 (0-bearish to 100-bullish) which puts Small Cap index in short term neutral trend. The Smart Investing & Trading Score from previous trading session is 44 and hence an improvement of trend.
| ||||||||
Here are the Smart Investing & Trading Scores of the most requested small cap stocks at 12Stocks.com (click stock name for detailed review):
|


| 12Stocks.com: Investing in Smallcap Index with Stocks | |
|
The following table helps investors and traders sort through current performance and trends (as measured by Smart Investing & Trading Score) of various
stocks in the Smallcap Index. Quick View: Move mouse or cursor over stock symbol (ticker) to view short-term technical chart and over stock name to view long term chart. Click on  to add stock symbol to your watchlist and to add stock symbol to your watchlist and  to view watchlist. Click on any ticker or stock name for detailed market intelligence report for that stock. to view watchlist. Click on any ticker or stock name for detailed market intelligence report for that stock. |
12Stocks.com Performance of Stocks in Smallcap Index
| Ticker | Stock Name | Watchlist | Category | Recent Price | Smart Investing & Trading Score | Change % | YTD Change% |
| KYMR | Kymera |   | Health Care | 33.44 | 63 | 1.09% | 31.60% |
| HCI | HCI Group | | Financials | 115.00 | 78 | -0.93% | 31.58% |
| ENTA | Enanta | | Health Care | 12.38 | 46 | -0.80% | 31.56% |
| RXST | RxSight | | Health Care | 52.75 | 63 | 1.66% | 31.51% |
| PBF | PBF Energy | | Energy | 57.78 | 68 | 0.49% | 31.44% |
| SM | SM Energy | | Energy | 50.84 | 68 | 0.79% | 31.30% |
| AROC | Archrock | | Energy | 20.20 | 63 | 0.80% | 31.17% |
| IBP | Installed Building | | Industrials | 239.66 | 63 | 1.89% | 31.09% |
| STRA | Strategic Education | | Services & Goods | 120.99 | 65 | 3.37% | 30.98% |
| OMI | Owens & Minor | | Services & Goods | 25.09 | 61 | 4.02% | 30.20% |
| GNK | Genco Shipping | | Transports | 21.55 | 90 | 1.51% | 29.90% |
| VCEL | Vericel | | Health Care | 46.06 | 63 | 1.34% | 29.35% |
| DNOW | NOW | | Energy | 14.63 | 75 | -0.34% | 29.24% |
| HEAR | Turtle Beach | | Technology | 14.14 | 41 | 0.60% | 29.09% |
| SB | Safe Bulkers | | Transports | 5.06 | 95 | 0.40% | 28.75% |
| SLVM | Sylvamo | | Materials | 63.06 | 100 | 2.32% | 28.41% |
| NSSC | Napco Security | | Services & Goods | 43.81 | 100 | 0.99% | 27.91% |
| JYNT | Joint | | Health Care | 12.28 | 75 | 1.66% | 27.78% |
| PACK | Ranpak | | Industrials | 7.43 | 75 | 1.64% | 27.66% |
| AGTI | Agiliti | | Health Care | 10.05 | 54 | 0.10% | 27.54% |
| RSVR | Reservoir Media | | Services & Goods | 9.08 | 100 | 6.32% | 27.53% |
| CMPO | CompoSecure | | Industrials | 6.97 | 68 | 4.19% | 27.42% |
| PSN | Parsons | | Industrials | 79.73 | 48 | 0.57% | 27.14% |
| ITRI | Itron | | Technology | 95.80 | 95 | 1.49% | 26.87% |
| LBRT | Liberty Oilfield | | Energy | 23.01 | 61 | 0.00% | 26.85% |


| Too many stocks? View smallcap stocks filtered by marketcap & sector |
| Marketcap: All SmallCap Stocks (default-no microcap), Large, Mid-Range, Small |
| Smallcap Sector: Tech, Finance, Energy, Staples, Retail, Industrial, Materials, & Medical |
|
Get the most comprehensive stock market coverage daily at 12Stocks.com ➞ Best Stocks Today ➞ Best Stocks Weekly ➞ Best Stocks Year-to-Date ➞ Best Stocks Trends ➞  Best Stocks Today 12Stocks.com Best Nasdaq Stocks ➞ Best S&P 500 Stocks ➞ Best Tech Stocks ➞ Best Biotech Stocks ➞ |
| Detailed Overview of SmallCap Stocks |
| SmallCap Technical Overview, Leaders & Laggards, Top SmallCap ETF Funds & Detailed SmallCap Stocks List, Charts, Trends & More |
| Smallcap: Technical Analysis, Trends & YTD Performance | |
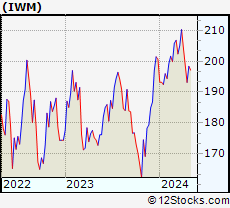
| SmallCap segment as represented by
IWM, an exchange-traded fund [ETF], holds basket of thousands of smallcap stocks from across all major sectors of the US stock market. The smallcap index (contains stocks like Riverbed & Sotheby's) is down by -1.16% and is currently underperforming the overall market by -7.3% year-to-date. Below is a quick view of technical charts and trends: | |
 IWM Weekly Chart |
|
| Long Term Trend: Good | |
| Medium Term Trend: Not Good | |
 IWM Daily Chart |
|
| Short Term Trend: Very Good | |
| Overall Trend Score: 56 | |
| YTD Performance: -1.16% | |
| **Trend Scores & Views Are Only For Educational Purposes And Not For Investing | |
| 12Stocks.com: Top Performing Small Cap Index Stocks | ||||||||||||||||||||||||||||||||||||||||||||||||
 The top performing Small Cap Index stocks year to date are
Now, more recently, over last week, the top performing Small Cap Index stocks on the move are


|
||||||||||||||||||||||||||||||||||||||||||||||||
| 12Stocks.com: Investing in Smallcap Index using Exchange Traded Funds | |
|
The following table shows list of key exchange traded funds (ETF) that
help investors track Smallcap index. The following list also includes leveraged ETF funds that track twice or thrice the daily returns of Smallcap indices. Short or inverse ETF funds move in the opposite direction to the index they track and are useful during market pullbacks or during bear markets. Quick View: Move mouse or cursor over ETF symbol (ticker) to view short-term technical chart and over ETF name to view long term chart. Click on ticker or stock name for detailed view. Click on to add stock symbol to your watchlist and to view watchlist. |
12Stocks.com List of ETFs that track Smallcap Index
| Ticker | ETF Name | Watchlist | Recent Price | Smart Investing & Trading Score | Change % | Week % | Year-to-date % |
| IWM | iShares Russell 2000 | | 198.39 | 56 | 0.97 | 2.72 | -1.16% |
| IJR | iShares Core S&P Small-Cap | | 105.65 | 85 | 0.75 | 2.35 | -2.4% |
| VTWO | Vanguard Russell 2000 ETF | | 80.28 | 70 | 1.04 | 2.82 | -1.01% |
| IWN | iShares Russell 2000 Value | | 151.14 | 75 | 0.64 | 2.27 | -2.7% |
| IWO | iShares Russell 2000 Growth | | 253.09 | 58 | 1.29 | 3.18 | 0.34% |
| IJS | iShares S&P Small-Cap 600 Value | | 97.19 | 67 | 0.52 | 1.65 | -5.7% |
| IJT | iShares S&P Small-Cap 600 Growth | | 126.16 | 70 | 0.88 | 3.23 | 0.82% |
| XSLV | PowerShares S&P SmallCap Low Volatil ETF | | 42.72 | 80 | 0.42 | 1.28 | -3.24% |
| SAA | ProShares Ultra SmallCap600 | | 23.04 | 65 | 1.65 | 5.67 | -7.68% |
| SBB | ProShares Short SmallCap600 | | 16.39 | 33 | -0.70 | -2.7 | 2.86% |
| SDD | ProShares UltraShort SmallCap600 | | 19.35 | 35 | -1.17 | -4.87 | 5.01% |
| SMLV | SPDR SSGA US Small Cap Low Volatil ETF | | 107.52 | 80 | 0.18 | 1.35 | -4.44% |
| 12Stocks.com: Charts, Trends, Fundamental Data and Performances of SmallCap Stocks | |
|
We now take in-depth look at all SmallCap stocks including charts, multi-period performances and overall trends (as measured by Smart Investing & Trading Score). One can sort SmallCap stocks (click link to choose) by Daily, Weekly and by Year-to-Date performances. Also, one can sort by size of the company or by market capitalization. |
| Select Your Default Chart Type: | |||||
| |||||
| Click on stock symbol or name for detailed view. Click on to add stock symbol to your watchlist and to view watchlist. Quick View: Move mouse or cursor over "Daily" to quickly view daily technical stock chart and over "Weekly" to view weekly technical stock chart. | |||||

 | KYMR Kymera Therapeutics, Inc. |
| Sector: Health Care | |
| SubSector: Biotechnology | |
| MarketCap: 27087 Millions | |
| Recent Price: 33.44 Smart Investing & Trading Score: 63 | |
| Day Percent Change: 1.09% Day Change: 0.36 | |
| Week Change: -3.46% Year-to-date Change: 31.6% | |
| KYMR Links: Profile News Message Board | |
| Charts:- Daily , Weekly | |
| Add KYMR to Watchlist: View: Get Complete KYMR Trend Analysis ➞ | |
 | HCI HCI Group, Inc. |
| Sector: Financials | |
| SubSector: Property & Casualty Insurance | |
| MarketCap: 297.412 Millions | |
| Recent Price: 115.00 Smart Investing & Trading Score: 78 | |
| Day Percent Change: -0.93% Day Change: -1.08 | |
| Week Change: 2.78% Year-to-date Change: 31.6% | |
| HCI Links: Profile News Message Board | |
| Charts:- Daily , Weekly | |
| Add HCI to Watchlist: View: Get Complete HCI Trend Analysis ➞ | |
 | ENTA Enanta Pharmaceuticals, Inc. |
| Sector: Health Care | |
| SubSector: Biotechnology | |
| MarketCap: 998.385 Millions | |
| Recent Price: 12.38 Smart Investing & Trading Score: 46 | |
| Day Percent Change: -0.80% Day Change: -0.10 | |
| Week Change: -7.06% Year-to-date Change: 31.6% | |
| ENTA Links: Profile News Message Board | |
| Charts:- Daily , Weekly | |
| Add ENTA to Watchlist: View: Get Complete ENTA Trend Analysis ➞ | |
 | RXST RxSight, Inc. |
| Sector: Health Care | |
| SubSector: Medical Devices | |
| MarketCap: 893 Millions | |
| Recent Price: 52.75 Smart Investing & Trading Score: 63 | |
| Day Percent Change: 1.66% Day Change: 0.86 | |
| Week Change: 2.27% Year-to-date Change: 31.5% | |
| RXST Links: Profile News Message Board | |
| Charts:- Daily , Weekly | |
| Add RXST to Watchlist: View: Get Complete RXST Trend Analysis ➞ | |
 | PBF PBF Energy Inc |
| Sector: Energy | |
| SubSector: Oil & Gas Refining & Marketing | |
| MarketCap: 1118.54 Millions | |
| Recent Price: 57.78 Smart Investing & Trading Score: 68 | |
| Day Percent Change: 0.49% Day Change: 0.28 | |
| Week Change: 3.33% Year-to-date Change: 31.4% | |
| PBF Links: Profile News Message Board | |
| Charts:- Daily , Weekly | |
| Add PBF to Watchlist: View: Get Complete PBF Trend Analysis ➞ | |
 | SM SM Energy Company |
| Sector: Energy | |
| SubSector: Independent Oil & Gas | |
| MarketCap: 137.593 Millions | |
| Recent Price: 50.84 Smart Investing & Trading Score: 68 | |
| Day Percent Change: 0.79% Day Change: 0.40 | |
| Week Change: 5.72% Year-to-date Change: 31.3% | |
| SM Links: Profile News Message Board | |
| Charts:- Daily , Weekly | |
| Add SM to Watchlist: View: Get Complete SM Trend Analysis ➞ | |
 | AROC Archrock, Inc. |
| Sector: Energy | |
| SubSector: Oil & Gas Equipment & Services | |
| MarketCap: 614.961 Millions | |
| Recent Price: 20.20 Smart Investing & Trading Score: 63 | |
| Day Percent Change: 0.80% Day Change: 0.16 | |
| Week Change: 3.91% Year-to-date Change: 31.2% | |
| AROC Links: Profile News Message Board | |
| Charts:- Daily , Weekly | |
| Add AROC to Watchlist: View: Get Complete AROC Trend Analysis ➞ | |
 | IBP Installed Building Products, Inc. |
| Sector: Industrials | |
| SubSector: General Building Materials | |
| MarketCap: 1284.23 Millions | |
| Recent Price: 239.66 Smart Investing & Trading Score: 63 | |
| Day Percent Change: 1.89% Day Change: 4.44 | |
| Week Change: 8.28% Year-to-date Change: 31.1% | |
| IBP Links: Profile News Message Board | |
| Charts:- Daily , Weekly | |
| Add IBP to Watchlist: View: Get Complete IBP Trend Analysis ➞ | |
 | STRA Strategic Education, Inc. |
| Sector: Services & Goods | |
| SubSector: Education & Training Services | |
| MarketCap: 2621.56 Millions | |
| Recent Price: 120.99 Smart Investing & Trading Score: 65 | |
| Day Percent Change: 3.37% Day Change: 3.95 | |
| Week Change: 23.32% Year-to-date Change: 31.0% | |
| STRA Links: Profile News Message Board | |
| Charts:- Daily , Weekly | |
| Add STRA to Watchlist: View: Get Complete STRA Trend Analysis ➞ | |
 | OMI Owens & Minor, Inc. |
| Sector: Services & Goods | |
| SubSector: Medical Equipment Wholesale | |
| MarketCap: 403.92 Millions | |
| Recent Price: 25.09 Smart Investing & Trading Score: 61 | |
| Day Percent Change: 4.02% Day Change: 0.97 | |
| Week Change: 1.21% Year-to-date Change: 30.2% | |
| OMI Links: Profile News Message Board | |
| Charts:- Daily , Weekly | |
| Add OMI to Watchlist: View: Get Complete OMI Trend Analysis ➞ | |
 | GNK Genco Shipping & Trading Limited |
| Sector: Transports | |
| SubSector: Shipping | |
| MarketCap: 251.614 Millions | |
| Recent Price: 21.55 Smart Investing & Trading Score: 90 | |
| Day Percent Change: 1.51% Day Change: 0.32 | |
| Week Change: 4.87% Year-to-date Change: 29.9% | |
| GNK Links: Profile News Message Board | |
| Charts:- Daily , Weekly | |
| Add GNK to Watchlist: View: Get Complete GNK Trend Analysis ➞ | |
 | VCEL Vericel Corporation |
| Sector: Health Care | |
| SubSector: Biotechnology | |
| MarketCap: 391.885 Millions | |
| Recent Price: 46.06 Smart Investing & Trading Score: 63 | |
| Day Percent Change: 1.34% Day Change: 0.61 | |
| Week Change: 5.3% Year-to-date Change: 29.4% | |
| VCEL Links: Profile News Message Board | |
| Charts:- Daily , Weekly | |
| Add VCEL to Watchlist: View: Get Complete VCEL Trend Analysis ➞ | |
 | DNOW NOW Inc. |
| Sector: Energy | |
| SubSector: Oil & Gas Equipment & Services | |
| MarketCap: 679.661 Millions | |
| Recent Price: 14.63 Smart Investing & Trading Score: 75 | |
| Day Percent Change: -0.34% Day Change: -0.05 | |
| Week Change: -0.14% Year-to-date Change: 29.2% | |
| DNOW Links: Profile News Message Board | |
| Charts:- Daily , Weekly | |
| Add DNOW to Watchlist: View: Get Complete DNOW Trend Analysis ➞ | |
 | HEAR Turtle Beach Corporation |
| Sector: Technology | |
| SubSector: Communication Equipment | |
| MarketCap: 73.0539 Millions | |
| Recent Price: 14.14 Smart Investing & Trading Score: 41 | |
| Day Percent Change: 0.60% Day Change: 0.08 | |
| Week Change: -2.11% Year-to-date Change: 29.1% | |
| HEAR Links: Profile News Message Board | |
| Charts:- Daily , Weekly | |
| Add HEAR to Watchlist: View: Get Complete HEAR Trend Analysis ➞ | |
 | SB Safe Bulkers, Inc. |
| Sector: Transports | |
| SubSector: Shipping | |
| MarketCap: 108.114 Millions | |
| Recent Price: 5.06 Smart Investing & Trading Score: 95 | |
| Day Percent Change: 0.40% Day Change: 0.02 | |
| Week Change: 5.2% Year-to-date Change: 28.8% | |
| SB Links: Profile News Message Board | |
| Charts:- Daily , Weekly | |
| Add SB to Watchlist: View: Get Complete SB Trend Analysis ➞ | |
 | SLVM Sylvamo Corporation |
| Sector: Materials | |
| SubSector: Paper & Paper Products | |
| MarketCap: 1710 Millions | |
| Recent Price: 63.06 Smart Investing & Trading Score: 100 | |
| Day Percent Change: 2.32% Day Change: 1.43 | |
| Week Change: 7.87% Year-to-date Change: 28.4% | |
| SLVM Links: Profile News Message Board | |
| Charts:- Daily , Weekly | |
| Add SLVM to Watchlist: View: Get Complete SLVM Trend Analysis ➞ | |
 | NSSC Napco Security Technologies, Inc. |
| Sector: Services & Goods | |
| SubSector: Security & Protection Services | |
| MarketCap: 339.103 Millions | |
| Recent Price: 43.81 Smart Investing & Trading Score: 100 | |
| Day Percent Change: 0.99% Day Change: 0.43 | |
| Week Change: 9.47% Year-to-date Change: 27.9% | |
| NSSC Links: Profile News Message Board | |
| Charts:- Daily , Weekly | |
| Add NSSC to Watchlist: View: Get Complete NSSC Trend Analysis ➞ | |
 | JYNT The Joint Corp. |
| Sector: Health Care | |
| SubSector: Hospitals | |
| MarketCap: 125.146 Millions | |
| Recent Price: 12.28 Smart Investing & Trading Score: 75 | |
| Day Percent Change: 1.66% Day Change: 0.20 | |
| Week Change: 0.82% Year-to-date Change: 27.8% | |
| JYNT Links: Profile News Message Board | |
| Charts:- Daily , Weekly | |
| Add JYNT to Watchlist: View: Get Complete JYNT Trend Analysis ➞ | |
 | PACK Ranpak Holdings Corp. |
| Sector: Industrials | |
| SubSector: Conglomerates | |
| MarketCap: 492.648 Millions | |
| Recent Price: 7.43 Smart Investing & Trading Score: 75 | |
| Day Percent Change: 1.64% Day Change: 0.12 | |
| Week Change: 3.34% Year-to-date Change: 27.7% | |
| PACK Links: Profile News Message Board | |
| Charts:- Daily , Weekly | |
| Add PACK to Watchlist: View: Get Complete PACK Trend Analysis ➞ | |
 | AGTI Agiliti, Inc. |
| Sector: Health Care | |
| SubSector: Health Information Services | |
| MarketCap: 2270 Millions | |
| Recent Price: 10.05 Smart Investing & Trading Score: 54 | |
| Day Percent Change: 0.10% Day Change: 0.01 | |
| Week Change: 0.1% Year-to-date Change: 27.5% | |
| AGTI Links: Profile News Message Board | |
| Charts:- Daily , Weekly | |
| Add AGTI to Watchlist: View: Get Complete AGTI Trend Analysis ➞ | |
 | RSVR Reservoir Media, Inc. |
| Sector: Services & Goods | |
| SubSector: Entertainment | |
| MarketCap: 389 Millions | |
| Recent Price: 9.08 Smart Investing & Trading Score: 100 | |
| Day Percent Change: 6.32% Day Change: 0.54 | |
| Week Change: 13.5% Year-to-date Change: 27.5% | |
| RSVR Links: Profile News Message Board | |
| Charts:- Daily , Weekly | |
| Add RSVR to Watchlist: View: Get Complete RSVR Trend Analysis ➞ | |
 | CMPO CompoSecure, Inc. |
| Sector: Industrials | |
| SubSector: Metal Fabrication | |
| MarketCap: 535 Millions | |
| Recent Price: 6.97 Smart Investing & Trading Score: 68 | |
| Day Percent Change: 4.19% Day Change: 0.28 | |
| Week Change: 6.74% Year-to-date Change: 27.4% | |
| CMPO Links: Profile News Message Board | |
| Charts:- Daily , Weekly | |
| Add CMPO to Watchlist: View: Get Complete CMPO Trend Analysis ➞ | |
 | PSN Parsons Corporation |
| Sector: Industrials | |
| SubSector: Diversified Machinery | |
| MarketCap: 3021.16 Millions | |
| Recent Price: 79.73 Smart Investing & Trading Score: 48 | |
| Day Percent Change: 0.57% Day Change: 0.45 | |
| Week Change: 2.89% Year-to-date Change: 27.1% | |
| PSN Links: Profile News Message Board | |
| Charts:- Daily , Weekly | |
| Add PSN to Watchlist: View: Get Complete PSN Trend Analysis ➞ | |
 | ITRI Itron, Inc. |
| Sector: Technology | |
| SubSector: Scientific & Technical Instruments | |
| MarketCap: 2222.23 Millions | |
| Recent Price: 95.80 Smart Investing & Trading Score: 95 | |
| Day Percent Change: 1.49% Day Change: 1.41 | |
| Week Change: 6.82% Year-to-date Change: 26.9% | |
| ITRI Links: Profile News Message Board | |
| Charts:- Daily , Weekly | |
| Add ITRI to Watchlist: View: Get Complete ITRI Trend Analysis ➞ | |
 | LBRT Liberty Oilfield Services Inc. |
| Sector: Energy | |
| SubSector: Oil & Gas Equipment & Services | |
| MarketCap: 308.261 Millions | |
| Recent Price: 23.01 Smart Investing & Trading Score: 61 | |
| Day Percent Change: 0.00% Day Change: 0.00 | |
| Week Change: 2.82% Year-to-date Change: 26.9% | |
| LBRT Links: Profile News Message Board | |
| Charts:- Daily , Weekly | |
| Add LBRT to Watchlist: View: Get Complete LBRT Trend Analysis ➞ | |
| Too many stocks? View smallcap stocks filtered by marketcap & sector |
| Marketcap: All SmallCap Stocks (default-no microcap), Large, Mid-Range, Small & MicroCap |
| Sector: Tech, Finance, Energy, Staples, Retail, Industrial, Materials, Utilities & Medical |
|
Best Stocks Today 12Stocks.com |
© 2024 12Stocks.com Terms & Conditions Privacy Contact Us
All Information Provided Only For Education And Not To Be Used For Investing or Trading. See Terms & Conditions


One More Thing ... Get Best Stocks Delivered Daily!
Never Ever Miss A Move With Our Top Ten Stocks Lists
Find Best Stocks In Any Market - Bull or Bear Market
Take A Peek At Our Top Ten Stocks Lists: Daily, Weekly, Year-to-Date & Top Trends
Find Best Stocks In Any Market - Bull or Bear Market
Take A Peek At Our Top Ten Stocks Lists: Daily, Weekly, Year-to-Date & Top Trends
Smallcap Stocks With Best Up Trends [0-bearish to 100-bullish]: Cullinan Oncology[100], NextNav [100], MBIA [100], Reservoir Media[100], Braemar Hotels[100], B. Riley[100], Pactiv Evergreen[100], Wolverine World[100], Haemonetics [100], Benchmark Electronics[100], Uniti Group[100]
Best Smallcap Stocks Year-to-Date:
CareMax [568.04%], Janux [341.65%], Viking [299.3%], Alpine Immune[239.21%], Longboard [222.09%], Super Micro[201.81%], Avidity Biosciences[166.81%], Arcutis Bio[161.92%], Vera [156.27%], Cullinan Oncology[147.08%], Hippo [141.6%] Best Smallcap Stocks This Week:
Matterport [170.98%], B. Riley[83.84%], Cullinan Oncology[60.86%], Seres [48.22%], Zura Bio[38.67%], Universal Logistics[36.27%], Tutor Perini[33.89%], IGM Biosciences[30.83%], Riot Blockchain[30.61%], Impinj [29.79%], Sonic Automotive[28.14%] Best Smallcap Stocks Daily:
Universal Logistics[38.80%], Zura Bio[31.90%], Cullinan Oncology[30.86%], Tutor Perini[28.01%], IGM Biosciences[23.62%], U.S. Silica[21.67%], Maxeon Solar[20.17%], Exponent [19.40%], TPI Composites[16.32%], OptimizeRx [14.84%], Solaris Oilfield[13.95%]