
 Login Sign Up


| |||||
 |  | ||||

| 12Stocks.com Market Intelligence |
Best SmallCap Stocks
|
| In a hurry? Small Cap Stock Lists: Performance Trends Table, Stock Charts
Sort Small Cap stocks: Daily, Weekly, Year-to-Date, Market Cap & Trends. Filter Small Cap stocks list by sector: Show all, Tech, Finance, Energy, Staples, Retail, Industrial, Materials, Utilities and HealthCare Filter Small Cap stocks list by size: All Large Medium Small and MicroCap |
| 12Stocks.com Small Cap Stocks Performances & Trends Daily | |||||||||
|
|  The overall Smart Investing & Trading Score is 58 (0-bearish to 100-bullish) which puts Small Cap index in short term neutral trend. The Smart Investing & Trading Score from previous trading session is 63 and hence a deterioration of trend.
| ||||||||
Here are the Smart Investing & Trading Scores of the most requested small cap stocks at 12Stocks.com (click stock name for detailed review):
|


| 12Stocks.com: Investing in Smallcap Index with Stocks | |
|
The following table helps investors and traders sort through current performance and trends (as measured by Smart Investing & Trading Score) of various
stocks in the Smallcap Index. Quick View: Move mouse or cursor over stock symbol (ticker) to view short-term technical chart and over stock name to view long term chart. Click on  to add stock symbol to your watchlist and to add stock symbol to your watchlist and  to view watchlist. Click on any ticker or stock name for detailed market intelligence report for that stock. to view watchlist. Click on any ticker or stock name for detailed market intelligence report for that stock. |
12Stocks.com Performance of Stocks in Smallcap Index
| Ticker | Stock Name | Watchlist | Category | Recent Price | Smart Investing & Trading Score | Change % | YTD Change% |
| CSTM | Constellium SE |   | Materials | 19.99 | 26 | -6.28% | 0.15% |
| AVA | Avista | | Utilities | 35.79 | 100 | 0.59% | 0.14% |
| DGICA | Donegal Group | | Financials | 14.00 | 32 | 1.45% | 0.07% |
| FORM | FormFactor | | Technology | 41.72 | 58 | 0.75% | 0.02% |
| BPMC | Blueprint Medicines | | Health Care | 92.26 | 95 | -0.03% | 0.02% |
| GOLF | Acushnet | | Services & Goods | 63.16 | 83 | -2.58% | -0.02% |
| HLNE | Hamilton Lane | | Financials | 113.34 | 25 | -0.13% | -0.09% |
| PHAT | Phathom | | Health Care | 9.12 | 41 | 0.66% | -0.11% |
| ASB | Associated Banc-Corp | | Financials | 21.34 | 80 | 0.33% | -0.23% |
| ANDE | Andersons | | Consumer Staples | 57.38 | 76 | -5.02% | -0.28% |
| MLAB | Mesa | | Technology | 104.47 | 90 | -2.02% | -0.29% |
| SP | SP Plus | | Services & Goods | 51.10 | 25 | 0.63% | -0.29% |
| MCRI | Monarch Casino | | Services & Goods | 68.92 | 68 | -0.76% | -0.33% |
| AMRX | Amneal | | Health Care | 6.05 | 37 | 12.04% | -0.33% |
| RGCO | RGC Resources | | Utilities | 20.26 | 75 | 4.43% | -0.39% |
| JELD | JELD-WEN Holding | | Industrials | 18.80 | 41 | -0.79% | -0.42% |
| AGM | Federal Agricultural | | Financials | 190.33 | 88 | -0.31% | -0.47% |
| SR | Spire | | Utilities | 62.05 | 93 | 1.44% | -0.47% |
| NWE | NorthWestern | | Utilities | 50.61 | 86 | 0.32% | -0.55% |
| LGND | Ligand | | Health Care | 71.00 | 20 | 1.59% | -0.59% |
| MD | MEDNAX | | Health Care | 9.24 | 49 | -1.70% | -0.65% |
| ABM | ABM Industries | | Services & Goods | 44.53 | 88 | -0.27% | -0.67% |
| AMWD | American Woodmark | | Consumer Staples | 92.17 | 45 | -0.80% | -0.73% |
| CADE | Cadence Ban | | Financials | 29.37 | 75 | 1.66% | -0.74% |
| ACET | Aceto | | Materials | 1.88 | 50 | -10.71% | -0.79% |


| Too many stocks? View smallcap stocks filtered by marketcap & sector |
| Marketcap: All SmallCap Stocks (default-no microcap), Large, Mid-Range, Small |
| Smallcap Sector: Tech, Finance, Energy, Staples, Retail, Industrial, Materials, & Medical |
|
Get the most comprehensive stock market coverage daily at 12Stocks.com ➞ Best Stocks Today ➞ Best Stocks Weekly ➞ Best Stocks Year-to-Date ➞ Best Stocks Trends ➞  Best Stocks Today 12Stocks.com Best Nasdaq Stocks ➞ Best S&P 500 Stocks ➞ Best Tech Stocks ➞ Best Biotech Stocks ➞ |
| Detailed Overview of SmallCap Stocks |
| SmallCap Technical Overview, Leaders & Laggards, Top SmallCap ETF Funds & Detailed SmallCap Stocks List, Charts, Trends & More |
| Smallcap: Technical Analysis, Trends & YTD Performance | |
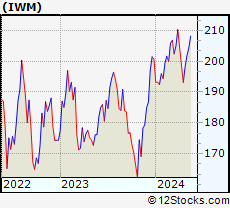
| SmallCap segment as represented by
IWM, an exchange-traded fund [ETF], holds basket of thousands of smallcap stocks from across all major sectors of the US stock market. The smallcap index (contains stocks like Riverbed & Sotheby's) is down by -1.51% and is currently underperforming the overall market by -7.17% year-to-date. Below is a quick view of technical charts and trends: | |
 IWM Weekly Chart |
|
| Long Term Trend: Good | |
| Medium Term Trend: Not Good | |
 IWM Daily Chart |
|
| Short Term Trend: Very Good | |
| Overall Trend Score: 58 | |
| YTD Performance: -1.51% | |
| **Trend Scores & Views Are Only For Educational Purposes And Not For Investing | |
| 12Stocks.com: Top Performing Small Cap Index Stocks | ||||||||||||||||||||||||||||||||||||||||||||||||
 The top performing Small Cap Index stocks year to date are
Now, more recently, over last week, the top performing Small Cap Index stocks on the move are


|
||||||||||||||||||||||||||||||||||||||||||||||||
| 12Stocks.com: Investing in Smallcap Index using Exchange Traded Funds | |
|
The following table shows list of key exchange traded funds (ETF) that
help investors track Smallcap index. The following list also includes leveraged ETF funds that track twice or thrice the daily returns of Smallcap indices. Short or inverse ETF funds move in the opposite direction to the index they track and are useful during market pullbacks or during bear markets. Quick View: Move mouse or cursor over ETF symbol (ticker) to view short-term technical chart and over ETF name to view long term chart. Click on ticker or stock name for detailed view. Click on to add stock symbol to your watchlist and to view watchlist. |
12Stocks.com List of ETFs that track Smallcap Index
| Ticker | ETF Name | Watchlist | Recent Price | Smart Investing & Trading Score | Change % | Week % | Year-to-date % |
| IWM | iShares Russell 2000 | | 197.68 | 58 | -0.45 | 2.35 | -1.51% |
| IJR | iShares Core S&P Small-Cap | | 105.71 | 85 | -0.24 | 2.41 | -2.35% |
| VTWO | Vanguard Russell 2000 ETF | | 79.93 | 48 | -0.45 | 2.37 | -1.44% |
| IWN | iShares Russell 2000 Value | | 151.28 | 75 | -0.30 | 2.37 | -2.61% |
| IWO | iShares Russell 2000 Growth | | 251.27 | 58 | -0.44 | 2.44 | -0.38% |
| IJS | iShares S&P Small-Cap 600 Value | | 97.71 | 45 | -0.43 | 2.2 | -5.2% |
| IJT | iShares S&P Small-Cap 600 Growth | | 125.37 | 48 | -0.28 | 2.59 | 0.18% |
| XSLV | PowerShares S&P SmallCap Low Volatil ETF | | 42.94 | 48 | -0.26 | 1.8 | -2.74% |
| SBB | ProShares Short SmallCap600 | | 16.37 | 33 | -0.02 | -2.79 | 2.76% |
| SMLV | SPDR SSGA US Small Cap Low Volatil ETF | | 108.43 | 73 | -0.31 | 2.21 | -3.63% |
| SAA | ProShares Ultra SmallCap600 | | 23.01 | 58 | -0.60 | 5.55 | -7.78% |
| SDD | ProShares UltraShort SmallCap600 | | 19.49 | 42 | 1.35 | -4.18 | 5.77% |
| 12Stocks.com: Charts, Trends, Fundamental Data and Performances of SmallCap Stocks | |
|
We now take in-depth look at all SmallCap stocks including charts, multi-period performances and overall trends (as measured by Smart Investing & Trading Score). One can sort SmallCap stocks (click link to choose) by Daily, Weekly and by Year-to-Date performances. Also, one can sort by size of the company or by market capitalization. |
| Select Your Default Chart Type: | |||||
| |||||
| Click on stock symbol or name for detailed view. Click on to add stock symbol to your watchlist and to view watchlist. Quick View: Move mouse or cursor over "Daily" to quickly view daily technical stock chart and over "Weekly" to view weekly technical stock chart. | |||||

 | CSTM Constellium SE |
| Sector: Materials | |
| SubSector: Aluminum | |
| MarketCap: 646.608 Millions | |
| Recent Price: 19.99 Smart Investing & Trading Score: 26 | |
| Day Percent Change: -6.28% Day Change: -1.34 | |
| Week Change: -3.52% Year-to-date Change: 0.2% | |
| CSTM Links: Profile News Message Board | |
| Charts:- Daily , Weekly | |
| Add CSTM to Watchlist: View: Get Complete CSTM Trend Analysis ➞ | |
 | AVA Avista Corporation |
| Sector: Utilities | |
| SubSector: Diversified Utilities | |
| MarketCap: 2755.7 Millions | |
| Recent Price: 35.79 Smart Investing & Trading Score: 100 | |
| Day Percent Change: 0.59% Day Change: 0.21 | |
| Week Change: 2.02% Year-to-date Change: 0.1% | |
| AVA Links: Profile News Message Board | |
| Charts:- Daily , Weekly | |
| Add AVA to Watchlist: View: Get Complete AVA Trend Analysis ➞ | |
 | DGICA Donegal Group Inc. |
| Sector: Financials | |
| SubSector: Property & Casualty Insurance | |
| MarketCap: 350.512 Millions | |
| Recent Price: 14.00 Smart Investing & Trading Score: 32 | |
| Day Percent Change: 1.45% Day Change: 0.20 | |
| Week Change: -0.14% Year-to-date Change: 0.1% | |
| DGICA Links: Profile News Message Board | |
| Charts:- Daily , Weekly | |
| Add DGICA to Watchlist: View: Get Complete DGICA Trend Analysis ➞ | |
 | FORM FormFactor, Inc. |
| Sector: Technology | |
| SubSector: Semiconductor - Broad Line | |
| MarketCap: 1426.42 Millions | |
| Recent Price: 41.72 Smart Investing & Trading Score: 58 | |
| Day Percent Change: 0.75% Day Change: 0.31 | |
| Week Change: 2.36% Year-to-date Change: 0.0% | |
| FORM Links: Profile News Message Board | |
| Charts:- Daily , Weekly | |
| Add FORM to Watchlist: View: Get Complete FORM Trend Analysis ➞ | |
 | BPMC Blueprint Medicines Corporation |
| Sector: Health Care | |
| SubSector: Biotechnology | |
| MarketCap: 3113.55 Millions | |
| Recent Price: 92.26 Smart Investing & Trading Score: 95 | |
| Day Percent Change: -0.03% Day Change: -0.03 | |
| Week Change: 6.23% Year-to-date Change: 0.0% | |
| BPMC Links: Profile News Message Board | |
| Charts:- Daily , Weekly | |
| Add BPMC to Watchlist: View: Get Complete BPMC Trend Analysis ➞ | |
 | GOLF Acushnet Holdings Corp. |
| Sector: Services & Goods | |
| SubSector: Sporting Goods Stores | |
| MarketCap: 1717.74 Millions | |
| Recent Price: 63.16 Smart Investing & Trading Score: 83 | |
| Day Percent Change: -2.58% Day Change: -1.67 | |
| Week Change: 1.67% Year-to-date Change: 0.0% | |
| GOLF Links: Profile News Message Board | |
| Charts:- Daily , Weekly | |
| Add GOLF to Watchlist: View: Get Complete GOLF Trend Analysis ➞ | |
 | HLNE Hamilton Lane Incorporated |
| Sector: Financials | |
| SubSector: Asset Management | |
| MarketCap: 2484.13 Millions | |
| Recent Price: 113.34 Smart Investing & Trading Score: 25 | |
| Day Percent Change: -0.13% Day Change: -0.15 | |
| Week Change: 3.06% Year-to-date Change: -0.1% | |
| HLNE Links: Profile News Message Board | |
| Charts:- Daily , Weekly | |
| Add HLNE to Watchlist: View: Get Complete HLNE Trend Analysis ➞ | |
 | PHAT Phathom Pharmaceuticals, Inc. |
| Sector: Health Care | |
| SubSector: Biotechnology | |
| MarketCap: 728.785 Millions | |
| Recent Price: 9.12 Smart Investing & Trading Score: 41 | |
| Day Percent Change: 0.66% Day Change: 0.06 | |
| Week Change: 1.56% Year-to-date Change: -0.1% | |
| PHAT Links: Profile News Message Board | |
| Charts:- Daily , Weekly | |
| Add PHAT to Watchlist: View: Get Complete PHAT Trend Analysis ➞ | |
 | ASB Associated Banc-Corp |
| Sector: Financials | |
| SubSector: Regional - Midwest Banks | |
| MarketCap: 1904.8 Millions | |
| Recent Price: 21.34 Smart Investing & Trading Score: 80 | |
| Day Percent Change: 0.33% Day Change: 0.07 | |
| Week Change: 3.84% Year-to-date Change: -0.2% | |
| ASB Links: Profile News Message Board | |
| Charts:- Daily , Weekly | |
| Add ASB to Watchlist: View: Get Complete ASB Trend Analysis ➞ | |
 | ANDE The Andersons, Inc. |
| Sector: Consumer Staples | |
| SubSector: Farm Products | |
| MarketCap: 630.887 Millions | |
| Recent Price: 57.38 Smart Investing & Trading Score: 76 | |
| Day Percent Change: -5.02% Day Change: -3.03 | |
| Week Change: -1.46% Year-to-date Change: -0.3% | |
| ANDE Links: Profile News Message Board | |
| Charts:- Daily , Weekly | |
| Add ANDE to Watchlist: View: Get Complete ANDE Trend Analysis ➞ | |
 | MLAB Mesa Laboratories, Inc. |
| Sector: Technology | |
| SubSector: Scientific & Technical Instruments | |
| MarketCap: 935.453 Millions | |
| Recent Price: 104.47 Smart Investing & Trading Score: 90 | |
| Day Percent Change: -2.02% Day Change: -2.15 | |
| Week Change: 3.7% Year-to-date Change: -0.3% | |
| MLAB Links: Profile News Message Board | |
| Charts:- Daily , Weekly | |
| Add MLAB to Watchlist: View: Get Complete MLAB Trend Analysis ➞ | |
 | SP SP Plus Corporation |
| Sector: Services & Goods | |
| SubSector: Management Services | |
| MarketCap: 494.545 Millions | |
| Recent Price: 51.10 Smart Investing & Trading Score: 25 | |
| Day Percent Change: 0.63% Day Change: 0.32 | |
| Week Change: 0.83% Year-to-date Change: -0.3% | |
| SP Links: Profile News Message Board | |
| Charts:- Daily , Weekly | |
| Add SP to Watchlist: View: Get Complete SP Trend Analysis ➞ | |
 | MCRI Monarch Casino & Resort, Inc. |
| Sector: Services & Goods | |
| SubSector: Resorts & Casinos | |
| MarketCap: 352.894 Millions | |
| Recent Price: 68.92 Smart Investing & Trading Score: 68 | |
| Day Percent Change: -0.76% Day Change: -0.53 | |
| Week Change: 2.35% Year-to-date Change: -0.3% | |
| MCRI Links: Profile News Message Board | |
| Charts:- Daily , Weekly | |
| Add MCRI to Watchlist: View: Get Complete MCRI Trend Analysis ➞ | |
 | AMRX Amneal Pharmaceuticals, Inc. |
| Sector: Health Care | |
| SubSector: Drug Related Products | |
| MarketCap: 1218.13 Millions | |
| Recent Price: 6.05 Smart Investing & Trading Score: 37 | |
| Day Percent Change: 12.04% Day Change: 0.65 | |
| Week Change: 11.62% Year-to-date Change: -0.3% | |
| AMRX Links: Profile News Message Board | |
| Charts:- Daily , Weekly | |
| Add AMRX to Watchlist: View: Get Complete AMRX Trend Analysis ➞ | |
 | RGCO RGC Resources, Inc. |
| Sector: Utilities | |
| SubSector: Gas Utilities | |
| MarketCap: 215.277 Millions | |
| Recent Price: 20.26 Smart Investing & Trading Score: 75 | |
| Day Percent Change: 4.43% Day Change: 0.86 | |
| Week Change: 5.36% Year-to-date Change: -0.4% | |
| RGCO Links: Profile News Message Board | |
| Charts:- Daily , Weekly | |
| Add RGCO to Watchlist: View: Get Complete RGCO Trend Analysis ➞ | |
 | JELD JELD-WEN Holding, Inc. |
| Sector: Industrials | |
| SubSector: General Building Materials | |
| MarketCap: 1022.53 Millions | |
| Recent Price: 18.80 Smart Investing & Trading Score: 41 | |
| Day Percent Change: -0.79% Day Change: -0.15 | |
| Week Change: 2.79% Year-to-date Change: -0.4% | |
| JELD Links: Profile News Message Board | |
| Charts:- Daily , Weekly | |
| Add JELD to Watchlist: View: Get Complete JELD Trend Analysis ➞ | |
 | AGM Federal Agricultural Mortgage Corporation |
| Sector: Financials | |
| SubSector: Credit Services | |
| MarketCap: 542.008 Millions | |
| Recent Price: 190.33 Smart Investing & Trading Score: 88 | |
| Day Percent Change: -0.31% Day Change: -0.59 | |
| Week Change: 3.86% Year-to-date Change: -0.5% | |
| AGM Links: Profile News Message Board | |
| Charts:- Daily , Weekly | |
| Add AGM to Watchlist: View: Get Complete AGM Trend Analysis ➞ | |
 | SR Spire Inc. |
| Sector: Utilities | |
| SubSector: Gas Utilities | |
| MarketCap: 3745.87 Millions | |
| Recent Price: 62.05 Smart Investing & Trading Score: 93 | |
| Day Percent Change: 1.44% Day Change: 0.88 | |
| Week Change: 1.87% Year-to-date Change: -0.5% | |
| SR Links: Profile News Message Board | |
| Charts:- Daily , Weekly | |
| Add SR to Watchlist: View: Get Complete SR Trend Analysis ➞ | |
 | NWE NorthWestern Corporation |
| Sector: Utilities | |
| SubSector: Diversified Utilities | |
| MarketCap: 2801.8 Millions | |
| Recent Price: 50.61 Smart Investing & Trading Score: 86 | |
| Day Percent Change: 0.32% Day Change: 0.16 | |
| Week Change: 0.96% Year-to-date Change: -0.6% | |
| NWE Links: Profile News Message Board | |
| Charts:- Daily , Weekly | |
| Add NWE to Watchlist: View: Get Complete NWE Trend Analysis ➞ | |
 | LGND Ligand Pharmaceuticals Incorporated |
| Sector: Health Care | |
| SubSector: Biotechnology | |
| MarketCap: 1344.45 Millions | |
| Recent Price: 71.00 Smart Investing & Trading Score: 20 | |
| Day Percent Change: 1.59% Day Change: 1.11 | |
| Week Change: -2.03% Year-to-date Change: -0.6% | |
| LGND Links: Profile News Message Board | |
| Charts:- Daily , Weekly | |
| Add LGND to Watchlist: View: Get Complete LGND Trend Analysis ➞ | |
 | MD MEDNAX, Inc. |
| Sector: Health Care | |
| SubSector: Specialized Health Services | |
| MarketCap: 913.656 Millions | |
| Recent Price: 9.24 Smart Investing & Trading Score: 49 | |
| Day Percent Change: -1.70% Day Change: -0.16 | |
| Week Change: 2.33% Year-to-date Change: -0.7% | |
| MD Links: Profile News Message Board | |
| Charts:- Daily , Weekly | |
| Add MD to Watchlist: View: Get Complete MD Trend Analysis ➞ | |
 | ABM ABM Industries Incorporated |
| Sector: Services & Goods | |
| SubSector: Business Services | |
| MarketCap: 1706.72 Millions | |
| Recent Price: 44.53 Smart Investing & Trading Score: 88 | |
| Day Percent Change: -0.27% Day Change: -0.12 | |
| Week Change: 0.47% Year-to-date Change: -0.7% | |
| ABM Links: Profile News Message Board | |
| Charts:- Daily , Weekly | |
| Add ABM to Watchlist: View: Get Complete ABM Trend Analysis ➞ | |
 | AMWD American Woodmark Corporation |
| Sector: Consumer Staples | |
| SubSector: Home Furnishings & Fixtures | |
| MarketCap: 958.435 Millions | |
| Recent Price: 92.17 Smart Investing & Trading Score: 45 | |
| Day Percent Change: -0.80% Day Change: -0.74 | |
| Week Change: 2.18% Year-to-date Change: -0.7% | |
| AMWD Links: Profile News Message Board | |
| Charts:- Daily , Weekly | |
| Add AMWD to Watchlist: View: Get Complete AMWD Trend Analysis ➞ | |
 | CADE Cadence Bancorporation |
| Sector: Financials | |
| SubSector: Regional - Southeast Banks | |
| MarketCap: 756.335 Millions | |
| Recent Price: 29.37 Smart Investing & Trading Score: 75 | |
| Day Percent Change: 1.66% Day Change: 0.48 | |
| Week Change: 8.1% Year-to-date Change: -0.7% | |
| CADE Links: Profile News Message Board | |
| Charts:- Daily , Weekly | |
| Add CADE to Watchlist: View: Get Complete CADE Trend Analysis ➞ | |
 | ACET Aceto Corporation |
| Sector: Materials | |
| SubSector: Chemicals - Major Diversified | |
| MarketCap: 453.16 Millions | |
| Recent Price: 1.88 Smart Investing & Trading Score: 50 | |
| Day Percent Change: -10.71% Day Change: -0.23 | |
| Week Change: -3.85% Year-to-date Change: -0.8% | |
| ACET Links: Profile News Message Board | |
| Charts:- Daily , Weekly | |
| Add ACET to Watchlist: View: Get Complete ACET Trend Analysis ➞ | |
| Too many stocks? View smallcap stocks filtered by marketcap & sector |
| Marketcap: All SmallCap Stocks (default-no microcap), Large, Mid-Range, Small & MicroCap |
| Sector: Tech, Finance, Energy, Staples, Retail, Industrial, Materials, Utilities & Medical |
|
Best Stocks Today 12Stocks.com |
© 2024 12Stocks.com Terms & Conditions Privacy Contact Us
All Information Provided Only For Education And Not To Be Used For Investing or Trading. See Terms & Conditions


One More Thing ... Get Best Stocks Delivered Daily!
Never Ever Miss A Move With Our Top Ten Stocks Lists
Find Best Stocks In Any Market - Bull or Bear Market
Take A Peek At Our Top Ten Stocks Lists: Daily, Weekly, Year-to-Date & Top Trends
Find Best Stocks In Any Market - Bull or Bear Market
Take A Peek At Our Top Ten Stocks Lists: Daily, Weekly, Year-to-Date & Top Trends
Smallcap Stocks With Best Up Trends [0-bearish to 100-bullish]: B. Riley[100], Ribbon [100], Group 1[100], Trustmark [100], MBIA [100], Integer [100], EchoStar [100], Comstock Resources[100], Vishay Inter[100], Jamf Holding[100], SunOpta [100]
Best Smallcap Stocks Year-to-Date:
CareMax [574.23%], Janux [352.07%], Viking [249.65%], Alpine Immune[239.13%], Longboard [223.4%], Avidity Biosciences[177.71%], Arcutis Bio[170.9%], Super Micro[165.5%], Vera [149.61%], Hippo [130.79%], Y-mAbs [124.19%] Best Smallcap Stocks This Week:
Matterport [166.09%], B. Riley[48.82%], Seres [30.29%], Riot Blockchain[30.12%], CareMax [27.24%], Ribbon [25.97%], ProKidney [23.28%], SoundHound AI[22.54%], Cipher Mining[22.14%], Hibbett Sports[21.61%], Cullinan Oncology[20.69%] Best Smallcap Stocks Daily:
B. Riley[36.97%], Ribbon [26.46%], Babcock & Wilcox Enterprises[15.57%], Cullinan Oncology[13.55%], Amneal [12.04%], Comtech Tele[10.76%], Innodata [10.28%], Gritstone Oncology[10.06%], Navitas Semiconductor[8.83%], Eyenovia [8.68%], K12 [8.64%]