
 Login Sign Up


| |||||
 |  | ||||

| 12Stocks.com Market Intelligence |
Best SmallCap Stocks
|
| In a hurry? Small Cap Stock Lists: Performance Trends Table, Stock Charts
Sort Small Cap stocks: Daily, Weekly, Year-to-Date, Market Cap & Trends. Filter Small Cap stocks list by sector: Show all, Tech, Finance, Energy, Staples, Retail, Industrial, Materials, Utilities and HealthCare Filter Small Cap stocks list by size: All Large Medium Small and MicroCap |
| 12Stocks.com Small Cap Stocks Performances & Trends Daily | |||||||||
|
|  The overall Smart Investing & Trading Score is 58 (0-bearish to 100-bullish) which puts Small Cap index in short term neutral trend. The Smart Investing & Trading Score from previous trading session is 63 and hence a deterioration of trend.
| ||||||||
Here are the Smart Investing & Trading Scores of the most requested small cap stocks at 12Stocks.com (click stock name for detailed review):
|


| 12Stocks.com: Investing in Smallcap Index with Stocks | |
|
The following table helps investors and traders sort through current performance and trends (as measured by Smart Investing & Trading Score) of various
stocks in the Smallcap Index. Quick View: Move mouse or cursor over stock symbol (ticker) to view short-term technical chart and over stock name to view long term chart. Click on  to add stock symbol to your watchlist and to add stock symbol to your watchlist and  to view watchlist. Click on any ticker or stock name for detailed market intelligence report for that stock. to view watchlist. Click on any ticker or stock name for detailed market intelligence report for that stock. |
12Stocks.com Performance of Stocks in Smallcap Index
| Ticker | Stock Name | Watchlist | Category | Recent Price | Smart Investing & Trading Score | Change % | YTD Change% |
| ECPG | Encore Capital |   | Financials | 43.05 | 27 | 1.34% | -15.17% |
| IMKTA | Ingles Markets | | Services & Goods | 73.22 | 27 | 0.16% | -15.23% |
| EYE | National Vision | | Services & Goods | 17.73 | 20 | -5.89% | -15.29% |
| WD | Walker & Dunlop | | Financials | 94.04 | 59 | 0.10% | -15.29% |
| CVBF | CVB Financial | | Financials | 17.09 | 100 | -0.06% | -15.35% |
| KZR | Kezar Life | | Health Care | 0.80 | 50 | -2.98% | -15.41% |
| ZUMZ | Zumiez | | Services & Goods | 17.20 | 74 | 1.78% | -15.44% |
| PZZA | Papa John | | Services & Goods | 64.41 | 64 | 0.23% | -15.51% |
| KALV | KalVista | | Health Care | 10.35 | 15 | -7.67% | -15.51% |
| SPTN | SpartanNash | | Consumer Staples | 19.38 | 47 | -0.72% | -15.56% |
| SJW | SJW Group | | Utilities | 55.13 | 67 | 0.09% | -15.64% |
| PCH | PotlatchDeltic | | Industrials | 41.41 | 18 | -0.10% | -15.66% |
| ATEC | Alphatec | | Health Care | 12.74 | 42 | -1.47% | -15.68% |
| HTBK | Heritage Commerce | | Financials | 8.36 | 74 | 0.72% | -15.73% |
| ESSA | ESSA Bancorp | | Financials | 16.85 | 27 | 2.74% | -15.83% |
| ARTNA | Artesian Resources | | Utilities | 34.89 | 45 | -0.20% | -15.83% |
| ALEX | Alexander & Baldwin | | Financials | 16.00 | 42 | -1.84% | -15.88% |
| CNDT | Conduent | | Technology | 3.07 | 20 | 1.32% | -15.89% |
| TRUE | TrueCar | | Technology | 2.91 | 17 | -3.00% | -15.90% |
| MPB | Mid Penn | | Financials | 20.42 | 67 | -1.26% | -15.90% |
| SBCF | Seacoast Banking | | Financials | 23.92 | 59 | -0.37% | -15.95% |
| TMCI | Treace Medical | | Health Care | 10.69 | 10 | -1.38% | -16.09% |
| HONE | HarborOne Bancorp | | Financials | 10.05 | 67 | 0.00% | -16.11% |
| BNL | Broadstone Net | | Financials | 14.44 | 30 | -0.76% | -16.14% |
| FSBC | Five Star | | Financials | 21.95 | 50 | -0.09% | -16.16% |


| Too many stocks? View smallcap stocks filtered by marketcap & sector |
| Marketcap: All SmallCap Stocks (default-no microcap), Large, Mid-Range, Small |
| Smallcap Sector: Tech, Finance, Energy, Staples, Retail, Industrial, Materials, & Medical |
|
Get the most comprehensive stock market coverage daily at 12Stocks.com ➞ Best Stocks Today ➞ Best Stocks Weekly ➞ Best Stocks Year-to-Date ➞ Best Stocks Trends ➞  Best Stocks Today 12Stocks.com Best Nasdaq Stocks ➞ Best S&P 500 Stocks ➞ Best Tech Stocks ➞ Best Biotech Stocks ➞ |
| Detailed Overview of SmallCap Stocks |
| SmallCap Technical Overview, Leaders & Laggards, Top SmallCap ETF Funds & Detailed SmallCap Stocks List, Charts, Trends & More |
| Smallcap: Technical Analysis, Trends & YTD Performance | |
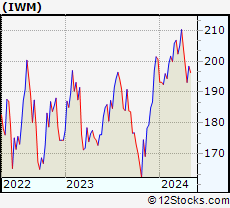
| SmallCap segment as represented by
IWM, an exchange-traded fund [ETF], holds basket of thousands of smallcap stocks from across all major sectors of the US stock market. The smallcap index (contains stocks like Riverbed & Sotheby's) is down by -1.51% and is currently underperforming the overall market by -7.17% year-to-date. Below is a quick view of technical charts and trends: | |
 IWM Weekly Chart |
|
| Long Term Trend: Good | |
| Medium Term Trend: Not Good | |
 IWM Daily Chart |
|
| Short Term Trend: Very Good | |
| Overall Trend Score: 58 | |
| YTD Performance: -1.51% | |
| **Trend Scores & Views Are Only For Educational Purposes And Not For Investing | |
| 12Stocks.com: Top Performing Small Cap Index Stocks | ||||||||||||||||||||||||||||||||||||||||||||||||
 The top performing Small Cap Index stocks year to date are
Now, more recently, over last week, the top performing Small Cap Index stocks on the move are


|
||||||||||||||||||||||||||||||||||||||||||||||||
| 12Stocks.com: Investing in Smallcap Index using Exchange Traded Funds | |
|
The following table shows list of key exchange traded funds (ETF) that
help investors track Smallcap index. The following list also includes leveraged ETF funds that track twice or thrice the daily returns of Smallcap indices. Short or inverse ETF funds move in the opposite direction to the index they track and are useful during market pullbacks or during bear markets. Quick View: Move mouse or cursor over ETF symbol (ticker) to view short-term technical chart and over ETF name to view long term chart. Click on ticker or stock name for detailed view. Click on to add stock symbol to your watchlist and to view watchlist. |
12Stocks.com List of ETFs that track Smallcap Index
| Ticker | ETF Name | Watchlist | Recent Price | Smart Investing & Trading Score | Change % | Week % | Year-to-date % |
| IWM | iShares Russell 2000 | | 197.68 | 58 | -0.45 | 2.35 | -1.51% |
| IJR | iShares Core S&P Small-Cap | | 105.71 | 85 | -0.24 | 2.41 | -2.35% |
| VTWO | Vanguard Russell 2000 ETF | | 79.93 | 63 | -0.45 | 2.37 | -1.44% |
| IWN | iShares Russell 2000 Value | | 151.28 | 75 | -0.30 | 2.37 | -2.61% |
| IWO | iShares Russell 2000 Growth | | 251.27 | 58 | -0.44 | 2.44 | -0.38% |
| IJS | iShares S&P Small-Cap 600 Value | | 97.71 | 60 | -0.43 | 2.2 | -5.2% |
| IJT | iShares S&P Small-Cap 600 Growth | | 125.37 | 70 | -0.28 | 2.59 | 0.18% |
| XSLV | PowerShares S&P SmallCap Low Volatil ETF | | 42.94 | 73 | -0.26 | 1.8 | -2.74% |
| SBB | ProShares Short SmallCap600 | | 16.37 | 33 | -0.02 | -2.79 | 2.76% |
| SMLV | SPDR SSGA US Small Cap Low Volatil ETF | | 108.43 | 73 | -0.31 | 2.21 | -3.63% |
| SAA | ProShares Ultra SmallCap600 | | 23.01 | 58 | -0.60 | 5.55 | -7.78% |
| SDD | ProShares UltraShort SmallCap600 | | 19.49 | 42 | 1.35 | -4.18 | 5.77% |
| 12Stocks.com: Charts, Trends, Fundamental Data and Performances of SmallCap Stocks | |
|
We now take in-depth look at all SmallCap stocks including charts, multi-period performances and overall trends (as measured by Smart Investing & Trading Score). One can sort SmallCap stocks (click link to choose) by Daily, Weekly and by Year-to-Date performances. Also, one can sort by size of the company or by market capitalization. |
| Select Your Default Chart Type: | |||||
| |||||
| Click on stock symbol or name for detailed view. Click on to add stock symbol to your watchlist and to view watchlist. Quick View: Move mouse or cursor over "Daily" to quickly view daily technical stock chart and over "Weekly" to view weekly technical stock chart. | |||||

 | ECPG Encore Capital Group, Inc. |
| Sector: Financials | |
| SubSector: Asset Management | |
| MarketCap: 661.503 Millions | |
| Recent Price: 43.05 Smart Investing & Trading Score: 27 | |
| Day Percent Change: 1.34% Day Change: 0.57 | |
| Week Change: 0.82% Year-to-date Change: -15.2% | |
| ECPG Links: Profile News Message Board | |
| Charts:- Daily , Weekly | |
| Add ECPG to Watchlist: View: Get Complete ECPG Trend Analysis ➞ | |
 | IMKTA Ingles Markets, Incorporated |
| Sector: Services & Goods | |
| SubSector: Grocery Stores | |
| MarketCap: 827.075 Millions | |
| Recent Price: 73.22 Smart Investing & Trading Score: 27 | |
| Day Percent Change: 0.16% Day Change: 0.12 | |
| Week Change: -2.81% Year-to-date Change: -15.2% | |
| IMKTA Links: Profile News Message Board | |
| Charts:- Daily , Weekly | |
| Add IMKTA to Watchlist: View: Get Complete IMKTA Trend Analysis ➞ | |
 | EYE National Vision Holdings, Inc. |
| Sector: Services & Goods | |
| SubSector: Specialty Retail, Other | |
| MarketCap: 1290.84 Millions | |
| Recent Price: 17.73 Smart Investing & Trading Score: 20 | |
| Day Percent Change: -5.89% Day Change: -1.11 | |
| Week Change: -5.69% Year-to-date Change: -15.3% | |
| EYE Links: Profile News Message Board | |
| Charts:- Daily , Weekly | |
| Add EYE to Watchlist: View: Get Complete EYE Trend Analysis ➞ | |
 | WD Walker & Dunlop, Inc. |
| Sector: Financials | |
| SubSector: Mortgage Investment | |
| MarketCap: 1312.99 Millions | |
| Recent Price: 94.04 Smart Investing & Trading Score: 59 | |
| Day Percent Change: 0.10% Day Change: 0.09 | |
| Week Change: 3.07% Year-to-date Change: -15.3% | |
| WD Links: Profile News Message Board | |
| Charts:- Daily , Weekly | |
| Add WD to Watchlist: View: Get Complete WD Trend Analysis ➞ | |
 | CVBF CVB Financial Corp. |
| Sector: Financials | |
| SubSector: Regional - Pacific Banks | |
| MarketCap: 2699.99 Millions | |
| Recent Price: 17.09 Smart Investing & Trading Score: 100 | |
| Day Percent Change: -0.06% Day Change: -0.01 | |
| Week Change: 2.77% Year-to-date Change: -15.4% | |
| CVBF Links: Profile News Message Board | |
| Charts:- Daily , Weekly | |
| Add CVBF to Watchlist: View: Get Complete CVBF Trend Analysis ➞ | |
 | KZR Kezar Life Sciences, Inc. |
| Sector: Health Care | |
| SubSector: Biotechnology | |
| MarketCap: 174.885 Millions | |
| Recent Price: 0.80 Smart Investing & Trading Score: 50 | |
| Day Percent Change: -2.98% Day Change: -0.02 | |
| Week Change: 1.77% Year-to-date Change: -15.4% | |
| KZR Links: Profile News Message Board | |
| Charts:- Daily , Weekly | |
| Add KZR to Watchlist: View: Get Complete KZR Trend Analysis ➞ | |
 | ZUMZ Zumiez Inc. |
| Sector: Services & Goods | |
| SubSector: Specialty Retail, Other | |
| MarketCap: 526.244 Millions | |
| Recent Price: 17.20 Smart Investing & Trading Score: 74 | |
| Day Percent Change: 1.78% Day Change: 0.30 | |
| Week Change: 13.38% Year-to-date Change: -15.4% | |
| ZUMZ Links: Profile News Message Board | |
| Charts:- Daily , Weekly | |
| Add ZUMZ to Watchlist: View: Get Complete ZUMZ Trend Analysis ➞ | |
 | PZZA Papa John s International, Inc. |
| Sector: Services & Goods | |
| SubSector: Specialty Eateries | |
| MarketCap: 1925.27 Millions | |
| Recent Price: 64.41 Smart Investing & Trading Score: 64 | |
| Day Percent Change: 0.23% Day Change: 0.15 | |
| Week Change: 3.06% Year-to-date Change: -15.5% | |
| PZZA Links: Profile News Message Board | |
| Charts:- Daily , Weekly | |
| Add PZZA to Watchlist: View: Get Complete PZZA Trend Analysis ➞ | |
 | KALV KalVista Pharmaceuticals, Inc. |
| Sector: Health Care | |
| SubSector: Biotechnology | |
| MarketCap: 138.385 Millions | |
| Recent Price: 10.35 Smart Investing & Trading Score: 15 | |
| Day Percent Change: -7.67% Day Change: -0.86 | |
| Week Change: -10.54% Year-to-date Change: -15.5% | |
| KALV Links: Profile News Message Board | |
| Charts:- Daily , Weekly | |
| Add KALV to Watchlist: View: Get Complete KALV Trend Analysis ➞ | |
 | SPTN SpartanNash Company |
| Sector: Consumer Staples | |
| SubSector: Food Wholesale | |
| MarketCap: 671.229 Millions | |
| Recent Price: 19.38 Smart Investing & Trading Score: 47 | |
| Day Percent Change: -0.72% Day Change: -0.14 | |
| Week Change: -1.47% Year-to-date Change: -15.6% | |
| SPTN Links: Profile News Message Board | |
| Charts:- Daily , Weekly | |
| Add SPTN to Watchlist: View: Get Complete SPTN Trend Analysis ➞ | |
 | SJW SJW Group |
| Sector: Utilities | |
| SubSector: Water Utilities | |
| MarketCap: 1571.62 Millions | |
| Recent Price: 55.13 Smart Investing & Trading Score: 67 | |
| Day Percent Change: 0.09% Day Change: 0.05 | |
| Week Change: 1.58% Year-to-date Change: -15.6% | |
| SJW Links: Profile News Message Board | |
| Charts:- Daily , Weekly | |
| Add SJW to Watchlist: View: Get Complete SJW Trend Analysis ➞ | |
 | PCH PotlatchDeltic Corporation |
| Sector: Industrials | |
| SubSector: Lumber, Wood Production | |
| MarketCap: 2314.68 Millions | |
| Recent Price: 41.41 Smart Investing & Trading Score: 18 | |
| Day Percent Change: -0.10% Day Change: -0.04 | |
| Week Change: 0.53% Year-to-date Change: -15.7% | |
| PCH Links: Profile News Message Board | |
| Charts:- Daily , Weekly | |
| Add PCH to Watchlist: View: Get Complete PCH Trend Analysis ➞ | |
 | ATEC Alphatec Holdings, Inc. |
| Sector: Health Care | |
| SubSector: Medical Instruments & Supplies | |
| MarketCap: 181.16 Millions | |
| Recent Price: 12.74 Smart Investing & Trading Score: 42 | |
| Day Percent Change: -1.47% Day Change: -0.19 | |
| Week Change: 1.59% Year-to-date Change: -15.7% | |
| ATEC Links: Profile News Message Board | |
| Charts:- Daily , Weekly | |
| Add ATEC to Watchlist: View: Get Complete ATEC Trend Analysis ➞ | |
 | HTBK Heritage Commerce Corp |
| Sector: Financials | |
| SubSector: Regional - Pacific Banks | |
| MarketCap: 416.129 Millions | |
| Recent Price: 8.36 Smart Investing & Trading Score: 74 | |
| Day Percent Change: 0.72% Day Change: 0.06 | |
| Week Change: 2.96% Year-to-date Change: -15.7% | |
| HTBK Links: Profile News Message Board | |
| Charts:- Daily , Weekly | |
| Add HTBK to Watchlist: View: Get Complete HTBK Trend Analysis ➞ | |
 | ESSA ESSA Bancorp, Inc. |
| Sector: Financials | |
| SubSector: Savings & Loans | |
| MarketCap: 171.33 Millions | |
| Recent Price: 16.85 Smart Investing & Trading Score: 27 | |
| Day Percent Change: 2.74% Day Change: 0.45 | |
| Week Change: -0.35% Year-to-date Change: -15.8% | |
| ESSA Links: Profile News Message Board | |
| Charts:- Daily , Weekly | |
| Add ESSA to Watchlist: View: Get Complete ESSA Trend Analysis ➞ | |
 | ARTNA Artesian Resources Corporation |
| Sector: Utilities | |
| SubSector: Water Utilities | |
| MarketCap: 299.402 Millions | |
| Recent Price: 34.89 Smart Investing & Trading Score: 45 | |
| Day Percent Change: -0.20% Day Change: -0.07 | |
| Week Change: 0.06% Year-to-date Change: -15.8% | |
| ARTNA Links: Profile News Message Board | |
| Charts:- Daily , Weekly | |
| Add ARTNA to Watchlist: View: Get Complete ARTNA Trend Analysis ➞ | |
 | ALEX Alexander & Baldwin, Inc. |
| Sector: Financials | |
| SubSector: Real Estate Development | |
| MarketCap: 751.419 Millions | |
| Recent Price: 16.00 Smart Investing & Trading Score: 42 | |
| Day Percent Change: -1.84% Day Change: -0.30 | |
| Week Change: -0.56% Year-to-date Change: -15.9% | |
| ALEX Links: Profile News Message Board | |
| Charts:- Daily , Weekly | |
| Add ALEX to Watchlist: View: Get Complete ALEX Trend Analysis ➞ | |
 | CNDT Conduent Incorporated |
| Sector: Technology | |
| SubSector: Information Technology Services | |
| MarketCap: 514.968 Millions | |
| Recent Price: 3.07 Smart Investing & Trading Score: 20 | |
| Day Percent Change: 1.32% Day Change: 0.04 | |
| Week Change: 0.33% Year-to-date Change: -15.9% | |
| CNDT Links: Profile News Message Board | |
| Charts:- Daily , Weekly | |
| Add CNDT to Watchlist: View: Get Complete CNDT Trend Analysis ➞ | |
 | TRUE TrueCar, Inc. |
| Sector: Technology | |
| SubSector: Internet Service Providers | |
| MarketCap: 244.18 Millions | |
| Recent Price: 2.91 Smart Investing & Trading Score: 17 | |
| Day Percent Change: -3.00% Day Change: -0.09 | |
| Week Change: 0% Year-to-date Change: -15.9% | |
| TRUE Links: Profile News Message Board | |
| Charts:- Daily , Weekly | |
| Add TRUE to Watchlist: View: Get Complete TRUE Trend Analysis ➞ | |
 | MPB Mid Penn Bancorp, Inc. |
| Sector: Financials | |
| SubSector: Regional - Northeast Banks | |
| MarketCap: 187.699 Millions | |
| Recent Price: 20.42 Smart Investing & Trading Score: 67 | |
| Day Percent Change: -1.26% Day Change: -0.26 | |
| Week Change: -0.39% Year-to-date Change: -15.9% | |
| MPB Links: Profile News Message Board | |
| Charts:- Daily , Weekly | |
| Add MPB to Watchlist: View: Get Complete MPB Trend Analysis ➞ | |
 | SBCF Seacoast Banking Corporation of Florida |
| Sector: Financials | |
| SubSector: Regional - Mid-Atlantic Banks | |
| MarketCap: 881.559 Millions | |
| Recent Price: 23.92 Smart Investing & Trading Score: 59 | |
| Day Percent Change: -0.37% Day Change: -0.09 | |
| Week Change: 4.96% Year-to-date Change: -16.0% | |
| SBCF Links: Profile News Message Board | |
| Charts:- Daily , Weekly | |
| Add SBCF to Watchlist: View: Get Complete SBCF Trend Analysis ➞ | |
 | TMCI Treace Medical Concepts, Inc. |
| Sector: Health Care | |
| SubSector: Medical Devices | |
| MarketCap: 1550 Millions | |
| Recent Price: 10.69 Smart Investing & Trading Score: 10 | |
| Day Percent Change: -1.38% Day Change: -0.15 | |
| Week Change: -2.55% Year-to-date Change: -16.1% | |
| TMCI Links: Profile News Message Board | |
| Charts:- Daily , Weekly | |
| Add TMCI to Watchlist: View: Get Complete TMCI Trend Analysis ➞ | |
 | HONE HarborOne Bancorp, Inc. |
| Sector: Financials | |
| SubSector: Savings & Loans | |
| MarketCap: 456.03 Millions | |
| Recent Price: 10.05 Smart Investing & Trading Score: 67 | |
| Day Percent Change: 0.00% Day Change: 0.00 | |
| Week Change: 3.29% Year-to-date Change: -16.1% | |
| HONE Links: Profile News Message Board | |
| Charts:- Daily , Weekly | |
| Add HONE to Watchlist: View: Get Complete HONE Trend Analysis ➞ | |
 | BNL Broadstone Net Lease, Inc. |
| Sector: Financials | |
| SubSector: REIT Diversified | |
| MarketCap: 27267 Millions | |
| Recent Price: 14.44 Smart Investing & Trading Score: 30 | |
| Day Percent Change: -0.76% Day Change: -0.11 | |
| Week Change: 0% Year-to-date Change: -16.1% | |
| BNL Links: Profile News Message Board | |
| Charts:- Daily , Weekly | |
| Add BNL to Watchlist: View: Get Complete BNL Trend Analysis ➞ | |
 | FSBC Five Star Bancorp |
| Sector: Financials | |
| SubSector: Banks - Regional | |
| MarketCap: 377 Millions | |
| Recent Price: 21.95 Smart Investing & Trading Score: 50 | |
| Day Percent Change: -0.09% Day Change: -0.02 | |
| Week Change: 0.05% Year-to-date Change: -16.2% | |
| FSBC Links: Profile News Message Board | |
| Charts:- Daily , Weekly | |
| Add FSBC to Watchlist: View: Get Complete FSBC Trend Analysis ➞ | |
| Too many stocks? View smallcap stocks filtered by marketcap & sector |
| Marketcap: All SmallCap Stocks (default-no microcap), Large, Mid-Range, Small & MicroCap |
| Sector: Tech, Finance, Energy, Staples, Retail, Industrial, Materials, Utilities & Medical |
|
Best Stocks Today 12Stocks.com |
© 2024 12Stocks.com Terms & Conditions Privacy Contact Us
All Information Provided Only For Education And Not To Be Used For Investing or Trading. See Terms & Conditions


One More Thing ... Get Best Stocks Delivered Daily!
Never Ever Miss A Move With Our Top Ten Stocks Lists
Find Best Stocks In Any Market - Bull or Bear Market
Take A Peek At Our Top Ten Stocks Lists: Daily, Weekly, Year-to-Date & Top Trends
Find Best Stocks In Any Market - Bull or Bear Market
Take A Peek At Our Top Ten Stocks Lists: Daily, Weekly, Year-to-Date & Top Trends
Smallcap Stocks With Best Up Trends [0-bearish to 100-bullish]: B. Riley[100], Ribbon [100], Group 1[100], Trustmark [100], MBIA [100], Integer [100], EchoStar [100], Comstock Resources[100], Vishay Inter[100], First Ban[100], Jamf Holding[100]
Best Smallcap Stocks Year-to-Date:
CareMax [574.23%], Janux [352.07%], Viking [249.65%], Alpine Immune[239.13%], Longboard [223.4%], Avidity Biosciences[177.71%], Arcutis Bio[170.9%], Super Micro[165.5%], Vera [149.61%], Hippo [130.79%], Y-mAbs [124.19%] Best Smallcap Stocks This Week:
Matterport [166.09%], B. Riley[48.82%], Seres [30.29%], Riot Blockchain[30.12%], CareMax [27.24%], Ribbon [25.97%], ProKidney [23.28%], SoundHound AI[22.54%], Cipher Mining[22.14%], Hibbett Sports[21.61%], Cullinan Oncology[20.69%] Best Smallcap Stocks Daily:
B. Riley[36.97%], Ribbon [26.46%], Babcock & Wilcox Enterprises[15.57%], Cullinan Oncology[13.55%], Amneal [12.04%], Comtech Tele[10.76%], Innodata [10.28%], Gritstone Oncology[10.06%], Navitas Semiconductor[8.83%], Eyenovia [8.68%], K12 [8.64%]