
 Login Sign Up


| |||||
 |  | ||||

| 12Stocks.com Market Intelligence |
Best SmallCap Stocks
|
| In a hurry? Small Cap Stock Lists: Performance Trends Table, Stock Charts
Sort Small Cap stocks: Daily, Weekly, Year-to-Date, Market Cap & Trends. Filter Small Cap stocks list by sector: Show all, Tech, Finance, Energy, Staples, Retail, Industrial, Materials, Utilities and HealthCare Filter Small Cap stocks list by size: All Large Medium Small and MicroCap |
| 12Stocks.com Small Cap Stocks Performances & Trends Daily | |||||||||
|
|  The overall Smart Investing & Trading Score is 87 (0-bearish to 100-bullish) which puts Small Cap index in short term bullish trend. The Smart Investing & Trading Score from previous trading session is 82 and hence an improvement of trend.
| ||||||||
Here are the Smart Investing & Trading Scores of the most requested small cap stocks at 12Stocks.com (click stock name for detailed review):
|


| 12Stocks.com: Investing in Smallcap Index with Stocks | |
|
The following table helps investors and traders sort through current performance and trends (as measured by Smart Investing & Trading Score) of various
stocks in the Smallcap Index. Quick View: Move mouse or cursor over stock symbol (ticker) to view short-term technical chart and over stock name to view long term chart. Click on  to add stock symbol to your watchlist and to add stock symbol to your watchlist and  to view watchlist. Click on any ticker or stock name for detailed market intelligence report for that stock. to view watchlist. Click on any ticker or stock name for detailed market intelligence report for that stock. |
12Stocks.com Performance of Stocks in Smallcap Index
| Ticker | Stock Name | Watchlist | Category | Recent Price | Smart Investing & Trading Score | Change % | YTD Change% |
| HLX | Helix Energy |   | Energy | 11.37 | 100 | 0.18% | 10.60% |
| MODN | Model N | | Technology | 29.77 | 61 | 0.27% | 10.55% |
| SKWD | Skyward Specialty | | Financials | 37.52 | 88 | -0.07% | 10.52% |
| BANC | Banc of California | | Financials | 14.84 | 100 | 0.34% | 10.50% |
| ATRI | Atrion | | Health Care | 418.25 | 90 | -3.85% | 10.42% |
| ULCC | Frontier Group | | Industrials | 6.00 | 35 | -1.80% | 10.41% |
| RDN | Radian Group | | Financials | 31.50 | 95 | 0.61% | 10.33% |
| IBOC | Bancshares | | Financials | 59.91 | 100 | -0.42% | 10.29% |
| MGEE | MGE Energy | | Utilities | 79.74 | 71 | -0.70% | 10.28% |
| NATR | Nature s | | Health Care | 19.07 | 26 | -0.18% | 10.27% |
| GLRE | Greenlight Capital | | Financials | 12.59 | 70 | 0.08% | 10.25% |
| CSTL | Castle Biosciences | | Health Care | 23.78 | 88 | -2.58% | 10.19% |
| SVRA | Savara | | Health Care | 5.17 | 77 | 4.76% | 10.11% |
| FN | Fabrinet | | Technology | 209.31 | 74 | 10.85% | 9.97% |
| PRA | ProAssurance | | Financials | 15.16 | 100 | 9.70% | 9.93% |
| OII | Oceaneering | | Energy | 23.39 | 90 | -0.51% | 9.92% |
| FCFS | FirstCash | | Financials | 119.13 | 65 | 2.16% | 9.91% |
| NOG | Northern Oil | | Energy | 40.72 | 53 | 0.32% | 9.85% |
| SGHT | Sight Sciences | | Health Care | 5.67 | 66 | -2.24% | 9.78% |
| NTB | Bank of N.T. Butterfield & Son | | Financials | 35.11 | 90 | -0.31% | 9.68% |
| HGV | Hilton Grand | | Services & Goods | 44.05 | 80 | 0.23% | 9.63% |
| DORM | Dorman Products | | Consumer Staples | 91.39 | 87 | -1.61% | 9.57% |
| AMBC | Ambac Financial | | Financials | 18.04 | 100 | 19.31% | 9.47% |
| CMPX | Compass | | Health Care | 1.68 | 50 | -1.47% | 9.45% |
| DHX | DHI Group | | Services & Goods | 2.83 | 74 | 5.99% | 9.27% |


| Too many stocks? View smallcap stocks filtered by marketcap & sector |
| Marketcap: All SmallCap Stocks (default-no microcap), Large, Mid-Range, Small |
| Smallcap Sector: Tech, Finance, Energy, Staples, Retail, Industrial, Materials, & Medical |
|
Get the most comprehensive stock market coverage daily at 12Stocks.com ➞ Best Stocks Today ➞ Best Stocks Weekly ➞ Best Stocks Year-to-Date ➞ Best Stocks Trends ➞  Best Stocks Today 12Stocks.com Best Nasdaq Stocks ➞ Best S&P 500 Stocks ➞ Best Tech Stocks ➞ Best Biotech Stocks ➞ |
| Detailed Overview of SmallCap Stocks |
| SmallCap Technical Overview, Leaders & Laggards, Top SmallCap ETF Funds & Detailed SmallCap Stocks List, Charts, Trends & More |
| Smallcap: Technical Analysis, Trends & YTD Performance | |
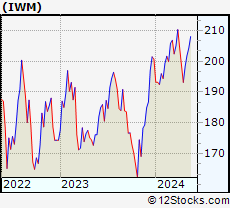
| SmallCap segment as represented by
IWM, an exchange-traded fund [ETF], holds basket of thousands of smallcap stocks from across all major sectors of the US stock market. The smallcap index (contains stocks like Riverbed & Sotheby's) is up by 2.12% and is currently underperforming the overall market by -6% year-to-date. Below is a quick view of technical charts and trends: | |
 IWM Weekly Chart |
|
| Long Term Trend: Very Good | |
| Medium Term Trend: Very Good | |
 IWM Daily Chart |
|
| Short Term Trend: Very Good | |
| Overall Trend Score: 87 | |
| YTD Performance: 2.12% | |
| **Trend Scores & Views Are Only For Educational Purposes And Not For Investing | |
| 12Stocks.com: Top Performing Small Cap Index Stocks | ||||||||||||||||||||||||||||||||||||||||||||||||
 The top performing Small Cap Index stocks year to date are
Now, more recently, over last week, the top performing Small Cap Index stocks on the move are


|
||||||||||||||||||||||||||||||||||||||||||||||||
| 12Stocks.com: Investing in Smallcap Index using Exchange Traded Funds | |
|
The following table shows list of key exchange traded funds (ETF) that
help investors track Smallcap index. The following list also includes leveraged ETF funds that track twice or thrice the daily returns of Smallcap indices. Short or inverse ETF funds move in the opposite direction to the index they track and are useful during market pullbacks or during bear markets. Quick View: Move mouse or cursor over ETF symbol (ticker) to view short-term technical chart and over ETF name to view long term chart. Click on ticker or stock name for detailed view. Click on to add stock symbol to your watchlist and to view watchlist. |
12Stocks.com List of ETFs that track Smallcap Index
| Ticker | ETF Name | Watchlist | Recent Price | Smart Investing & Trading Score | Change % | Week % | Year-to-date % |
| IWM | iShares Russell 2000 | | 204.97 | 87 | 0.22 | 1.52 | 2.12% |
| IJR | iShares Core S&P Small-Cap | | 108.62 | 100 | 0.33 | 1.39 | 0.34% |
| VTWO | Vanguard Russell 2000 ETF | | 82.85 | 82 | 0.23 | 1.52 | 2.16% |
| IWN | iShares Russell 2000 Value | | 155.63 | 100 | -0.01 | 0.92 | 0.19% |
| IWO | iShares Russell 2000 Growth | | 262.30 | 69 | 0.49 | 2.11 | 4% |
| IJS | iShares S&P Small-Cap 600 Value | | 99.68 | 82 | -0.07 | 0.97 | -3.29% |
| IJT | iShares S&P Small-Cap 600 Growth | | 130.16 | 95 | 0.81 | 1.88 | 4.01% |
| XSLV | PowerShares S&P SmallCap Low Volatil ETF | | 44.00 | 100 | 0.96 | 1.8 | -0.34% |
| SAA | ProShares Ultra SmallCap600 | | 24.39 | 95 | 1.16 | 3.39 | -2.24% |
| SMLV | SPDR SSGA US Small Cap Low Volatil ETF | | 110.48 | 82 | -0.10 | 0.72 | -1.81% |
| SBB | ProShares Short SmallCap600 | | 15.97 | 13 | -0.50 | -1.18 | 0.25% |
| SDD | ProShares UltraShort SmallCap600 | | 18.22 | 10 | -1.10 | -3.33 | -1.13% |
| 12Stocks.com: Charts, Trends, Fundamental Data and Performances of SmallCap Stocks | |
|
We now take in-depth look at all SmallCap stocks including charts, multi-period performances and overall trends (as measured by Smart Investing & Trading Score). One can sort SmallCap stocks (click link to choose) by Daily, Weekly and by Year-to-Date performances. Also, one can sort by size of the company or by market capitalization. |
| Select Your Default Chart Type: | |||||
| |||||
| Click on stock symbol or name for detailed view. Click on to add stock symbol to your watchlist and to view watchlist. Quick View: Move mouse or cursor over "Daily" to quickly view daily technical stock chart and over "Weekly" to view weekly technical stock chart. | |||||

 | HLX Helix Energy Solutions Group, Inc. |
| Sector: Energy | |
| SubSector: Oil & Gas Equipment & Services | |
| MarketCap: 341.661 Millions | |
| Recent Price: 11.37 Smart Investing & Trading Score: 100 | |
| Day Percent Change: 0.18% Day Change: 0.02 | |
| Week Change: 3.84% Year-to-date Change: 10.6% | |
| HLX Links: Profile News Message Board | |
| Charts:- Daily , Weekly | |
| Add HLX to Watchlist: View: Get Complete HLX Trend Analysis ➞ | |
 | MODN Model N, Inc. |
| Sector: Technology | |
| SubSector: Application Software | |
| MarketCap: 670.162 Millions | |
| Recent Price: 29.77 Smart Investing & Trading Score: 61 | |
| Day Percent Change: 0.27% Day Change: 0.08 | |
| Week Change: -0.13% Year-to-date Change: 10.6% | |
| MODN Links: Profile News Message Board | |
| Charts:- Daily , Weekly | |
| Add MODN to Watchlist: View: Get Complete MODN Trend Analysis ➞ | |
 | SKWD Skyward Specialty Insurance Group, Inc. |
| Sector: Financials | |
| SubSector: Insurance - Property & Casualty | |
| MarketCap: 936 Millions | |
| Recent Price: 37.52 Smart Investing & Trading Score: 88 | |
| Day Percent Change: -0.07% Day Change: -0.02 | |
| Week Change: 2.44% Year-to-date Change: 10.5% | |
| SKWD Links: Profile News Message Board | |
| Charts:- Daily , Weekly | |
| Add SKWD to Watchlist: View: Get Complete SKWD Trend Analysis ➞ | |
 | BANC Banc of California, Inc. |
| Sector: Financials | |
| SubSector: Regional - Pacific Banks | |
| MarketCap: 459.929 Millions | |
| Recent Price: 14.84 Smart Investing & Trading Score: 100 | |
| Day Percent Change: 0.34% Day Change: 0.05 | |
| Week Change: 1.44% Year-to-date Change: 10.5% | |
| BANC Links: Profile News Message Board | |
| Charts:- Daily , Weekly | |
| Add BANC to Watchlist: View: Get Complete BANC Trend Analysis ➞ | |
 | ATRI Atrion Corporation |
| Sector: Health Care | |
| SubSector: Medical Instruments & Supplies | |
| MarketCap: 1234.6 Millions | |
| Recent Price: 418.25 Smart Investing & Trading Score: 90 | |
| Day Percent Change: -3.85% Day Change: -16.75 | |
| Week Change: 0.8% Year-to-date Change: 10.4% | |
| ATRI Links: Profile News Message Board | |
| Charts:- Daily , Weekly | |
| Add ATRI to Watchlist: View: Get Complete ATRI Trend Analysis ➞ | |
 | ULCC Frontier Group Holdings, Inc. |
| Sector: Industrials | |
| SubSector: Airlines | |
| MarketCap: 2160 Millions | |
| Recent Price: 6.00 Smart Investing & Trading Score: 35 | |
| Day Percent Change: -1.80% Day Change: -0.11 | |
| Week Change: 1.27% Year-to-date Change: 10.4% | |
| ULCC Links: Profile News Message Board | |
| Charts:- Daily , Weekly | |
| Add ULCC to Watchlist: View: Get Complete ULCC Trend Analysis ➞ | |
 | RDN Radian Group Inc. |
| Sector: Financials | |
| SubSector: Property & Casualty Insurance | |
| MarketCap: 2950.12 Millions | |
| Recent Price: 31.50 Smart Investing & Trading Score: 95 | |
| Day Percent Change: 0.61% Day Change: 0.19 | |
| Week Change: 2.31% Year-to-date Change: 10.3% | |
| RDN Links: Profile News Message Board | |
| Charts:- Daily , Weekly | |
| Add RDN to Watchlist: View: Get Complete RDN Trend Analysis ➞ | |
 | IBOC International Bancshares Corporation |
| Sector: Financials | |
| SubSector: Regional - Southwest Banks | |
| MarketCap: 1159.45 Millions | |
| Recent Price: 59.91 Smart Investing & Trading Score: 100 | |
| Day Percent Change: -0.42% Day Change: -0.25 | |
| Week Change: 0.82% Year-to-date Change: 10.3% | |
| IBOC Links: Profile News Message Board | |
| Charts:- Daily , Weekly | |
| Add IBOC to Watchlist: View: Get Complete IBOC Trend Analysis ➞ | |
 | MGEE MGE Energy, Inc. |
| Sector: Utilities | |
| SubSector: Diversified Utilities | |
| MarketCap: 2608.3 Millions | |
| Recent Price: 79.74 Smart Investing & Trading Score: 71 | |
| Day Percent Change: -0.70% Day Change: -0.56 | |
| Week Change: -0.21% Year-to-date Change: 10.3% | |
| MGEE Links: Profile News Message Board | |
| Charts:- Daily , Weekly | |
| Add MGEE to Watchlist: View: Get Complete MGEE Trend Analysis ➞ | |
 | NATR Nature s Sunshine Products, Inc. |
| Sector: Health Care | |
| SubSector: Drugs - Generic | |
| MarketCap: 153.285 Millions | |
| Recent Price: 19.07 Smart Investing & Trading Score: 26 | |
| Day Percent Change: -0.18% Day Change: -0.04 | |
| Week Change: 0.03% Year-to-date Change: 10.3% | |
| NATR Links: Profile News Message Board | |
| Charts:- Daily , Weekly | |
| Add NATR to Watchlist: View: Get Complete NATR Trend Analysis ➞ | |
 | GLRE Greenlight Capital Re, Ltd. |
| Sector: Financials | |
| SubSector: Accident & Health Insurance | |
| MarketCap: 228.66 Millions | |
| Recent Price: 12.59 Smart Investing & Trading Score: 70 | |
| Day Percent Change: 0.08% Day Change: 0.01 | |
| Week Change: 0.96% Year-to-date Change: 10.3% | |
| GLRE Links: Profile News Message Board | |
| Charts:- Daily , Weekly | |
| Add GLRE to Watchlist: View: Get Complete GLRE Trend Analysis ➞ | |
 | CSTL Castle Biosciences, Inc. |
| Sector: Health Care | |
| SubSector: Medical Laboratories & Research | |
| MarketCap: 545 Millions | |
| Recent Price: 23.78 Smart Investing & Trading Score: 88 | |
| Day Percent Change: -2.58% Day Change: -0.63 | |
| Week Change: -2.26% Year-to-date Change: 10.2% | |
| CSTL Links: Profile News Message Board | |
| Charts:- Daily , Weekly | |
| Add CSTL to Watchlist: View: Get Complete CSTL Trend Analysis ➞ | |
 | SVRA Savara Inc. |
| Sector: Health Care | |
| SubSector: Biotechnology | |
| MarketCap: 80.3785 Millions | |
| Recent Price: 5.17 Smart Investing & Trading Score: 77 | |
| Day Percent Change: 4.76% Day Change: 0.23 | |
| Week Change: 9.99% Year-to-date Change: 10.1% | |
| SVRA Links: Profile News Message Board | |
| Charts:- Daily , Weekly | |
| Add SVRA to Watchlist: View: Get Complete SVRA Trend Analysis ➞ | |
 | FN Fabrinet |
| Sector: Technology | |
| SubSector: Electronic Equipment | |
| MarketCap: 1876 Millions | |
| Recent Price: 209.31 Smart Investing & Trading Score: 74 | |
| Day Percent Change: 10.85% Day Change: 20.48 | |
| Week Change: 16.79% Year-to-date Change: 10.0% | |
| FN Links: Profile News Message Board | |
| Charts:- Daily , Weekly | |
| Add FN to Watchlist: View: Get Complete FN Trend Analysis ➞ | |
 | PRA ProAssurance Corporation |
| Sector: Financials | |
| SubSector: Accident & Health Insurance | |
| MarketCap: 1434.6 Millions | |
| Recent Price: 15.16 Smart Investing & Trading Score: 100 | |
| Day Percent Change: 9.70% Day Change: 1.34 | |
| Week Change: 9.62% Year-to-date Change: 9.9% | |
| PRA Links: Profile News Message Board | |
| Charts:- Daily , Weekly | |
| Add PRA to Watchlist: View: Get Complete PRA Trend Analysis ➞ | |
 | OII Oceaneering International, Inc. |
| Sector: Energy | |
| SubSector: Oil & Gas Equipment & Services | |
| MarketCap: 324.061 Millions | |
| Recent Price: 23.39 Smart Investing & Trading Score: 90 | |
| Day Percent Change: -0.51% Day Change: -0.12 | |
| Week Change: 2.18% Year-to-date Change: 9.9% | |
| OII Links: Profile News Message Board | |
| Charts:- Daily , Weekly | |
| Add OII to Watchlist: View: Get Complete OII Trend Analysis ➞ | |
 | FCFS FirstCash, Inc. |
| Sector: Financials | |
| SubSector: Credit Services | |
| MarketCap: 2795.48 Millions | |
| Recent Price: 119.13 Smart Investing & Trading Score: 65 | |
| Day Percent Change: 2.16% Day Change: 2.52 | |
| Week Change: 2.39% Year-to-date Change: 9.9% | |
| FCFS Links: Profile News Message Board | |
| Charts:- Daily , Weekly | |
| Add FCFS to Watchlist: View: Get Complete FCFS Trend Analysis ➞ | |
 | NOG Northern Oil and Gas, Inc. |
| Sector: Energy | |
| SubSector: Oil & Gas Drilling & Exploration | |
| MarketCap: 301.939 Millions | |
| Recent Price: 40.72 Smart Investing & Trading Score: 53 | |
| Day Percent Change: 0.32% Day Change: 0.13 | |
| Week Change: 1.17% Year-to-date Change: 9.9% | |
| NOG Links: Profile News Message Board | |
| Charts:- Daily , Weekly | |
| Add NOG to Watchlist: View: Get Complete NOG Trend Analysis ➞ | |
 | SGHT Sight Sciences, Inc. |
| Sector: Health Care | |
| SubSector: Medical Devices | |
| MarketCap: 381 Millions | |
| Recent Price: 5.67 Smart Investing & Trading Score: 66 | |
| Day Percent Change: -2.24% Day Change: -0.13 | |
| Week Change: -2.24% Year-to-date Change: 9.8% | |
| SGHT Links: Profile News Message Board | |
| Charts:- Daily , Weekly | |
| Add SGHT to Watchlist: View: Get Complete SGHT Trend Analysis ➞ | |
 | NTB The Bank of N.T. Butterfield & Son Limited |
| Sector: Financials | |
| SubSector: Foreign Regional Banks | |
| MarketCap: 889.379 Millions | |
| Recent Price: 35.11 Smart Investing & Trading Score: 90 | |
| Day Percent Change: -0.31% Day Change: -0.11 | |
| Week Change: -0.74% Year-to-date Change: 9.7% | |
| NTB Links: Profile News Message Board | |
| Charts:- Daily , Weekly | |
| Add NTB to Watchlist: View: Get Complete NTB Trend Analysis ➞ | |
 | HGV Hilton Grand Vacations Inc. |
| Sector: Services & Goods | |
| SubSector: Resorts & Casinos | |
| MarketCap: 1333.04 Millions | |
| Recent Price: 44.05 Smart Investing & Trading Score: 80 | |
| Day Percent Change: 0.23% Day Change: 0.10 | |
| Week Change: 2.06% Year-to-date Change: 9.6% | |
| HGV Links: Profile News Message Board | |
| Charts:- Daily , Weekly | |
| Add HGV to Watchlist: View: Get Complete HGV Trend Analysis ➞ | |
 | DORM Dorman Products, Inc. |
| Sector: Consumer Staples | |
| SubSector: Auto Parts | |
| MarketCap: 2028.79 Millions | |
| Recent Price: 91.39 Smart Investing & Trading Score: 87 | |
| Day Percent Change: -1.61% Day Change: -1.50 | |
| Week Change: 0.48% Year-to-date Change: 9.6% | |
| DORM Links: Profile News Message Board | |
| Charts:- Daily , Weekly | |
| Add DORM to Watchlist: View: Get Complete DORM Trend Analysis ➞ | |
 | AMBC Ambac Financial Group, Inc. |
| Sector: Financials | |
| SubSector: Surety & Title Insurance | |
| MarketCap: 587.818 Millions | |
| Recent Price: 18.04 Smart Investing & Trading Score: 100 | |
| Day Percent Change: 19.31% Day Change: 2.92 | |
| Week Change: 22.97% Year-to-date Change: 9.5% | |
| AMBC Links: Profile News Message Board | |
| Charts:- Daily , Weekly | |
| Add AMBC to Watchlist: View: Get Complete AMBC Trend Analysis ➞ | |
 | CMPX Compass Therapeutics, Inc. |
| Sector: Health Care | |
| SubSector: Biotechnology | |
| MarketCap: 406 Millions | |
| Recent Price: 1.68 Smart Investing & Trading Score: 50 | |
| Day Percent Change: -1.47% Day Change: -0.03 | |
| Week Change: -5.08% Year-to-date Change: 9.5% | |
| CMPX Links: Profile News Message Board | |
| Charts:- Daily , Weekly | |
| Add CMPX to Watchlist: View: Get Complete CMPX Trend Analysis ➞ | |
 | DHX DHI Group, Inc. |
| Sector: Services & Goods | |
| SubSector: Staffing & Outsourcing Services | |
| MarketCap: 144.728 Millions | |
| Recent Price: 2.83 Smart Investing & Trading Score: 74 | |
| Day Percent Change: 5.99% Day Change: 0.16 | |
| Week Change: 6.39% Year-to-date Change: 9.3% | |
| DHX Links: Profile News Message Board | |
| Charts:- Daily , Weekly | |
| Add DHX to Watchlist: View: Get Complete DHX Trend Analysis ➞ | |
| Too many stocks? View smallcap stocks filtered by marketcap & sector |
| Marketcap: All SmallCap Stocks (default-no microcap), Large, Mid-Range, Small & MicroCap |
| Sector: Tech, Finance, Energy, Staples, Retail, Industrial, Materials, Utilities & Medical |
|
Best Stocks Today 12Stocks.com |
© 2024 12Stocks.com Terms & Conditions Privacy Contact Us
All Information Provided Only For Education And Not To Be Used For Investing or Trading. See Terms & Conditions


One More Thing ... Get Best Stocks Delivered Daily!
Never Ever Miss A Move With Our Top Ten Stocks Lists
Find Best Stocks In Any Market - Bull or Bear Market
Take A Peek At Our Top Ten Stocks Lists: Daily, Weekly, Year-to-Date & Top Trends
Find Best Stocks In Any Market - Bull or Bear Market
Take A Peek At Our Top Ten Stocks Lists: Daily, Weekly, Year-to-Date & Top Trends
Smallcap Stocks With Best Up Trends [0-bearish to 100-bullish]: Design [100], Ambac Financial[100], Summit [100], EverQuote [100], Zeta Global[100], Coca-Cola Consolidated[100], Origin Materials[100], J & J Snack Foods[100], Sterling Construction[100], Vanda [100], Semrush [100]
Best Smallcap Stocks Year-to-Date:
Janux [471.8%], Viking [327.92%], Longboard [261.21%], Alpine Immune[239.34%], Bakkt [227.35%], Vera [190.57%], Super Micro[188.3%], Cullinan Oncology[187.84%], Avidity Biosciences[180.97%], Y-mAbs [152.49%], Arcutis Bio[143.81%] Best Smallcap Stocks This Week:
Perficient [52.28%], Thoughtworks Holding[34.22%], Trupanion [28.82%], DASAN Zhone[26.29%], Great Lakes[26.01%], Design [23.42%], Workhorse Group[23.19%], Ambac Financial[22.97%], P3 Health[22.14%], Summit [20.73%], Sterling Construction[20.6%] Best Smallcap Stocks Daily:
Design [28.85%], Great Lakes[24.57%], Thoughtworks Holding[19.84%], Ambac Financial[19.31%], Summit [18.57%], EverQuote [18.40%], Zeta Global[18.35%], Coca-Cola Consolidated[17.76%], FibroGen [17.67%], Origin Materials[17.31%], J & J Snack Foods[16.43%]