
 Login Sign Up


| |||||
 |  | ||||

| 12Stocks.com Market Intelligence |
Best SmallCap Stocks
|
| In a hurry? Small Cap Stock Lists: Performance Trends Table, Stock Charts
Sort Small Cap stocks: Daily, Weekly, Year-to-Date, Market Cap & Trends. Filter Small Cap stocks list by sector: Show all, Tech, Finance, Energy, Staples, Retail, Industrial, Materials, Utilities and HealthCare Filter Small Cap stocks list by size: All Large Medium Small and MicroCap |
| 12Stocks.com Small Cap Stocks Performances & Trends Daily | |||||||||
|
|  The overall Smart Investing & Trading Score is 56 (0-bearish to 100-bullish) which puts Small Cap index in short term neutral trend. The Smart Investing & Trading Score from previous trading session is 44 and hence an improvement of trend.
| ||||||||
Here are the Smart Investing & Trading Scores of the most requested small cap stocks at 12Stocks.com (click stock name for detailed review):
|


| 12Stocks.com: Investing in Smallcap Index with Stocks | |
|
The following table helps investors and traders sort through current performance and trends (as measured by Smart Investing & Trading Score) of various
stocks in the Smallcap Index. Quick View: Move mouse or cursor over stock symbol (ticker) to view short-term technical chart and over stock name to view long term chart. Click on  to add stock symbol to your watchlist and to add stock symbol to your watchlist and  to view watchlist. Click on any ticker or stock name for detailed market intelligence report for that stock. to view watchlist. Click on any ticker or stock name for detailed market intelligence report for that stock. |
12Stocks.com Performance of Stocks in Smallcap Index
| Ticker | Stock Name | Watchlist | Category | Recent Price | Smart Investing & Trading Score | Change % | YTD Change% |
| SEM | Select Medical |   | Health Care | 27.41 | 61 | 0.07% | 16.64% |
| CRK | Comstock Resources | | Energy | 10.32 | 100 | 0.19% | 16.61% |
| SLQT | SelectQuote | | Financials | 1.60 | 48 | 3.24% | 16.42% |
| MYRG | MYR Group | | Industrials | 168.21 | 68 | 1.29% | 16.30% |
| CBZ | CBIZ | | Services & Goods | 72.76 | 76 | -3.67% | 16.25% |
| EPAC | Enerpac Tool | | Industrials | 36.14 | 80 | 0.31% | 16.24% |
| APOG | Apogee Enterprises | | Industrials | 62.08 | 93 | 1.24% | 16.23% |
| TRTX | TPG RE | | Financials | 7.55 | 83 | 0.00% | 16.15% |
| MLR | Miller Industries | | Consumer Staples | 49.08 | 61 | 0.16% | 16.06% |
| MNKD | MannKind | | Health Care | 4.22 | 50 | 0.96% | 15.93% |
| TSQ | Townsquare Media | | Services & Goods | 12.24 | 93 | 0.91% | 15.91% |
| KODK | Eastman Kodak | | Technology | 4.52 | 46 | 2.73% | 15.90% |
| MTDR | Matador Resources | | Energy | 65.61 | 61 | 0.05% | 15.39% |
| AEO | American Eagle | | Services & Goods | 24.39 | 88 | 6.32% | 15.26% |
| LMAT | LeMaitre Vascular | | Health Care | 65.38 | 58 | 3.79% | 15.19% |
| SWIM | Latham Group | | Industrials | 3.04 | 61 | 0.00% | 15.15% |
| PBH | Prestige Consumer | | Health Care | 70.47 | 83 | 0.47% | 15.11% |
| CSWI | CSW Industrials | | Industrials | 238.74 | 78 | 0.43% | 15.11% |
| HCC | Warrior Met | | Materials | 70.13 | 100 | 0.83% | 15.02% |
| ASTE | Astec Industries | | Industrials | 42.65 | 68 | 0.40% | 14.65% |
| NODK | NI | | Financials | 14.88 | 83 | -1.59% | 14.55% |
| STEP | StepStone Group | | Financials | 36.45 | 93 | 3.02% | 14.46% |
| VRNT | Verint Systems | | Technology | 30.93 | 90 | 2.42% | 14.43% |
| OSG | Overseas Shipholding | | Transports | 6.03 | 25 | -0.50% | 14.42% |
| ATKR | Atkore | | Industrials | 182.99 | 75 | 0.98% | 14.37% |


| Too many stocks? View smallcap stocks filtered by marketcap & sector |
| Marketcap: All SmallCap Stocks (default-no microcap), Large, Mid-Range, Small |
| Smallcap Sector: Tech, Finance, Energy, Staples, Retail, Industrial, Materials, & Medical |
|
Get the most comprehensive stock market coverage daily at 12Stocks.com ➞ Best Stocks Today ➞ Best Stocks Weekly ➞ Best Stocks Year-to-Date ➞ Best Stocks Trends ➞  Best Stocks Today 12Stocks.com Best Nasdaq Stocks ➞ Best S&P 500 Stocks ➞ Best Tech Stocks ➞ Best Biotech Stocks ➞ |
| Detailed Overview of SmallCap Stocks |
| SmallCap Technical Overview, Leaders & Laggards, Top SmallCap ETF Funds & Detailed SmallCap Stocks List, Charts, Trends & More |
| Smallcap: Technical Analysis, Trends & YTD Performance | |
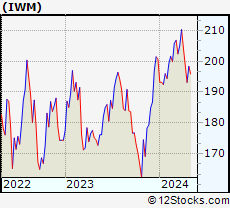
| SmallCap segment as represented by
IWM, an exchange-traded fund [ETF], holds basket of thousands of smallcap stocks from across all major sectors of the US stock market. The smallcap index (contains stocks like Riverbed & Sotheby's) is down by -1.16% and is currently underperforming the overall market by -7.3% year-to-date. Below is a quick view of technical charts and trends: | |
 IWM Weekly Chart |
|
| Long Term Trend: Good | |
| Medium Term Trend: Not Good | |
 IWM Daily Chart |
|
| Short Term Trend: Very Good | |
| Overall Trend Score: 56 | |
| YTD Performance: -1.16% | |
| **Trend Scores & Views Are Only For Educational Purposes And Not For Investing | |
| 12Stocks.com: Top Performing Small Cap Index Stocks | ||||||||||||||||||||||||||||||||||||||||||||||||
 The top performing Small Cap Index stocks year to date are
Now, more recently, over last week, the top performing Small Cap Index stocks on the move are


|
||||||||||||||||||||||||||||||||||||||||||||||||
| 12Stocks.com: Investing in Smallcap Index using Exchange Traded Funds | |
|
The following table shows list of key exchange traded funds (ETF) that
help investors track Smallcap index. The following list also includes leveraged ETF funds that track twice or thrice the daily returns of Smallcap indices. Short or inverse ETF funds move in the opposite direction to the index they track and are useful during market pullbacks or during bear markets. Quick View: Move mouse or cursor over ETF symbol (ticker) to view short-term technical chart and over ETF name to view long term chart. Click on ticker or stock name for detailed view. Click on to add stock symbol to your watchlist and to view watchlist. |
12Stocks.com List of ETFs that track Smallcap Index
| Ticker | ETF Name | Watchlist | Recent Price | Smart Investing & Trading Score | Change % | Week % | Year-to-date % |
| IWM | iShares Russell 2000 | | 198.39 | 56 | 0.97 | 2.72 | -1.16% |
| IJR | iShares Core S&P Small-Cap | | 105.65 | 85 | 0.75 | 2.35 | -2.4% |
| VTWO | Vanguard Russell 2000 ETF | | 80.28 | 70 | 1.04 | 2.82 | -1.01% |
| IWN | iShares Russell 2000 Value | | 151.14 | 75 | 0.64 | 2.27 | -2.7% |
| IWO | iShares Russell 2000 Growth | | 253.09 | 58 | 1.29 | 3.18 | 0.34% |
| IJS | iShares S&P Small-Cap 600 Value | | 97.19 | 67 | 0.52 | 1.65 | -5.7% |
| IJT | iShares S&P Small-Cap 600 Growth | | 126.16 | 70 | 0.88 | 3.23 | 0.82% |
| XSLV | PowerShares S&P SmallCap Low Volatil ETF | | 42.72 | 80 | 0.42 | 1.28 | -3.24% |
| SAA | ProShares Ultra SmallCap600 | | 23.04 | 65 | 1.65 | 5.67 | -7.68% |
| SBB | ProShares Short SmallCap600 | | 16.39 | 33 | -0.70 | -2.7 | 2.86% |
| SDD | ProShares UltraShort SmallCap600 | | 19.35 | 35 | -1.17 | -4.87 | 5.01% |
| SMLV | SPDR SSGA US Small Cap Low Volatil ETF | | 107.52 | 80 | 0.18 | 1.35 | -4.44% |
| 12Stocks.com: Charts, Trends, Fundamental Data and Performances of SmallCap Stocks | |
|
We now take in-depth look at all SmallCap stocks including charts, multi-period performances and overall trends (as measured by Smart Investing & Trading Score). One can sort SmallCap stocks (click link to choose) by Daily, Weekly and by Year-to-Date performances. Also, one can sort by size of the company or by market capitalization. |
| Select Your Default Chart Type: | |||||
| |||||
| Click on stock symbol or name for detailed view. Click on to add stock symbol to your watchlist and to view watchlist. Quick View: Move mouse or cursor over "Daily" to quickly view daily technical stock chart and over "Weekly" to view weekly technical stock chart. | |||||

 | SEM Select Medical Holdings Corporation |
| Sector: Health Care | |
| SubSector: Hospitals | |
| MarketCap: 1765.96 Millions | |
| Recent Price: 27.41 Smart Investing & Trading Score: 61 | |
| Day Percent Change: 0.07% Day Change: 0.02 | |
| Week Change: 1.29% Year-to-date Change: 16.6% | |
| SEM Links: Profile News Message Board | |
| Charts:- Daily , Weekly | |
| Add SEM to Watchlist: View: Get Complete SEM Trend Analysis ➞ | |
 | CRK Comstock Resources, Inc. |
| Sector: Energy | |
| SubSector: Independent Oil & Gas | |
| MarketCap: 959.793 Millions | |
| Recent Price: 10.32 Smart Investing & Trading Score: 100 | |
| Day Percent Change: 0.19% Day Change: 0.02 | |
| Week Change: 8.4% Year-to-date Change: 16.6% | |
| CRK Links: Profile News Message Board | |
| Charts:- Daily , Weekly | |
| Add CRK to Watchlist: View: Get Complete CRK Trend Analysis ➞ | |
 | SLQT SelectQuote, Inc. |
| Sector: Financials | |
| SubSector: Insurance Brokers | |
| MarketCap: 38257 Millions | |
| Recent Price: 1.60 Smart Investing & Trading Score: 48 | |
| Day Percent Change: 3.24% Day Change: 0.05 | |
| Week Change: -6.45% Year-to-date Change: 16.4% | |
| SLQT Links: Profile News Message Board | |
| Charts:- Daily , Weekly | |
| Add SLQT to Watchlist: View: Get Complete SLQT Trend Analysis ➞ | |
 | MYRG MYR Group Inc. |
| Sector: Industrials | |
| SubSector: General Contractors | |
| MarketCap: 405.363 Millions | |
| Recent Price: 168.21 Smart Investing & Trading Score: 68 | |
| Day Percent Change: 1.29% Day Change: 2.15 | |
| Week Change: 5.99% Year-to-date Change: 16.3% | |
| MYRG Links: Profile News Message Board | |
| Charts:- Daily , Weekly | |
| Add MYRG to Watchlist: View: Get Complete MYRG Trend Analysis ➞ | |
 | CBZ CBIZ, Inc. |
| Sector: Services & Goods | |
| SubSector: Business Services | |
| MarketCap: 1121.32 Millions | |
| Recent Price: 72.76 Smart Investing & Trading Score: 76 | |
| Day Percent Change: -3.67% Day Change: -2.77 | |
| Week Change: -2.88% Year-to-date Change: 16.3% | |
| CBZ Links: Profile News Message Board | |
| Charts:- Daily , Weekly | |
| Add CBZ to Watchlist: View: Get Complete CBZ Trend Analysis ➞ | |
 | EPAC Enerpac Tool Group Corp. |
| Sector: Industrials | |
| SubSector: Diversified Machinery | |
| MarketCap: 1044.16 Millions | |
| Recent Price: 36.14 Smart Investing & Trading Score: 80 | |
| Day Percent Change: 0.31% Day Change: 0.11 | |
| Week Change: 3.2% Year-to-date Change: 16.2% | |
| EPAC Links: Profile News Message Board | |
| Charts:- Daily , Weekly | |
| Add EPAC to Watchlist: View: Get Complete EPAC Trend Analysis ➞ | |
 | APOG Apogee Enterprises, Inc. |
| Sector: Industrials | |
| SubSector: General Building Materials | |
| MarketCap: 510.653 Millions | |
| Recent Price: 62.08 Smart Investing & Trading Score: 93 | |
| Day Percent Change: 1.24% Day Change: 0.76 | |
| Week Change: 7.13% Year-to-date Change: 16.2% | |
| APOG Links: Profile News Message Board | |
| Charts:- Daily , Weekly | |
| Add APOG to Watchlist: View: Get Complete APOG Trend Analysis ➞ | |
 | TRTX TPG RE Finance Trust, Inc. |
| Sector: Financials | |
| SubSector: Mortgage Investment | |
| MarketCap: 607.739 Millions | |
| Recent Price: 7.55 Smart Investing & Trading Score: 83 | |
| Day Percent Change: 0.00% Day Change: 0.00 | |
| Week Change: 0.53% Year-to-date Change: 16.2% | |
| TRTX Links: Profile News Message Board | |
| Charts:- Daily , Weekly | |
| Add TRTX to Watchlist: View: Get Complete TRTX Trend Analysis ➞ | |
 | MLR Miller Industries, Inc. |
| Sector: Consumer Staples | |
| SubSector: Auto Parts | |
| MarketCap: 335.239 Millions | |
| Recent Price: 49.08 Smart Investing & Trading Score: 61 | |
| Day Percent Change: 0.16% Day Change: 0.08 | |
| Week Change: -0.22% Year-to-date Change: 16.1% | |
| MLR Links: Profile News Message Board | |
| Charts:- Daily , Weekly | |
| Add MLR to Watchlist: View: Get Complete MLR Trend Analysis ➞ | |
 | MNKD MannKind Corporation |
| Sector: Health Care | |
| SubSector: Biotechnology | |
| MarketCap: 250.885 Millions | |
| Recent Price: 4.22 Smart Investing & Trading Score: 50 | |
| Day Percent Change: 0.96% Day Change: 0.04 | |
| Week Change: 0.96% Year-to-date Change: 15.9% | |
| MNKD Links: Profile News Message Board | |
| Charts:- Daily , Weekly | |
| Add MNKD to Watchlist: View: Get Complete MNKD Trend Analysis ➞ | |
 | TSQ Townsquare Media, Inc. |
| Sector: Services & Goods | |
| SubSector: Broadcasting - Radio | |
| MarketCap: 101.795 Millions | |
| Recent Price: 12.24 Smart Investing & Trading Score: 93 | |
| Day Percent Change: 0.91% Day Change: 0.11 | |
| Week Change: 2.77% Year-to-date Change: 15.9% | |
| TSQ Links: Profile News Message Board | |
| Charts:- Daily , Weekly | |
| Add TSQ to Watchlist: View: Get Complete TSQ Trend Analysis ➞ | |
 | KODK Eastman Kodak Company |
| Sector: Technology | |
| SubSector: Electronic Equipment | |
| MarketCap: 78.47 Millions | |
| Recent Price: 4.52 Smart Investing & Trading Score: 46 | |
| Day Percent Change: 2.73% Day Change: 0.12 | |
| Week Change: -2.16% Year-to-date Change: 15.9% | |
| KODK Links: Profile News Message Board | |
| Charts:- Daily , Weekly | |
| Add KODK to Watchlist: View: Get Complete KODK Trend Analysis ➞ | |
 | MTDR Matador Resources Company |
| Sector: Energy | |
| SubSector: Independent Oil & Gas | |
| MarketCap: 196.593 Millions | |
| Recent Price: 65.61 Smart Investing & Trading Score: 61 | |
| Day Percent Change: 0.05% Day Change: 0.03 | |
| Week Change: 1.55% Year-to-date Change: 15.4% | |
| MTDR Links: Profile News Message Board | |
| Charts:- Daily , Weekly | |
| Add MTDR to Watchlist: View: Get Complete MTDR Trend Analysis ➞ | |
 | AEO American Eagle Outfitters, Inc. |
| Sector: Services & Goods | |
| SubSector: Apparel Stores | |
| MarketCap: 1577.08 Millions | |
| Recent Price: 24.39 Smart Investing & Trading Score: 88 | |
| Day Percent Change: 6.32% Day Change: 1.45 | |
| Week Change: 8.98% Year-to-date Change: 15.3% | |
| AEO Links: Profile News Message Board | |
| Charts:- Daily , Weekly | |
| Add AEO to Watchlist: View: Get Complete AEO Trend Analysis ➞ | |
 | LMAT LeMaitre Vascular, Inc. |
| Sector: Health Care | |
| SubSector: Medical Instruments & Supplies | |
| MarketCap: 522.16 Millions | |
| Recent Price: 65.38 Smart Investing & Trading Score: 58 | |
| Day Percent Change: 3.79% Day Change: 2.39 | |
| Week Change: 3.35% Year-to-date Change: 15.2% | |
| LMAT Links: Profile News Message Board | |
| Charts:- Daily , Weekly | |
| Add LMAT to Watchlist: View: Get Complete LMAT Trend Analysis ➞ | |
 | SWIM Latham Group, Inc. |
| Sector: Industrials | |
| SubSector: Building Products & Equipment | |
| MarketCap: 388 Millions | |
| Recent Price: 3.04 Smart Investing & Trading Score: 61 | |
| Day Percent Change: 0.00% Day Change: 0.00 | |
| Week Change: -0.98% Year-to-date Change: 15.2% | |
| SWIM Links: Profile News Message Board | |
| Charts:- Daily , Weekly | |
| Add SWIM to Watchlist: View: Get Complete SWIM Trend Analysis ➞ | |
 | PBH Prestige Consumer Healthcare Inc. |
| Sector: Health Care | |
| SubSector: Medical Appliances & Equipment | |
| MarketCap: 1639.6 Millions | |
| Recent Price: 70.47 Smart Investing & Trading Score: 83 | |
| Day Percent Change: 0.47% Day Change: 0.33 | |
| Week Change: 1.15% Year-to-date Change: 15.1% | |
| PBH Links: Profile News Message Board | |
| Charts:- Daily , Weekly | |
| Add PBH to Watchlist: View: Get Complete PBH Trend Analysis ➞ | |
 | CSWI CSW Industrials, Inc. |
| Sector: Industrials | |
| SubSector: Diversified Machinery | |
| MarketCap: 985.616 Millions | |
| Recent Price: 238.74 Smart Investing & Trading Score: 78 | |
| Day Percent Change: 0.43% Day Change: 1.02 | |
| Week Change: 2.96% Year-to-date Change: 15.1% | |
| CSWI Links: Profile News Message Board | |
| Charts:- Daily , Weekly | |
| Add CSWI to Watchlist: View: Get Complete CSWI Trend Analysis ➞ | |
 | HCC Warrior Met Coal, Inc. |
| Sector: Materials | |
| SubSector: Industrial Metals & Minerals | |
| MarketCap: 748.81 Millions | |
| Recent Price: 70.13 Smart Investing & Trading Score: 100 | |
| Day Percent Change: 0.83% Day Change: 0.58 | |
| Week Change: 4.61% Year-to-date Change: 15.0% | |
| HCC Links: Profile News Message Board | |
| Charts:- Daily , Weekly | |
| Add HCC to Watchlist: View: Get Complete HCC Trend Analysis ➞ | |
 | ASTE Astec Industries, Inc. |
| Sector: Industrials | |
| SubSector: Farm & Construction Machinery | |
| MarketCap: 731.607 Millions | |
| Recent Price: 42.65 Smart Investing & Trading Score: 68 | |
| Day Percent Change: 0.40% Day Change: 0.17 | |
| Week Change: -0.28% Year-to-date Change: 14.7% | |
| ASTE Links: Profile News Message Board | |
| Charts:- Daily , Weekly | |
| Add ASTE to Watchlist: View: Get Complete ASTE Trend Analysis ➞ | |
 | NODK NI Holdings, Inc. |
| Sector: Financials | |
| SubSector: Property & Casualty Insurance | |
| MarketCap: 238.112 Millions | |
| Recent Price: 14.88 Smart Investing & Trading Score: 83 | |
| Day Percent Change: -1.59% Day Change: -0.24 | |
| Week Change: -1.33% Year-to-date Change: 14.6% | |
| NODK Links: Profile News Message Board | |
| Charts:- Daily , Weekly | |
| Add NODK to Watchlist: View: Get Complete NODK Trend Analysis ➞ | |
 | STEP StepStone Group Inc. |
| Sector: Financials | |
| SubSector: Asset Management | |
| MarketCap: 30757 Millions | |
| Recent Price: 36.45 Smart Investing & Trading Score: 93 | |
| Day Percent Change: 3.02% Day Change: 1.07 | |
| Week Change: 2.92% Year-to-date Change: 14.5% | |
| STEP Links: Profile News Message Board | |
| Charts:- Daily , Weekly | |
| Add STEP to Watchlist: View: Get Complete STEP Trend Analysis ➞ | |
 | VRNT Verint Systems Inc. |
| Sector: Technology | |
| SubSector: Business Software & Services | |
| MarketCap: 2902.18 Millions | |
| Recent Price: 30.93 Smart Investing & Trading Score: 90 | |
| Day Percent Change: 2.42% Day Change: 0.73 | |
| Week Change: 6.14% Year-to-date Change: 14.4% | |
| VRNT Links: Profile News Message Board | |
| Charts:- Daily , Weekly | |
| Add VRNT to Watchlist: View: Get Complete VRNT Trend Analysis ➞ | |
 | OSG Overseas Shipholding Group, Inc. |
| Sector: Transports | |
| SubSector: Shipping | |
| MarketCap: 184.814 Millions | |
| Recent Price: 6.03 Smart Investing & Trading Score: 25 | |
| Day Percent Change: -0.50% Day Change: -0.03 | |
| Week Change: 0.84% Year-to-date Change: 14.4% | |
| OSG Links: Profile News Message Board | |
| Charts:- Daily , Weekly | |
| Add OSG to Watchlist: View: Get Complete OSG Trend Analysis ➞ | |
 | ATKR Atkore International Group Inc. |
| Sector: Industrials | |
| SubSector: Industrial Electrical Equipment | |
| MarketCap: 1086.79 Millions | |
| Recent Price: 182.99 Smart Investing & Trading Score: 75 | |
| Day Percent Change: 0.98% Day Change: 1.78 | |
| Week Change: 6.5% Year-to-date Change: 14.4% | |
| ATKR Links: Profile News Message Board | |
| Charts:- Daily , Weekly | |
| Add ATKR to Watchlist: View: Get Complete ATKR Trend Analysis ➞ | |
| Too many stocks? View smallcap stocks filtered by marketcap & sector |
| Marketcap: All SmallCap Stocks (default-no microcap), Large, Mid-Range, Small & MicroCap |
| Sector: Tech, Finance, Energy, Staples, Retail, Industrial, Materials, Utilities & Medical |
|
Best Stocks Today 12Stocks.com |
© 2024 12Stocks.com Terms & Conditions Privacy Contact Us
All Information Provided Only For Education And Not To Be Used For Investing or Trading. See Terms & Conditions


One More Thing ... Get Best Stocks Delivered Daily!
Never Ever Miss A Move With Our Top Ten Stocks Lists
Find Best Stocks In Any Market - Bull or Bear Market
Take A Peek At Our Top Ten Stocks Lists: Daily, Weekly, Year-to-Date & Top Trends
Find Best Stocks In Any Market - Bull or Bear Market
Take A Peek At Our Top Ten Stocks Lists: Daily, Weekly, Year-to-Date & Top Trends
Smallcap Stocks With Best Up Trends [0-bearish to 100-bullish]: Cullinan Oncology[100], NextNav [100], MBIA [100], Reservoir Media[100], Braemar Hotels[100], B. Riley[100], Pactiv Evergreen[100], Wolverine World[100], Haemonetics [100], Benchmark Electronics[100], Uniti Group[100]
Best Smallcap Stocks Year-to-Date:
CareMax [568.04%], Janux [341.65%], Viking [299.3%], Alpine Immune[239.21%], Longboard [222.09%], Super Micro[201.81%], Avidity Biosciences[166.81%], Arcutis Bio[161.92%], Vera [156.27%], Cullinan Oncology[147.08%], Hippo [141.6%] Best Smallcap Stocks This Week:
Matterport [170.98%], B. Riley[83.84%], Cullinan Oncology[60.86%], Seres [48.22%], Zura Bio[38.67%], Universal Logistics[36.27%], Tutor Perini[33.89%], IGM Biosciences[30.83%], Riot Blockchain[30.61%], Impinj [29.79%], Sonic Automotive[28.14%] Best Smallcap Stocks Daily:
Universal Logistics[38.80%], Zura Bio[31.90%], Cullinan Oncology[30.86%], Tutor Perini[28.01%], IGM Biosciences[23.62%], U.S. Silica[21.67%], Maxeon Solar[20.17%], Exponent [19.40%], TPI Composites[16.32%], OptimizeRx [14.84%], Solaris Oilfield[13.95%]