
 Login Sign Up


| |||||
 |  | ||||

| 12Stocks.com Market Intelligence |
Best SmallCap Stocks
|
| In a hurry? Small Cap Stock Lists: Performance Trends Table, Stock Charts
Sort Small Cap stocks: Daily, Weekly, Year-to-Date, Market Cap & Trends. Filter Small Cap stocks list by sector: Show all, Tech, Finance, Energy, Staples, Retail, Industrial, Materials, Utilities and HealthCare Filter Small Cap stocks list by size: All Large Medium Small and MicroCap |
| 12Stocks.com Small Cap Stocks Performances & Trends Daily | |||||||||
|
|  The overall Smart Investing & Trading Score is 69 (0-bearish to 100-bullish) which puts Small Cap index in short term neutral to bullish trend. The Smart Investing & Trading Score from previous trading session is 49 and hence an improvement of trend.
| ||||||||
Here are the Smart Investing & Trading Scores of the most requested small cap stocks at 12Stocks.com (click stock name for detailed review):
|


| 12Stocks.com: Investing in Smallcap Index with Stocks | |
|
The following table helps investors and traders sort through current performance and trends (as measured by Smart Investing & Trading Score) of various
stocks in the Smallcap Index. Quick View: Move mouse or cursor over stock symbol (ticker) to view short-term technical chart and over stock name to view long term chart. Click on  to add stock symbol to your watchlist and to add stock symbol to your watchlist and  to view watchlist. Click on any ticker or stock name for detailed market intelligence report for that stock. to view watchlist. Click on any ticker or stock name for detailed market intelligence report for that stock. |
12Stocks.com Performance of Stocks in Smallcap Index
| Ticker | Stock Name | Watchlist | Category | Recent Price | Smart Investing & Trading Score | Change % | YTD Change% |
| DNLI | Denali |   | Health Care | 17.14 | 59 | 1.96% | -20.13% |
| PRLB | Proto Labs | | Industrials | 31.09 | 42 | -0.16% | -20.20% |
| ARVN | Arvinas | | Health Care | 32.82 | 32 | 1.20% | -20.26% |
| CRGY | Crescent Energy | | Energy | 10.49 | 17 | 0.19% | -20.47% |
| AMN | AMN Healthcare | | Industrials | 59.53 | 75 | -1.13% | -20.50% |
| UVV | Universal | | Consumer Staples | 53.39 | 100 | 1.04% | -20.69% |
| IBTX | Independent Bank | | Financials | 40.31 | 60 | 3.81% | -20.77% |
| RPD | Rapid7 | | Technology | 45.21 | 35 | 1.14% | -20.82% |
| SYNA | Synaptics | | Technology | 90.31 | 42 | 0.76% | -20.84% |
| ENVX | Enovix | | Industrials | 9.96 | 100 | 16.62% | -20.85% |
| INDB | Independent Bank | | Financials | 51.92 | 87 | 1.15% | -21.11% |
| CFFN | Capitol Federal | | Financials | 5.07 | 42 | -0.39% | -21.40% |
| TMP | Tompkins Financial | | Financials | 47.32 | 74 | 1.05% | -21.43% |
| CSGS | CSG Systems | | Technology | 41.70 | 0 | -0.81% | -21.63% |
| BRZE | Braze | | Technology | 41.71 | 49 | 2.29% | -21.66% |
| TDS | Telephone and | | Technology | 14.36 | 0 | -11.41% | -21.74% |
| GOCO | GoHealth | | Financials | 10.27 | 47 | -0.53% | -21.82% |
| PRVA | Privia Health | | Health Care | 18.46 | 52 | 1.07% | -21.88% |
| AMBA | Ambarella | | Technology | 47.85 | 74 | 2.05% | -21.93% |
| PZZA | Papa John | | Services & Goods | 58.98 | 0 | -1.27% | -22.63% |
| GSHD | Goosehead Insurance | | Financials | 58.63 | 45 | -0.71% | -22.65% |
| AMPL | Amplitude | | Technology | 9.86 | 42 | 1.34% | -22.73% |
| PLRX | Pliant | | Health Care | 13.98 | 59 | 5.51% | -22.85% |
| ZNTL | Zentalis | | Health Care | 11.69 | 42 | 5.22% | -22.89% |
| LUNG | Pulmonx | | Health Care | 9.82 | 95 | 4.69% | -22.98% |
| For chart view version of above stock list: Chart View ➞ 0 - 25 , 25 - 50 , 50 - 75 , 75 - 100 , 100 - 125 , 125 - 150 , 150 - 175 , 175 - 200 , 200 - 225 , 225 - 250 , 250 - 275 , 275 - 300 , 300 - 325 , 325 - 350 , 350 - 375 , 375 - 400 , 400 - 425 , 425 - 450 , 450 - 475 , 475 - 500 , 500 - 525 , 525 - 550 , 550 - 575 , 575 - 600 , 600 - 625 , 625 - 650 , 650 - 675 , 675 - 700 | ||
 | Click To Change The Sort Order: By Market Cap or Company Size Performance: Year-to-date, Week and Day |  |
| Too many stocks? View smallcap stocks filtered by marketcap & sector |
| Marketcap: All SmallCap Stocks (default-no microcap), Large, Mid-Range, Small |
| Smallcap Sector: Tech, Finance, Energy, Staples, Retail, Industrial, Materials, & Medical |
|
Get the most comprehensive stock market coverage daily at 12Stocks.com ➞ Best Stocks Today ➞ Best Stocks Weekly ➞ Best Stocks Year-to-Date ➞ Best Stocks Trends ➞  Best Stocks Today 12Stocks.com Best Nasdaq Stocks ➞ Best S&P 500 Stocks ➞ Best Tech Stocks ➞ Best Biotech Stocks ➞ |
| Detailed Overview of SmallCap Stocks |
| SmallCap Technical Overview, Leaders & Laggards, Top SmallCap ETF Funds & Detailed SmallCap Stocks List, Charts, Trends & More |
| Smallcap: Technical Analysis, Trends & YTD Performance | |
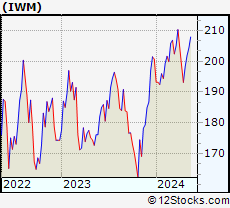
| SmallCap segment as represented by
IWM, an exchange-traded fund [ETF], holds basket of thousands of smallcap stocks from across all major sectors of the US stock market. The smallcap index (contains stocks like Riverbed & Sotheby's) is up by 0.59% and is currently underperforming the overall market by -6.29% year-to-date. Below is a quick view of technical charts and trends: | |
 IWM Weekly Chart |
|
| Long Term Trend: Not Good | |
| Medium Term Trend: Very Good | |
 IWM Daily Chart |
|
| Short Term Trend: Very Good | |
| Overall Trend Score: 69 | |
| YTD Performance: 0.59% | |
| **Trend Scores & Views Are Only For Educational Purposes And Not For Investing | |
| 12Stocks.com: Top Performing Small Cap Index Stocks | ||||||||||||||||||||||||||||||||||||||||||||||||
 The top performing Small Cap Index stocks year to date are
Now, more recently, over last week, the top performing Small Cap Index stocks on the move are


|
||||||||||||||||||||||||||||||||||||||||||||||||
| 12Stocks.com: Investing in Smallcap Index using Exchange Traded Funds | |
|
The following table shows list of key exchange traded funds (ETF) that
help investors track Smallcap index. The following list also includes leveraged ETF funds that track twice or thrice the daily returns of Smallcap indices. Short or inverse ETF funds move in the opposite direction to the index they track and are useful during market pullbacks or during bear markets. Quick View: Move mouse or cursor over ETF symbol (ticker) to view short-term technical chart and over ETF name to view long term chart. Click on ticker or stock name for detailed view. Click on to add stock symbol to your watchlist and to view watchlist. |
12Stocks.com List of ETFs that track Smallcap Index
| Ticker | ETF Name | Watchlist | Recent Price | Smart Investing & Trading Score | Change % | Week % | Year-to-date % |
| IWM | iShares Russell 2000 | | 201.90 | 69 | 0.99 | 1.77 | 0.59% |
| IJR | iShares Core S&P Small-Cap | | 107.13 | 82 | 0.75 | 1.4 | -1.03% |
| VTWO | Vanguard Russell 2000 ETF | | 81.61 | 69 | 0.94 | 1.73 | 0.63% |
| IWN | iShares Russell 2000 Value | | 154.21 | 100 | 0.87 | 2.03 | -0.72% |
| IJS | iShares S&P Small-Cap 600 Value | | 98.72 | 64 | 0.71 | 1.57 | -4.22% |
| IWO | iShares Russell 2000 Growth | | 256.87 | 57 | 0.99 | 1.49 | 1.84% |
| IJT | iShares S&P Small-Cap 600 Growth | | 127.76 | 95 | 0.82 | 1.32 | 2.09% |
| XSLV | PowerShares S&P SmallCap Low Volatil ETF | | 43.22 | 87 | 0.19 | 1.17 | -2.11% |
| SBB | ProShares Short SmallCap600 | | 16.16 | 13 | -1.28 | -1.37 | 1.44% |
| SDD | ProShares UltraShort SmallCap600 | | 18.84 | 23 | -2.41 | -2.61 | 2.27% |
| SAA | ProShares Ultra SmallCap600 | | 23.59 | 69 | 2.86 | 2.39 | -5.45% |
| SMLV | SPDR SSGA US Small Cap Low Volatil ETF | | 109.69 | 87 | 0.78 | 2.01 | -2.52% |
| 12Stocks.com: Charts, Trends, Fundamental Data and Performances of SmallCap Stocks | |
|
We now take in-depth look at all SmallCap stocks including charts, multi-period performances and overall trends (as measured by Smart Investing & Trading Score). One can sort SmallCap stocks (click link to choose) by Daily, Weekly and by Year-to-Date performances. Also, one can sort by size of the company or by market capitalization. |
| Select Your Default Chart Type: | |||||
| |||||
| Click on stock symbol or name for detailed view. Click on to add stock symbol to your watchlist and to view watchlist. Quick View: Move mouse or cursor over "Daily" to quickly view daily technical stock chart and over "Weekly" to view weekly technical stock chart. | |||||

 | DNLI Denali Therapeutics Inc. |
| Sector: Health Care | |
| SubSector: Biotechnology | |
| MarketCap: 2020.05 Millions | |
| Recent Price: 17.14 Smart Investing & Trading Score: 59 | |
| Day Percent Change: 1.96% Day Change: 0.33 | |
| Week Change: 11.08% Year-to-date Change: -20.1% | |
| DNLI Links: Profile News Message Board | |
| Charts:- Daily , Weekly | |
| Add DNLI to Watchlist: View: Get Complete DNLI Trend Analysis ➞ | |
 | PRLB Proto Labs, Inc. |
| Sector: Industrials | |
| SubSector: Machine Tools & Accessories | |
| MarketCap: 1944.78 Millions | |
| Recent Price: 31.09 Smart Investing & Trading Score: 42 | |
| Day Percent Change: -0.16% Day Change: -0.05 | |
| Week Change: -0.89% Year-to-date Change: -20.2% | |
| PRLB Links: Profile News Message Board | |
| Charts:- Daily , Weekly | |
| Add PRLB to Watchlist: View: Get Complete PRLB Trend Analysis ➞ | |
 | ARVN Arvinas, Inc. |
| Sector: Health Care | |
| SubSector: Biotechnology | |
| MarketCap: 3469.85 Millions | |
| Recent Price: 32.82 Smart Investing & Trading Score: 32 | |
| Day Percent Change: 1.20% Day Change: 0.39 | |
| Week Change: 1.39% Year-to-date Change: -20.3% | |
| ARVN Links: Profile News Message Board | |
| Charts:- Daily , Weekly | |
| Add ARVN to Watchlist: View: Get Complete ARVN Trend Analysis ➞ | |
 | CRGY Crescent Energy Company |
| Sector: Energy | |
| SubSector: Oil & Gas E&P | |
| MarketCap: 1700 Millions | |
| Recent Price: 10.49 Smart Investing & Trading Score: 17 | |
| Day Percent Change: 0.19% Day Change: 0.02 | |
| Week Change: -3.14% Year-to-date Change: -20.5% | |
| CRGY Links: Profile News Message Board | |
| Charts:- Daily , Weekly | |
| Add CRGY to Watchlist: View: Get Complete CRGY Trend Analysis ➞ | |
 | AMN AMN Healthcare Services, Inc. |
| Sector: Industrials | |
| SubSector: General Building Materials | |
| MarketCap: 3064.03 Millions | |
| Recent Price: 59.53 Smart Investing & Trading Score: 75 | |
| Day Percent Change: -1.13% Day Change: -0.68 | |
| Week Change: 4.22% Year-to-date Change: -20.5% | |
| AMN Links: Profile News Message Board | |
| Charts:- Daily , Weekly | |
| Add AMN to Watchlist: View: Get Complete AMN Trend Analysis ➞ | |
 | UVV Universal Corporation |
| Sector: Consumer Staples | |
| SubSector: Tobacco Products, Other | |
| MarketCap: 1107.7 Millions | |
| Recent Price: 53.39 Smart Investing & Trading Score: 100 | |
| Day Percent Change: 1.04% Day Change: 0.55 | |
| Week Change: 5.1% Year-to-date Change: -20.7% | |
| UVV Links: Profile News Message Board | |
| Charts:- Daily , Weekly | |
| Add UVV to Watchlist: View: Get Complete UVV Trend Analysis ➞ | |
 | IBTX Independent Bank Group, Inc. |
| Sector: Financials | |
| SubSector: Regional - Southeast Banks | |
| MarketCap: 1133.35 Millions | |
| Recent Price: 40.31 Smart Investing & Trading Score: 60 | |
| Day Percent Change: 3.81% Day Change: 1.48 | |
| Week Change: 2.47% Year-to-date Change: -20.8% | |
| IBTX Links: Profile News Message Board | |
| Charts:- Daily , Weekly | |
| Add IBTX to Watchlist: View: Get Complete IBTX Trend Analysis ➞ | |
 | RPD Rapid7, Inc. |
| Sector: Technology | |
| SubSector: Application Software | |
| MarketCap: 1981.12 Millions | |
| Recent Price: 45.21 Smart Investing & Trading Score: 35 | |
| Day Percent Change: 1.14% Day Change: 0.51 | |
| Week Change: -1.57% Year-to-date Change: -20.8% | |
| RPD Links: Profile News Message Board | |
| Charts:- Daily , Weekly | |
| Add RPD to Watchlist: View: Get Complete RPD Trend Analysis ➞ | |
 | SYNA Synaptics Incorporated |
| Sector: Technology | |
| SubSector: Application Software | |
| MarketCap: 1822.82 Millions | |
| Recent Price: 90.31 Smart Investing & Trading Score: 42 | |
| Day Percent Change: 0.76% Day Change: 0.68 | |
| Week Change: 1.18% Year-to-date Change: -20.8% | |
| SYNA Links: Profile News Message Board | |
| Charts:- Daily , Weekly | |
| Add SYNA to Watchlist: View: Get Complete SYNA Trend Analysis ➞ | |
 | ENVX Enovix Corporation |
| Sector: Industrials | |
| SubSector: Electrical Equipment & Parts | |
| MarketCap: 2740 Millions | |
| Recent Price: 9.96 Smart Investing & Trading Score: 100 | |
| Day Percent Change: 16.62% Day Change: 1.42 | |
| Week Change: 54.02% Year-to-date Change: -20.9% | |
| ENVX Links: Profile News Message Board | |
| Charts:- Daily , Weekly | |
| Add ENVX to Watchlist: View: Get Complete ENVX Trend Analysis ➞ | |
 | INDB Independent Bank Corp. |
| Sector: Financials | |
| SubSector: Regional - Northeast Banks | |
| MarketCap: 2347.09 Millions | |
| Recent Price: 51.92 Smart Investing & Trading Score: 87 | |
| Day Percent Change: 1.15% Day Change: 0.59 | |
| Week Change: -1.54% Year-to-date Change: -21.1% | |
| INDB Links: Profile News Message Board | |
| Charts:- Daily , Weekly | |
| Add INDB to Watchlist: View: Get Complete INDB Trend Analysis ➞ | |
 | CFFN Capitol Federal Financial, Inc. |
| Sector: Financials | |
| SubSector: Savings & Loans | |
| MarketCap: 1639.1 Millions | |
| Recent Price: 5.07 Smart Investing & Trading Score: 42 | |
| Day Percent Change: -0.39% Day Change: -0.02 | |
| Week Change: 5.41% Year-to-date Change: -21.4% | |
| CFFN Links: Profile News Message Board | |
| Charts:- Daily , Weekly | |
| Add CFFN to Watchlist: View: Get Complete CFFN Trend Analysis ➞ | |
 | TMP Tompkins Financial Corporation |
| Sector: Financials | |
| SubSector: Regional - Northeast Banks | |
| MarketCap: 1144.79 Millions | |
| Recent Price: 47.32 Smart Investing & Trading Score: 74 | |
| Day Percent Change: 1.05% Day Change: 0.49 | |
| Week Change: 2.14% Year-to-date Change: -21.4% | |
| TMP Links: Profile News Message Board | |
| Charts:- Daily , Weekly | |
| Add TMP to Watchlist: View: Get Complete TMP Trend Analysis ➞ | |
 | CSGS CSG Systems International, Inc. |
| Sector: Technology | |
| SubSector: Business Software & Services | |
| MarketCap: 1336.78 Millions | |
| Recent Price: 41.70 Smart Investing & Trading Score: 0 | |
| Day Percent Change: -0.81% Day Change: -0.34 | |
| Week Change: -13.23% Year-to-date Change: -21.6% | |
| CSGS Links: Profile News Message Board | |
| Charts:- Daily , Weekly | |
| Add CSGS to Watchlist: View: Get Complete CSGS Trend Analysis ➞ | |
 | BRZE Braze, Inc. |
| Sector: Technology | |
| SubSector: Software - Application | |
| MarketCap: 4340 Millions | |
| Recent Price: 41.71 Smart Investing & Trading Score: 49 | |
| Day Percent Change: 2.29% Day Change: 0.94 | |
| Week Change: -0.02% Year-to-date Change: -21.7% | |
| BRZE Links: Profile News Message Board | |
| Charts:- Daily , Weekly | |
| Add BRZE to Watchlist: View: Get Complete BRZE Trend Analysis ➞ | |
 | TDS Telephone and Data Systems, Inc. |
| Sector: Technology | |
| SubSector: Wireless Communications | |
| MarketCap: 1851.87 Millions | |
| Recent Price: 14.36 Smart Investing & Trading Score: 0 | |
| Day Percent Change: -11.41% Day Change: -1.85 | |
| Week Change: -9% Year-to-date Change: -21.7% | |
| TDS Links: Profile News Message Board | |
| Charts:- Daily , Weekly | |
| Add TDS to Watchlist: View: Get Complete TDS Trend Analysis ➞ | |
 | GOCO GoHealth, Inc. |
| Sector: Financials | |
| SubSector: Insurance Brokers | |
| MarketCap: 44157 Millions | |
| Recent Price: 10.27 Smart Investing & Trading Score: 47 | |
| Day Percent Change: -0.53% Day Change: -0.05 | |
| Week Change: 1.13% Year-to-date Change: -21.8% | |
| GOCO Links: Profile News Message Board | |
| Charts:- Daily , Weekly | |
| Add GOCO to Watchlist: View: Get Complete GOCO Trend Analysis ➞ | |
 | PRVA Privia Health Group, Inc. |
| Sector: Health Care | |
| SubSector: Health Information Services | |
| MarketCap: 3130 Millions | |
| Recent Price: 18.46 Smart Investing & Trading Score: 52 | |
| Day Percent Change: 1.07% Day Change: 0.20 | |
| Week Change: 1.04% Year-to-date Change: -21.9% | |
| PRVA Links: Profile News Message Board | |
| Charts:- Daily , Weekly | |
| Add PRVA to Watchlist: View: Get Complete PRVA Trend Analysis ➞ | |
 | AMBA Ambarella, Inc. |
| Sector: Technology | |
| SubSector: Semiconductor Equipment & Materials | |
| MarketCap: 1509.38 Millions | |
| Recent Price: 47.85 Smart Investing & Trading Score: 74 | |
| Day Percent Change: 2.05% Day Change: 0.96 | |
| Week Change: 11.05% Year-to-date Change: -21.9% | |
| AMBA Links: Profile News Message Board | |
| Charts:- Daily , Weekly | |
| Add AMBA to Watchlist: View: Get Complete AMBA Trend Analysis ➞ | |
 | PZZA Papa John s International, Inc. |
| Sector: Services & Goods | |
| SubSector: Specialty Eateries | |
| MarketCap: 1925.27 Millions | |
| Recent Price: 58.98 Smart Investing & Trading Score: 0 | |
| Day Percent Change: -1.27% Day Change: -0.76 | |
| Week Change: -6.53% Year-to-date Change: -22.6% | |
| PZZA Links: Profile News Message Board | |
| Charts:- Daily , Weekly | |
| Add PZZA to Watchlist: View: Get Complete PZZA Trend Analysis ➞ | |
 | GSHD Goosehead Insurance, Inc |
| Sector: Financials | |
| SubSector: Insurance Brokers | |
| MarketCap: 1863.57 Millions | |
| Recent Price: 58.63 Smart Investing & Trading Score: 45 | |
| Day Percent Change: -0.71% Day Change: -0.42 | |
| Week Change: 5.64% Year-to-date Change: -22.7% | |
| GSHD Links: Profile News Message Board | |
| Charts:- Daily , Weekly | |
| Add GSHD to Watchlist: View: Get Complete GSHD Trend Analysis ➞ | |
 | AMPL Amplitude, Inc. |
| Sector: Technology | |
| SubSector: Software - Application | |
| MarketCap: 1320 Millions | |
| Recent Price: 9.86 Smart Investing & Trading Score: 42 | |
| Day Percent Change: 1.34% Day Change: 0.13 | |
| Week Change: -0.6% Year-to-date Change: -22.7% | |
| AMPL Links: Profile News Message Board | |
| Charts:- Daily , Weekly | |
| Add AMPL to Watchlist: View: Get Complete AMPL Trend Analysis ➞ | |
 | PLRX Pliant Therapeutics, Inc. |
| Sector: Health Care | |
| SubSector: Biotechnology | |
| MarketCap: 96487 Millions | |
| Recent Price: 13.98 Smart Investing & Trading Score: 59 | |
| Day Percent Change: 5.51% Day Change: 0.73 | |
| Week Change: 18.37% Year-to-date Change: -22.9% | |
| PLRX Links: Profile News Message Board | |
| Charts:- Daily , Weekly | |
| Add PLRX to Watchlist: View: Get Complete PLRX Trend Analysis ➞ | |
 | ZNTL Zentalis Pharmaceuticals, Inc. |
| Sector: Health Care | |
| SubSector: Biotechnology | |
| MarketCap: 22187 Millions | |
| Recent Price: 11.69 Smart Investing & Trading Score: 42 | |
| Day Percent Change: 5.22% Day Change: 0.58 | |
| Week Change: 5.7% Year-to-date Change: -22.9% | |
| ZNTL Links: Profile News Message Board | |
| Charts:- Daily , Weekly | |
| Add ZNTL to Watchlist: View: Get Complete ZNTL Trend Analysis ➞ | |
 | LUNG Pulmonx Corporation |
| Sector: Health Care | |
| SubSector: Medical Devices | |
| MarketCap: 18187 Millions | |
| Recent Price: 9.82 Smart Investing & Trading Score: 95 | |
| Day Percent Change: 4.69% Day Change: 0.44 | |
| Week Change: 34.89% Year-to-date Change: -23.0% | |
| LUNG Links: Profile News Message Board | |
| Charts:- Daily , Weekly | |
| Add LUNG to Watchlist: View: Get Complete LUNG Trend Analysis ➞ | |
| For tabular summary view of above stock list: Summary View ➞ 0 - 25 , 25 - 50 , 50 - 75 , 75 - 100 , 100 - 125 , 125 - 150 , 150 - 175 , 175 - 200 , 200 - 225 , 225 - 250 , 250 - 275 , 275 - 300 , 300 - 325 , 325 - 350 , 350 - 375 , 375 - 400 , 400 - 425 , 425 - 450 , 450 - 475 , 475 - 500 , 500 - 525 , 525 - 550 , 550 - 575 , 575 - 600 , 600 - 625 , 625 - 650 , 650 - 675 , 675 - 700 | ||
| Click To Change The Sort Order: By Market Cap or Company Size Performance: Year-to-date, Week and Day | |
| Select Chart Type: | ||
| Too many stocks? View smallcap stocks filtered by marketcap & sector |
| Marketcap: All SmallCap Stocks (default-no microcap), Large, Mid-Range, Small & MicroCap |
| Sector: Tech, Finance, Energy, Staples, Retail, Industrial, Materials, Utilities & Medical |
|
Best Stocks Today 12Stocks.com |
© 2024 12Stocks.com Terms & Conditions Privacy Contact Us
All Information Provided Only For Education And Not To Be Used For Investing or Trading. See Terms & Conditions


One More Thing ... Get Best Stocks Delivered Daily!
Never Ever Miss A Move With Our Top Ten Stocks Lists
Find Best Stocks In Any Market - Bull or Bear Market
Take A Peek At Our Top Ten Stocks Lists: Daily, Weekly, Year-to-Date & Top Trends
Find Best Stocks In Any Market - Bull or Bear Market
Take A Peek At Our Top Ten Stocks Lists: Daily, Weekly, Year-to-Date & Top Trends
Smallcap Stocks With Best Up Trends [0-bearish to 100-bullish]: Twist Bioscience[100], WideOpenWest [100], Joint [100], FTC Solar[100], Origin Materials[100], Alignment Healthcare[100], Clarus [100], IES [100], Emergent BioSolutions[100], Enovix [100], El Pollo[100]
Best Smallcap Stocks Year-to-Date:
Janux [482.74%], Viking [313.59%], Longboard [272.5%], Alpine Immune[239.29%], Bakkt [199.55%], Avidity Biosciences[192.48%], Vera [189.47%], Cullinan Oncology[176.9%], Super Micro[175.35%], Y-mAbs [151.47%], Sana [149.33%] Best Smallcap Stocks This Week:
Emergent BioSolutions[102.6%], Deciphera [73.24%], Origin Materials[66.52%], Eyenovia [60.78%], Cue Biopharma[56.04%], Aspen Aerogels[55.96%], Enovix [54.02%], Luna Innovations[53.77%], Codexis [47.37%], Carvana Co[44.31%], Office Properties[42.79%] Best Smallcap Stocks Daily:
Luna Innovations[36.00%], Twist Bioscience[28.74%], Ardelyx [28.42%], WideOpenWest [28.23%], 2U [26.63%], Joint [25.35%], FTC Solar[25.09%], Origin Materials[22.23%], Alignment Healthcare[21.97%], Clarus [18.67%], Aurora Innovation[18.09%]