
 Login Sign Up


| |||||
 |  | ||||

| 12Stocks.com Market Intelligence |
Best SmallCap Stocks
|
| In a hurry? Small Cap Stock Lists: Performance Trends Table, Stock Charts
Sort Small Cap stocks: Daily, Weekly, Year-to-Date, Market Cap & Trends. Filter Small Cap stocks list by sector: Show all, Tech, Finance, Energy, Staples, Retail, Industrial, Materials, Utilities and HealthCare Filter Small Cap stocks list by size: All Large Medium Small and MicroCap |
| 12Stocks.com Small Cap Stocks Performances & Trends Daily | |||||||||
|
|  The overall Smart Investing & Trading Score is 69 (0-bearish to 100-bullish) which puts Small Cap index in short term neutral to bullish trend. The Smart Investing & Trading Score from previous trading session is 49 and hence an improvement of trend.
| ||||||||
Here are the Smart Investing & Trading Scores of the most requested small cap stocks at 12Stocks.com (click stock name for detailed review):
|


| 12Stocks.com: Investing in Smallcap Index with Stocks | |
|
The following table helps investors and traders sort through current performance and trends (as measured by Smart Investing & Trading Score) of various
stocks in the Smallcap Index. Quick View: Move mouse or cursor over stock symbol (ticker) to view short-term technical chart and over stock name to view long term chart. Click on  to add stock symbol to your watchlist and to add stock symbol to your watchlist and  to view watchlist. Click on any ticker or stock name for detailed market intelligence report for that stock. to view watchlist. Click on any ticker or stock name for detailed market intelligence report for that stock. |
12Stocks.com Performance of Stocks in Smallcap Index
| Ticker | Stock Name | Watchlist | Category | Recent Price | Smart Investing & Trading Score | Change % | YTD Change% |
| RNA | Avidity Biosciences |   | Health Care | 26.44 | 90 | 3.36% | 192.48% |
| SMCI | Super Micro | | Technology | 782.70 | 24 | 2.65% | 175.35% |
| SANA | Sana | | Health Care | 10.31 | 95 | 8.99% | 149.33% |
| ARQT | Arcutis Bio | | Health Care | 8.00 | 20 | -6.98% | 147.68% |
| CVNA | Carvana Co | | Services & Goods | 121.67 | 100 | 4.44% | 129.83% |
| SOUN | SoundHound AI | | Technology | 4.35 | 35 | -4.71% | 103.27% |
| MAX | MediaAlpha | | Technology | 22.20 | 93 | 0.54% | 99.64% |
| VTYX | Ventyx Biosciences | | Health Care | 4.93 | 69 | 1.23% | 99.19% |
| OSCR | Oscar Health | | Health Care | 17.98 | 85 | 1.30% | 97.47% |
| DYN | Dyne | | Health Care | 26.08 | 34 | 0.31% | 96.09% |
| SG | Sweetgreen | | Services & Goods | 22.10 | 53 | 3.56% | 95.58% |
| MSTR | MicroStrategy | | Technology | 1223.01 | 63 | 8.29% | 93.63% |
| GBIO | Generation Bio | | Health Care | 3.18 | 68 | 2.25% | 92.73% |
| SMR | NuScale Power | | Industrials | 6.05 | 83 | 1.26% | 87.60% |
| TARS | Tarsus | | Health Care | 36.89 | 69 | 6.53% | 81.90% |
| VITL | Vital Farms | | Consumer Staples | 28.12 | 95 | -0.32% | 79.11% |
| SMTC | Semtech | | Technology | 39.01 | 100 | 0.85% | 78.05% |
| IOVA | Iovance Bio | | Health Care | 13.63 | 69 | 5.82% | 67.65% |
| TREE | LendingTree | | Financials | 49.41 | 95 | 0.16% | 62.96% |
| EBS | Emergent BioSolutions | | Health Care | 3.89 | 100 | 17.88% | 62.08% |
| DCPH | Deciphera | | Health Care | 25.38 | 88 | 0.00% | 57.35% |
| DOOR | Masonite | | Industrials | 132.70 | 78 | 0.00% | 56.74% |
| AGIO | Agios | | Health Care | 34.54 | 95 | -0.12% | 55.10% |
| HRTX | Heron | | Health Care | 2.61 | 32 | 2.35% | 53.53% |
| FIX | Comfort Systems | | Industrials | 315.03 | 85 | 2.38% | 53.17% |
| For chart view version of above stock list: Chart View ➞ 0 - 25 , 25 - 50 , 50 - 75 , 75 - 100 , 100 - 125 , 125 - 150 , 150 - 175 , 175 - 200 , 200 - 225 , 225 - 250 , 250 - 275 , 275 - 300 , 300 - 325 , 325 - 350 , 350 - 375 , 375 - 400 , 400 - 425 , 425 - 450 , 450 - 475 , 475 - 500 , 500 - 525 , 525 - 550 , 550 - 575 , 575 - 600 , 600 - 625 , 625 - 650 , 650 - 675 , 675 - 700 | ||
 | Click To Change The Sort Order: By Market Cap or Company Size Performance: Year-to-date, Week and Day |  |
| Too many stocks? View smallcap stocks filtered by marketcap & sector |
| Marketcap: All SmallCap Stocks (default-no microcap), Large, Mid-Range, Small |
| Smallcap Sector: Tech, Finance, Energy, Staples, Retail, Industrial, Materials, & Medical |
|
Get the most comprehensive stock market coverage daily at 12Stocks.com ➞ Best Stocks Today ➞ Best Stocks Weekly ➞ Best Stocks Year-to-Date ➞ Best Stocks Trends ➞  Best Stocks Today 12Stocks.com Best Nasdaq Stocks ➞ Best S&P 500 Stocks ➞ Best Tech Stocks ➞ Best Biotech Stocks ➞ |
| Detailed Overview of SmallCap Stocks |
| SmallCap Technical Overview, Leaders & Laggards, Top SmallCap ETF Funds & Detailed SmallCap Stocks List, Charts, Trends & More |
| Smallcap: Technical Analysis, Trends & YTD Performance | |
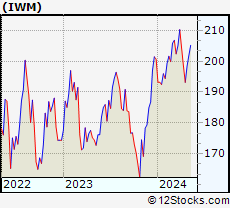
| SmallCap segment as represented by
IWM, an exchange-traded fund [ETF], holds basket of thousands of smallcap stocks from across all major sectors of the US stock market. The smallcap index (contains stocks like Riverbed & Sotheby's) is up by 0.59% and is currently underperforming the overall market by -6.29% year-to-date. Below is a quick view of technical charts and trends: | |
 IWM Weekly Chart |
|
| Long Term Trend: Not Good | |
| Medium Term Trend: Very Good | |
 IWM Daily Chart |
|
| Short Term Trend: Very Good | |
| Overall Trend Score: 69 | |
| YTD Performance: 0.59% | |
| **Trend Scores & Views Are Only For Educational Purposes And Not For Investing | |
| 12Stocks.com: Top Performing Small Cap Index Stocks | ||||||||||||||||||||||||||||||||||||||||||||||||
 The top performing Small Cap Index stocks year to date are
Now, more recently, over last week, the top performing Small Cap Index stocks on the move are


|
||||||||||||||||||||||||||||||||||||||||||||||||
| 12Stocks.com: Investing in Smallcap Index using Exchange Traded Funds | |
|
The following table shows list of key exchange traded funds (ETF) that
help investors track Smallcap index. The following list also includes leveraged ETF funds that track twice or thrice the daily returns of Smallcap indices. Short or inverse ETF funds move in the opposite direction to the index they track and are useful during market pullbacks or during bear markets. Quick View: Move mouse or cursor over ETF symbol (ticker) to view short-term technical chart and over ETF name to view long term chart. Click on ticker or stock name for detailed view. Click on to add stock symbol to your watchlist and to view watchlist. |
12Stocks.com List of ETFs that track Smallcap Index
| Ticker | ETF Name | Watchlist | Recent Price | Smart Investing & Trading Score | Change % | Week % | Year-to-date % |
| IWM | iShares Russell 2000 | | 201.90 | 69 | 0.99 | 1.77 | 0.59% |
| IJR | iShares Core S&P Small-Cap | | 107.13 | 82 | 0.75 | 1.4 | -1.03% |
| VTWO | Vanguard Russell 2000 ETF | | 81.61 | 69 | 0.94 | 1.73 | 0.63% |
| IWN | iShares Russell 2000 Value | | 154.21 | 100 | 0.87 | 2.03 | -0.72% |
| IJS | iShares S&P Small-Cap 600 Value | | 98.72 | 64 | 0.71 | 1.57 | -4.22% |
| IWO | iShares Russell 2000 Growth | | 256.87 | 57 | 0.99 | 1.49 | 1.84% |
| IJT | iShares S&P Small-Cap 600 Growth | | 127.76 | 95 | 0.82 | 1.32 | 2.09% |
| XSLV | PowerShares S&P SmallCap Low Volatil ETF | | 43.22 | 87 | 0.19 | 1.17 | -2.11% |
| SBB | ProShares Short SmallCap600 | | 16.16 | 13 | -1.28 | -1.37 | 1.44% |
| SDD | ProShares UltraShort SmallCap600 | | 18.84 | 23 | -2.41 | -2.61 | 2.27% |
| SAA | ProShares Ultra SmallCap600 | | 23.59 | 69 | 2.86 | 2.39 | -5.45% |
| SMLV | SPDR SSGA US Small Cap Low Volatil ETF | | 109.69 | 87 | 0.78 | 2.01 | -2.52% |
| 12Stocks.com: Charts, Trends, Fundamental Data and Performances of SmallCap Stocks | |
|
We now take in-depth look at all SmallCap stocks including charts, multi-period performances and overall trends (as measured by Smart Investing & Trading Score). One can sort SmallCap stocks (click link to choose) by Daily, Weekly and by Year-to-Date performances. Also, one can sort by size of the company or by market capitalization. |
| Select Your Default Chart Type: | |||||
| |||||
| Click on stock symbol or name for detailed view. Click on to add stock symbol to your watchlist and to view watchlist. Quick View: Move mouse or cursor over "Daily" to quickly view daily technical stock chart and over "Weekly" to view weekly technical stock chart. | |||||

 | RNA Avidity Biosciences, Inc. |
| Sector: Health Care | |
| SubSector: Biotechnology | |
| MarketCap: 12287 Millions | |
| Recent Price: 26.44 Smart Investing & Trading Score: 90 | |
| Day Percent Change: 3.36% Day Change: 0.86 | |
| Week Change: 8.54% Year-to-date Change: 192.5% | |
| RNA Links: Profile News Message Board | |
| Charts:- Daily , Weekly | |
| Add RNA to Watchlist: View: Get Complete RNA Trend Analysis ➞ | |
 | SMCI Super Micro Computer, Inc. |
| Sector: Technology | |
| SubSector: Networking & Communication Devices | |
| MarketCap: 1200.02 Millions | |
| Recent Price: 782.70 Smart Investing & Trading Score: 24 | |
| Day Percent Change: 2.65% Day Change: 20.18 | |
| Week Change: -8.72% Year-to-date Change: 175.4% | |
| SMCI Links: Profile News Message Board | |
| Charts:- Daily , Weekly | |
| Add SMCI to Watchlist: View: Get Complete SMCI Trend Analysis ➞ | |
 | SANA Sana Biotechnology, Inc. |
| Sector: Health Care | |
| SubSector: Biotechnology | |
| MarketCap: 1210 Millions | |
| Recent Price: 10.31 Smart Investing & Trading Score: 95 | |
| Day Percent Change: 8.99% Day Change: 0.85 | |
| Week Change: 18.37% Year-to-date Change: 149.3% | |
| SANA Links: Profile News Message Board | |
| Charts:- Daily , Weekly | |
| Add SANA to Watchlist: View: Get Complete SANA Trend Analysis ➞ | |
 | ARQT Arcutis Biotherapeutics, Inc. |
| Sector: Health Care | |
| SubSector: Biotechnology | |
| MarketCap: 12787 Millions | |
| Recent Price: 8.00 Smart Investing & Trading Score: 20 | |
| Day Percent Change: -6.98% Day Change: -0.60 | |
| Week Change: -5.55% Year-to-date Change: 147.7% | |
| ARQT Links: Profile News Message Board | |
| Charts:- Daily , Weekly | |
| Add ARQT to Watchlist: View: Get Complete ARQT Trend Analysis ➞ | |
 | CVNA Carvana Co. |
| Sector: Services & Goods | |
| SubSector: Auto Dealerships | |
| MarketCap: 5585.31 Millions | |
| Recent Price: 121.67 Smart Investing & Trading Score: 100 | |
| Day Percent Change: 4.44% Day Change: 5.17 | |
| Week Change: 44.31% Year-to-date Change: 129.8% | |
| CVNA Links: Profile News Message Board | |
| Charts:- Daily , Weekly | |
| Add CVNA to Watchlist: View: Get Complete CVNA Trend Analysis ➞ | |
 | SOUN SoundHound AI, Inc. |
| Sector: Technology | |
| SubSector: Software - Application | |
| MarketCap: 1040 Millions | |
| Recent Price: 4.35 Smart Investing & Trading Score: 35 | |
| Day Percent Change: -4.71% Day Change: -0.22 | |
| Week Change: -1.25% Year-to-date Change: 103.3% | |
| SOUN Links: Profile News Message Board | |
| Charts:- Daily , Weekly | |
| Add SOUN to Watchlist: View: Get Complete SOUN Trend Analysis ➞ | |
 | MAX MediaAlpha, Inc. |
| Sector: Technology | |
| SubSector: Internet Content & Information | |
| MarketCap: 22537 Millions | |
| Recent Price: 22.20 Smart Investing & Trading Score: 93 | |
| Day Percent Change: 0.54% Day Change: 0.12 | |
| Week Change: 17.71% Year-to-date Change: 99.6% | |
| MAX Links: Profile News Message Board | |
| Charts:- Daily , Weekly | |
| Add MAX to Watchlist: View: Get Complete MAX Trend Analysis ➞ | |
 | VTYX Ventyx Biosciences, Inc. |
| Sector: Health Care | |
| SubSector: Biotechnology | |
| MarketCap: 1950 Millions | |
| Recent Price: 4.93 Smart Investing & Trading Score: 69 | |
| Day Percent Change: 1.23% Day Change: 0.06 | |
| Week Change: 25.13% Year-to-date Change: 99.2% | |
| VTYX Links: Profile News Message Board | |
| Charts:- Daily , Weekly | |
| Add VTYX to Watchlist: View: Get Complete VTYX Trend Analysis ➞ | |
 | OSCR Oscar Health, Inc. |
| Sector: Health Care | |
| SubSector: Healthcare Plans | |
| MarketCap: 1790 Millions | |
| Recent Price: 17.98 Smart Investing & Trading Score: 85 | |
| Day Percent Change: 1.30% Day Change: 0.23 | |
| Week Change: 2.39% Year-to-date Change: 97.5% | |
| OSCR Links: Profile News Message Board | |
| Charts:- Daily , Weekly | |
| Add OSCR to Watchlist: View: Get Complete OSCR Trend Analysis ➞ | |
 | DYN Dyne Therapeutics, Inc. |
| Sector: Health Care | |
| SubSector: Biotechnology | |
| MarketCap: 88487 Millions | |
| Recent Price: 26.08 Smart Investing & Trading Score: 34 | |
| Day Percent Change: 0.31% Day Change: 0.08 | |
| Week Change: 5.46% Year-to-date Change: 96.1% | |
| DYN Links: Profile News Message Board | |
| Charts:- Daily , Weekly | |
| Add DYN to Watchlist: View: Get Complete DYN Trend Analysis ➞ | |
 | SG Sweetgreen, Inc. |
| Sector: Services & Goods | |
| SubSector: Restaurants | |
| MarketCap: 1420 Millions | |
| Recent Price: 22.10 Smart Investing & Trading Score: 53 | |
| Day Percent Change: 3.56% Day Change: 0.76 | |
| Week Change: -9.87% Year-to-date Change: 95.6% | |
| SG Links: Profile News Message Board | |
| Charts:- Daily , Weekly | |
| Add SG to Watchlist: View: Get Complete SG Trend Analysis ➞ | |
 | MSTR MicroStrategy Incorporated |
| Sector: Technology | |
| SubSector: Application Software | |
| MarketCap: 1164.52 Millions | |
| Recent Price: 1223.01 Smart Investing & Trading Score: 63 | |
| Day Percent Change: 8.29% Day Change: 93.59 | |
| Week Change: -4.63% Year-to-date Change: 93.6% | |
| MSTR Links: Profile News Message Board | |
| Charts:- Daily , Weekly | |
| Add MSTR to Watchlist: View: Get Complete MSTR Trend Analysis ➞ | |
 | GBIO Generation Bio Co. |
| Sector: Health Care | |
| SubSector: Biotechnology | |
| MarketCap: 17487 Millions | |
| Recent Price: 3.18 Smart Investing & Trading Score: 68 | |
| Day Percent Change: 2.25% Day Change: 0.07 | |
| Week Change: 9.66% Year-to-date Change: 92.7% | |
| GBIO Links: Profile News Message Board | |
| Charts:- Daily , Weekly | |
| Add GBIO to Watchlist: View: Get Complete GBIO Trend Analysis ➞ | |
 | SMR NuScale Power Corporation |
| Sector: Industrials | |
| SubSector: Specialty Industrial Machinery | |
| MarketCap: 1510 Millions | |
| Recent Price: 6.05 Smart Investing & Trading Score: 83 | |
| Day Percent Change: 1.26% Day Change: 0.08 | |
| Week Change: -0.17% Year-to-date Change: 87.6% | |
| SMR Links: Profile News Message Board | |
| Charts:- Daily , Weekly | |
| Add SMR to Watchlist: View: Get Complete SMR Trend Analysis ➞ | |
 | TARS Tarsus Pharmaceuticals, Inc. |
| Sector: Health Care | |
| SubSector: Biotechnology | |
| MarketCap: 74487 Millions | |
| Recent Price: 36.89 Smart Investing & Trading Score: 69 | |
| Day Percent Change: 6.53% Day Change: 2.26 | |
| Week Change: 15.14% Year-to-date Change: 81.9% | |
| TARS Links: Profile News Message Board | |
| Charts:- Daily , Weekly | |
| Add TARS to Watchlist: View: Get Complete TARS Trend Analysis ➞ | |
 | VITL Vital Farms, Inc. |
| Sector: Consumer Staples | |
| SubSector: Farm Products | |
| MarketCap: 10347 Millions | |
| Recent Price: 28.12 Smart Investing & Trading Score: 95 | |
| Day Percent Change: -0.32% Day Change: -0.09 | |
| Week Change: 4.15% Year-to-date Change: 79.1% | |
| VITL Links: Profile News Message Board | |
| Charts:- Daily , Weekly | |
| Add VITL to Watchlist: View: Get Complete VITL Trend Analysis ➞ | |
 | SMTC Semtech Corporation |
| Sector: Technology | |
| SubSector: Semiconductor - Integrated Circuits | |
| MarketCap: 2285 Millions | |
| Recent Price: 39.01 Smart Investing & Trading Score: 100 | |
| Day Percent Change: 0.85% Day Change: 0.33 | |
| Week Change: 9.06% Year-to-date Change: 78.1% | |
| SMTC Links: Profile News Message Board | |
| Charts:- Daily , Weekly | |
| Add SMTC to Watchlist: View: Get Complete SMTC Trend Analysis ➞ | |
 | IOVA Iovance Biotherapeutics, Inc. |
| Sector: Health Care | |
| SubSector: Biotechnology | |
| MarketCap: 3533.35 Millions | |
| Recent Price: 13.63 Smart Investing & Trading Score: 69 | |
| Day Percent Change: 5.82% Day Change: 0.75 | |
| Week Change: 17.1% Year-to-date Change: 67.7% | |
| IOVA Links: Profile News Message Board | |
| Charts:- Daily , Weekly | |
| Add IOVA to Watchlist: View: Get Complete IOVA Trend Analysis ➞ | |
 | TREE LendingTree, Inc. |
| Sector: Financials | |
| SubSector: Mortgage Investment | |
| MarketCap: 2745.99 Millions | |
| Recent Price: 49.41 Smart Investing & Trading Score: 95 | |
| Day Percent Change: 0.16% Day Change: 0.08 | |
| Week Change: 30.37% Year-to-date Change: 63.0% | |
| TREE Links: Profile News Message Board | |
| Charts:- Daily , Weekly | |
| Add TREE to Watchlist: View: Get Complete TREE Trend Analysis ➞ | |
 | EBS Emergent BioSolutions Inc. |
| Sector: Health Care | |
| SubSector: Biotechnology | |
| MarketCap: 2417.65 Millions | |
| Recent Price: 3.89 Smart Investing & Trading Score: 100 | |
| Day Percent Change: 17.88% Day Change: 0.59 | |
| Week Change: 102.6% Year-to-date Change: 62.1% | |
| EBS Links: Profile News Message Board | |
| Charts:- Daily , Weekly | |
| Add EBS to Watchlist: View: Get Complete EBS Trend Analysis ➞ | |
 | DCPH Deciphera Pharmaceuticals, Inc. |
| Sector: Health Care | |
| SubSector: Biotechnology | |
| MarketCap: 2329.95 Millions | |
| Recent Price: 25.38 Smart Investing & Trading Score: 88 | |
| Day Percent Change: 0.00% Day Change: 0.00 | |
| Week Change: 73.24% Year-to-date Change: 57.4% | |
| DCPH Links: Profile News Message Board | |
| Charts:- Daily , Weekly | |
| Add DCPH to Watchlist: View: Get Complete DCPH Trend Analysis ➞ | |
 | DOOR Masonite International Corporation |
| Sector: Industrials | |
| SubSector: General Building Materials | |
| MarketCap: 1220.53 Millions | |
| Recent Price: 132.70 Smart Investing & Trading Score: 78 | |
| Day Percent Change: 0.00% Day Change: 0.00 | |
| Week Change: 0.83% Year-to-date Change: 56.7% | |
| DOOR Links: Profile News Message Board | |
| Charts:- Daily , Weekly | |
| Add DOOR to Watchlist: View: Get Complete DOOR Trend Analysis ➞ | |
 | AGIO Agios Pharmaceuticals, Inc. |
| Sector: Health Care | |
| SubSector: Biotechnology | |
| MarketCap: 2613.35 Millions | |
| Recent Price: 34.54 Smart Investing & Trading Score: 95 | |
| Day Percent Change: -0.12% Day Change: -0.04 | |
| Week Change: 9.69% Year-to-date Change: 55.1% | |
| AGIO Links: Profile News Message Board | |
| Charts:- Daily , Weekly | |
| Add AGIO to Watchlist: View: Get Complete AGIO Trend Analysis ➞ | |
 | HRTX Heron Therapeutics, Inc. |
| Sector: Health Care | |
| SubSector: Biotechnology | |
| MarketCap: 1172.75 Millions | |
| Recent Price: 2.61 Smart Investing & Trading Score: 32 | |
| Day Percent Change: 2.35% Day Change: 0.06 | |
| Week Change: 6.53% Year-to-date Change: 53.5% | |
| HRTX Links: Profile News Message Board | |
| Charts:- Daily , Weekly | |
| Add HRTX to Watchlist: View: Get Complete HRTX Trend Analysis ➞ | |
 | FIX Comfort Systems USA, Inc. |
| Sector: Industrials | |
| SubSector: General Contractors | |
| MarketCap: 1440.63 Millions | |
| Recent Price: 315.03 Smart Investing & Trading Score: 85 | |
| Day Percent Change: 2.38% Day Change: 7.32 | |
| Week Change: 4.31% Year-to-date Change: 53.2% | |
| FIX Links: Profile News Message Board | |
| Charts:- Daily , Weekly | |
| Add FIX to Watchlist: View: Get Complete FIX Trend Analysis ➞ | |
| For tabular summary view of above stock list: Summary View ➞ 0 - 25 , 25 - 50 , 50 - 75 , 75 - 100 , 100 - 125 , 125 - 150 , 150 - 175 , 175 - 200 , 200 - 225 , 225 - 250 , 250 - 275 , 275 - 300 , 300 - 325 , 325 - 350 , 350 - 375 , 375 - 400 , 400 - 425 , 425 - 450 , 450 - 475 , 475 - 500 , 500 - 525 , 525 - 550 , 550 - 575 , 575 - 600 , 600 - 625 , 625 - 650 , 650 - 675 , 675 - 700 | ||
| Click To Change The Sort Order: By Market Cap or Company Size Performance: Year-to-date, Week and Day | |
| Select Chart Type: | ||
| Too many stocks? View smallcap stocks filtered by marketcap & sector |
| Marketcap: All SmallCap Stocks (default-no microcap), Large, Mid-Range, Small & MicroCap |
| Sector: Tech, Finance, Energy, Staples, Retail, Industrial, Materials, Utilities & Medical |
|
Best Stocks Today 12Stocks.com |
© 2024 12Stocks.com Terms & Conditions Privacy Contact Us
All Information Provided Only For Education And Not To Be Used For Investing or Trading. See Terms & Conditions


One More Thing ... Get Best Stocks Delivered Daily!
Never Ever Miss A Move With Our Top Ten Stocks Lists
Find Best Stocks In Any Market - Bull or Bear Market
Take A Peek At Our Top Ten Stocks Lists: Daily, Weekly, Year-to-Date & Top Trends
Find Best Stocks In Any Market - Bull or Bear Market
Take A Peek At Our Top Ten Stocks Lists: Daily, Weekly, Year-to-Date & Top Trends
Smallcap Stocks With Best Up Trends [0-bearish to 100-bullish]: Twist Bioscience[100], WideOpenWest [100], Joint [100], FTC Solar[100], Origin Materials[100], Alignment Healthcare[100], Clarus [100], IES [100], Emergent BioSolutions[100], Enovix [100], El Pollo[100]
Best Smallcap Stocks Year-to-Date:
Janux [482.74%], Viking [313.59%], Longboard [272.5%], Alpine Immune[239.29%], Bakkt [199.55%], Avidity Biosciences[192.48%], Vera [189.47%], Cullinan Oncology[176.9%], Super Micro[175.35%], Y-mAbs [151.47%], Sana [149.33%] Best Smallcap Stocks This Week:
Emergent BioSolutions[102.6%], Deciphera [73.24%], Origin Materials[66.52%], Eyenovia [60.78%], Cue Biopharma[56.04%], Aspen Aerogels[55.96%], Enovix [54.02%], Luna Innovations[53.77%], Codexis [47.37%], Carvana Co[44.31%], Office Properties[42.79%] Best Smallcap Stocks Daily:
Luna Innovations[36.00%], Twist Bioscience[28.74%], Ardelyx [28.42%], WideOpenWest [28.23%], 2U [26.63%], Joint [25.35%], FTC Solar[25.09%], Origin Materials[22.23%], Alignment Healthcare[21.97%], Clarus [18.67%], Aurora Innovation[18.09%]