
 Login Sign Up


| |||||
 |  | ||||

| 12Stocks.com Market Intelligence |
Best SmallCap Stocks
|
| In a hurry? Small Cap Stock Lists: Performance Trends Table, Stock Charts
Sort Small Cap stocks: Daily, Weekly, Year-to-Date, Market Cap & Trends. Filter Small Cap stocks list by sector: Show all, Tech, Finance, Energy, Staples, Retail, Industrial, Materials, Utilities and HealthCare Filter Small Cap stocks list by size: All Large Medium Small and MicroCap |
| 12Stocks.com Small Cap Stocks Performances & Trends Daily | |||||||||
|
|  The overall Smart Investing & Trading Score is 69 (0-bearish to 100-bullish) which puts Small Cap index in short term neutral to bullish trend. The Smart Investing & Trading Score from previous trading session is 49 and hence an improvement of trend.
| ||||||||
Here are the Smart Investing & Trading Scores of the most requested small cap stocks at 12Stocks.com (click stock name for detailed review):
|


| 12Stocks.com: Investing in Smallcap Index with Stocks | |
|
The following table helps investors and traders sort through current performance and trends (as measured by Smart Investing & Trading Score) of various
stocks in the Smallcap Index. Quick View: Move mouse or cursor over stock symbol (ticker) to view short-term technical chart and over stock name to view long term chart. Click on  to add stock symbol to your watchlist and to add stock symbol to your watchlist and  to view watchlist. Click on any ticker or stock name for detailed market intelligence report for that stock. to view watchlist. Click on any ticker or stock name for detailed market intelligence report for that stock. |
12Stocks.com Performance of Stocks in Smallcap Index
| Ticker | Stock Name | Watchlist | Category | Recent Price | Smart Investing & Trading Score | Change % | YTD Change% |
| WDFC | WD-40 |   | Materials | 230.01 | 42 | -0.30% | -3.79% |
| EXLS | ExlService | | Technology | 29.65 | 49 | -1.27% | -3.89% |
| ACLX | Arcellx | | Health Care | 53.63 | 32 | 1.06% | -3.90% |
| ESRT | Empire State | | Financials | 9.30 | 57 | -0.11% | -4.02% |
| IRTC | iRhythm | | Health Care | 102.68 | 0 | -7.40% | -4.07% |
| GEF | Greif | | Consumer Staples | 62.90 | 67 | 1.00% | -4.10% |
| PAYO | Payoneer Global | | Technology | 5.07 | 93 | 2.43% | -4.25% |
| APAM | Artisan Partners | | Financials | 42.29 | 32 | 0.86% | -4.28% |
| EBC | Eastern Bankshares | | Financials | 13.59 | 100 | 1.34% | -4.30% |
| ALLO | Allogene | | Health Care | 3.07 | 37 | 3.37% | -4.36% |
| AAT | American Assets | | Financials | 21.51 | 77 | -0.23% | -4.44% |
| DEI | Douglas Emmett | | Financials | 13.85 | 100 | 0.80% | -4.48% |
| IDCC | InterDigital | | Technology | 103.64 | 64 | 0.76% | -4.51% |
| FCPT | Four Corners | | Financials | 24.14 | 87 | 0.21% | -4.58% |
| PRAA | PRA Group | | Services & Goods | 24.95 | 67 | 0.97% | -4.77% |
| KMT | Kennametal | | Industrials | 24.54 | 67 | 1.57% | -4.85% |
| BHVN | Biohaven Pharmaceutical | | Health Care | 40.69 | 39 | 1.98% | -4.93% |
| ABG | Asbury Automotive | | Services & Goods | 213.75 | 65 | 2.54% | -4.99% |
| VSH | Vishay Inter | | Technology | 22.77 | 80 | 0.80% | -5.01% |
| SHO | Sunstone Hotel | | Financials | 10.19 | 10 | 1.39% | -5.03% |
| NOVT | Novanta | | Technology | 159.89 | 39 | 0.15% | -5.06% |
| RHP | Ryman Hospitality | | Financials | 104.43 | 17 | -0.37% | -5.12% |
| TGTX | TG | | Health Care | 16.19 | 74 | -1.40% | -5.21% |
| INVA | Innoviva | | Health Care | 15.20 | 60 | -1.11% | -5.24% |
| CHCO | City Holding | | Financials | 104.47 | 83 | -0.28% | -5.25% |
| For chart view version of above stock list: Chart View ➞ 0 - 25 , 25 - 50 , 50 - 75 , 75 - 100 , 100 - 125 , 125 - 150 , 150 - 175 , 175 - 200 , 200 - 225 , 225 - 250 , 250 - 275 , 275 - 300 , 300 - 325 , 325 - 350 , 350 - 375 , 375 - 400 , 400 - 425 , 425 - 450 , 450 - 475 , 475 - 500 , 500 - 525 , 525 - 550 , 550 - 575 , 575 - 600 , 600 - 625 , 625 - 650 , 650 - 675 , 675 - 700 | ||
 | Click To Change The Sort Order: By Market Cap or Company Size Performance: Year-to-date, Week and Day |  |
| Too many stocks? View smallcap stocks filtered by marketcap & sector |
| Marketcap: All SmallCap Stocks (default-no microcap), Large, Mid-Range, Small |
| Smallcap Sector: Tech, Finance, Energy, Staples, Retail, Industrial, Materials, & Medical |
|
Get the most comprehensive stock market coverage daily at 12Stocks.com ➞ Best Stocks Today ➞ Best Stocks Weekly ➞ Best Stocks Year-to-Date ➞ Best Stocks Trends ➞  Best Stocks Today 12Stocks.com Best Nasdaq Stocks ➞ Best S&P 500 Stocks ➞ Best Tech Stocks ➞ Best Biotech Stocks ➞ |
| Detailed Overview of SmallCap Stocks |
| SmallCap Technical Overview, Leaders & Laggards, Top SmallCap ETF Funds & Detailed SmallCap Stocks List, Charts, Trends & More |
| Smallcap: Technical Analysis, Trends & YTD Performance | |
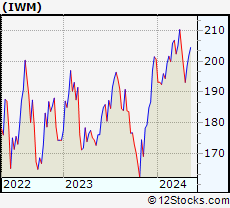
| SmallCap segment as represented by
IWM, an exchange-traded fund [ETF], holds basket of thousands of smallcap stocks from across all major sectors of the US stock market. The smallcap index (contains stocks like Riverbed & Sotheby's) is up by 0.59% and is currently underperforming the overall market by -6.29% year-to-date. Below is a quick view of technical charts and trends: | |
 IWM Weekly Chart |
|
| Long Term Trend: Not Good | |
| Medium Term Trend: Very Good | |
 IWM Daily Chart |
|
| Short Term Trend: Very Good | |
| Overall Trend Score: 69 | |
| YTD Performance: 0.59% | |
| **Trend Scores & Views Are Only For Educational Purposes And Not For Investing | |
| 12Stocks.com: Top Performing Small Cap Index Stocks | ||||||||||||||||||||||||||||||||||||||||||||||||
 The top performing Small Cap Index stocks year to date are
Now, more recently, over last week, the top performing Small Cap Index stocks on the move are


|
||||||||||||||||||||||||||||||||||||||||||||||||
| 12Stocks.com: Investing in Smallcap Index using Exchange Traded Funds | |
|
The following table shows list of key exchange traded funds (ETF) that
help investors track Smallcap index. The following list also includes leveraged ETF funds that track twice or thrice the daily returns of Smallcap indices. Short or inverse ETF funds move in the opposite direction to the index they track and are useful during market pullbacks or during bear markets. Quick View: Move mouse or cursor over ETF symbol (ticker) to view short-term technical chart and over ETF name to view long term chart. Click on ticker or stock name for detailed view. Click on to add stock symbol to your watchlist and to view watchlist. |
12Stocks.com List of ETFs that track Smallcap Index
| Ticker | ETF Name | Watchlist | Recent Price | Smart Investing & Trading Score | Change % | Week % | Year-to-date % |
| IWM | iShares Russell 2000 | | 201.90 | 69 | 0.99 | 1.77 | 0.59% |
| IJR | iShares Core S&P Small-Cap | | 107.13 | 82 | 0.75 | 1.4 | -1.03% |
| VTWO | Vanguard Russell 2000 ETF | | 81.61 | 69 | 0.94 | 1.73 | 0.63% |
| IWN | iShares Russell 2000 Value | | 154.21 | 100 | 0.87 | 2.03 | -0.72% |
| IJS | iShares S&P Small-Cap 600 Value | | 98.72 | 64 | 0.71 | 1.57 | -4.22% |
| IWO | iShares Russell 2000 Growth | | 256.87 | 57 | 0.99 | 1.49 | 1.84% |
| IJT | iShares S&P Small-Cap 600 Growth | | 127.76 | 95 | 0.82 | 1.32 | 2.09% |
| XSLV | PowerShares S&P SmallCap Low Volatil ETF | | 43.22 | 87 | 0.19 | 1.17 | -2.11% |
| SBB | ProShares Short SmallCap600 | | 16.16 | 13 | -1.28 | -1.37 | 1.44% |
| SDD | ProShares UltraShort SmallCap600 | | 18.84 | 23 | -2.41 | -2.61 | 2.27% |
| SAA | ProShares Ultra SmallCap600 | | 23.59 | 69 | 2.86 | 2.39 | -5.45% |
| SMLV | SPDR SSGA US Small Cap Low Volatil ETF | | 109.69 | 87 | 0.78 | 2.01 | -2.52% |
| 12Stocks.com: Charts, Trends, Fundamental Data and Performances of SmallCap Stocks | |
|
We now take in-depth look at all SmallCap stocks including charts, multi-period performances and overall trends (as measured by Smart Investing & Trading Score). One can sort SmallCap stocks (click link to choose) by Daily, Weekly and by Year-to-Date performances. Also, one can sort by size of the company or by market capitalization. |
| Select Your Default Chart Type: | |||||
| |||||
| Click on stock symbol or name for detailed view. Click on to add stock symbol to your watchlist and to view watchlist. Quick View: Move mouse or cursor over "Daily" to quickly view daily technical stock chart and over "Weekly" to view weekly technical stock chart. | |||||

 | WDFC WD-40 Company |
| Sector: Materials | |
| SubSector: Specialty Chemicals | |
| MarketCap: 2900.57 Millions | |
| Recent Price: 230.01 Smart Investing & Trading Score: 42 | |
| Day Percent Change: -0.30% Day Change: -0.70 | |
| Week Change: 1.99% Year-to-date Change: -3.8% | |
| WDFC Links: Profile News Message Board | |
| Charts:- Daily , Weekly | |
| Add WDFC to Watchlist: View: Get Complete WDFC Trend Analysis ➞ | |
 | EXLS ExlService Holdings, Inc. |
| Sector: Technology | |
| SubSector: Information Technology Services | |
| MarketCap: 1781.78 Millions | |
| Recent Price: 29.65 Smart Investing & Trading Score: 49 | |
| Day Percent Change: -1.27% Day Change: -0.38 | |
| Week Change: 0.99% Year-to-date Change: -3.9% | |
| EXLS Links: Profile News Message Board | |
| Charts:- Daily , Weekly | |
| Add EXLS to Watchlist: View: Get Complete EXLS Trend Analysis ➞ | |
 | ACLX Arcellx, Inc. |
| Sector: Health Care | |
| SubSector: Biotechnology | |
| MarketCap: 1530 Millions | |
| Recent Price: 53.63 Smart Investing & Trading Score: 32 | |
| Day Percent Change: 1.06% Day Change: 0.57 | |
| Week Change: 3.39% Year-to-date Change: -3.9% | |
| ACLX Links: Profile News Message Board | |
| Charts:- Daily , Weekly | |
| Add ACLX to Watchlist: View: Get Complete ACLX Trend Analysis ➞ | |
 | ESRT Empire State Realty Trust, Inc. |
| Sector: Financials | |
| SubSector: REIT - Diversified | |
| MarketCap: 1632.13 Millions | |
| Recent Price: 9.30 Smart Investing & Trading Score: 57 | |
| Day Percent Change: -0.11% Day Change: -0.01 | |
| Week Change: 0.98% Year-to-date Change: -4.0% | |
| ESRT Links: Profile News Message Board | |
| Charts:- Daily , Weekly | |
| Add ESRT to Watchlist: View: Get Complete ESRT Trend Analysis ➞ | |
 | IRTC iRhythm Technologies, Inc. |
| Sector: Health Care | |
| SubSector: Medical Instruments & Supplies | |
| MarketCap: 2167.9 Millions | |
| Recent Price: 102.68 Smart Investing & Trading Score: 0 | |
| Day Percent Change: -7.40% Day Change: -8.20 | |
| Week Change: -8.25% Year-to-date Change: -4.1% | |
| IRTC Links: Profile News Message Board | |
| Charts:- Daily , Weekly | |
| Add IRTC to Watchlist: View: Get Complete IRTC Trend Analysis ➞ | |
 | GEF Greif, Inc. |
| Sector: Consumer Staples | |
| SubSector: Packaging & Containers | |
| MarketCap: 1563.03 Millions | |
| Recent Price: 62.90 Smart Investing & Trading Score: 67 | |
| Day Percent Change: 1.00% Day Change: 0.62 | |
| Week Change: 1.58% Year-to-date Change: -4.1% | |
| GEF Links: Profile News Message Board | |
| Charts:- Daily , Weekly | |
| Add GEF to Watchlist: View: Get Complete GEF Trend Analysis ➞ | |
 | PAYO Payoneer Global Inc. |
| Sector: Technology | |
| SubSector: Software - Infrastructure | |
| MarketCap: 1710 Millions | |
| Recent Price: 5.07 Smart Investing & Trading Score: 93 | |
| Day Percent Change: 2.43% Day Change: 0.12 | |
| Week Change: 1.3% Year-to-date Change: -4.3% | |
| PAYO Links: Profile News Message Board | |
| Charts:- Daily , Weekly | |
| Add PAYO to Watchlist: View: Get Complete PAYO Trend Analysis ➞ | |
 | APAM Artisan Partners Asset Management Inc. |
| Sector: Financials | |
| SubSector: Asset Management | |
| MarketCap: 1688.33 Millions | |
| Recent Price: 42.29 Smart Investing & Trading Score: 32 | |
| Day Percent Change: 0.86% Day Change: 0.36 | |
| Week Change: 0.79% Year-to-date Change: -4.3% | |
| APAM Links: Profile News Message Board | |
| Charts:- Daily , Weekly | |
| Add APAM to Watchlist: View: Get Complete APAM Trend Analysis ➞ | |
 | EBC Eastern Bankshares, Inc. |
| Sector: Financials | |
| SubSector: Banks Regional | |
| MarketCap: 30057 Millions | |
| Recent Price: 13.59 Smart Investing & Trading Score: 100 | |
| Day Percent Change: 1.34% Day Change: 0.18 | |
| Week Change: 4.22% Year-to-date Change: -4.3% | |
| EBC Links: Profile News Message Board | |
| Charts:- Daily , Weekly | |
| Add EBC to Watchlist: View: Get Complete EBC Trend Analysis ➞ | |
 | ALLO Allogene Therapeutics, Inc. |
| Sector: Health Care | |
| SubSector: Biotechnology | |
| MarketCap: 2858.65 Millions | |
| Recent Price: 3.07 Smart Investing & Trading Score: 37 | |
| Day Percent Change: 3.37% Day Change: 0.10 | |
| Week Change: 6.23% Year-to-date Change: -4.4% | |
| ALLO Links: Profile News Message Board | |
| Charts:- Daily , Weekly | |
| Add ALLO to Watchlist: View: Get Complete ALLO Trend Analysis ➞ | |
 | AAT American Assets Trust, Inc. |
| Sector: Financials | |
| SubSector: REIT - Retail | |
| MarketCap: 1580.54 Millions | |
| Recent Price: 21.51 Smart Investing & Trading Score: 77 | |
| Day Percent Change: -0.23% Day Change: -0.05 | |
| Week Change: 1.32% Year-to-date Change: -4.4% | |
| AAT Links: Profile News Message Board | |
| Charts:- Daily , Weekly | |
| Add AAT to Watchlist: View: Get Complete AAT Trend Analysis ➞ | |
 | DEI Douglas Emmett, Inc. |
| Sector: Financials | |
| SubSector: REIT - Diversified | |
| MarketCap: 4917.83 Millions | |
| Recent Price: 13.85 Smart Investing & Trading Score: 100 | |
| Day Percent Change: 0.80% Day Change: 0.11 | |
| Week Change: 3.59% Year-to-date Change: -4.5% | |
| DEI Links: Profile News Message Board | |
| Charts:- Daily , Weekly | |
| Add DEI to Watchlist: View: Get Complete DEI Trend Analysis ➞ | |
 | IDCC InterDigital, Inc. |
| Sector: Technology | |
| SubSector: Wireless Communications | |
| MarketCap: 1225.27 Millions | |
| Recent Price: 103.64 Smart Investing & Trading Score: 64 | |
| Day Percent Change: 0.76% Day Change: 0.78 | |
| Week Change: 2.91% Year-to-date Change: -4.5% | |
| IDCC Links: Profile News Message Board | |
| Charts:- Daily , Weekly | |
| Add IDCC to Watchlist: View: Get Complete IDCC Trend Analysis ➞ | |
 | FCPT Four Corners Property Trust, Inc. |
| Sector: Financials | |
| SubSector: REIT - Hotel/Motel | |
| MarketCap: 1218.94 Millions | |
| Recent Price: 24.14 Smart Investing & Trading Score: 87 | |
| Day Percent Change: 0.21% Day Change: 0.05 | |
| Week Change: 2.99% Year-to-date Change: -4.6% | |
| FCPT Links: Profile News Message Board | |
| Charts:- Daily , Weekly | |
| Add FCPT to Watchlist: View: Get Complete FCPT Trend Analysis ➞ | |
 | PRAA PRA Group, Inc. |
| Sector: Services & Goods | |
| SubSector: Business Services | |
| MarketCap: 1290.32 Millions | |
| Recent Price: 24.95 Smart Investing & Trading Score: 67 | |
| Day Percent Change: 0.97% Day Change: 0.24 | |
| Week Change: 3.48% Year-to-date Change: -4.8% | |
| PRAA Links: Profile News Message Board | |
| Charts:- Daily , Weekly | |
| Add PRAA to Watchlist: View: Get Complete PRAA Trend Analysis ➞ | |
 | KMT Kennametal Inc. |
| Sector: Industrials | |
| SubSector: Machine Tools & Accessories | |
| MarketCap: 1486.48 Millions | |
| Recent Price: 24.54 Smart Investing & Trading Score: 67 | |
| Day Percent Change: 1.57% Day Change: 0.38 | |
| Week Change: 2.08% Year-to-date Change: -4.9% | |
| KMT Links: Profile News Message Board | |
| Charts:- Daily , Weekly | |
| Add KMT to Watchlist: View: Get Complete KMT Trend Analysis ➞ | |
 | BHVN Biohaven Pharmaceutical Holding Company Ltd. |
| Sector: Health Care | |
| SubSector: Biotechnology | |
| MarketCap: 2024.25 Millions | |
| Recent Price: 40.69 Smart Investing & Trading Score: 39 | |
| Day Percent Change: 1.98% Day Change: 0.79 | |
| Week Change: 4.41% Year-to-date Change: -4.9% | |
| BHVN Links: Profile News Message Board | |
| Charts:- Daily , Weekly | |
| Add BHVN to Watchlist: View: Get Complete BHVN Trend Analysis ➞ | |
 | ABG Asbury Automotive Group, Inc. |
| Sector: Services & Goods | |
| SubSector: Auto Dealerships | |
| MarketCap: 1203.21 Millions | |
| Recent Price: 213.75 Smart Investing & Trading Score: 65 | |
| Day Percent Change: 2.54% Day Change: 5.30 | |
| Week Change: -3.7% Year-to-date Change: -5.0% | |
| ABG Links: Profile News Message Board | |
| Charts:- Daily , Weekly | |
| Add ABG to Watchlist: View: Get Complete ABG Trend Analysis ➞ | |
 | VSH Vishay Intertechnology, Inc. |
| Sector: Technology | |
| SubSector: Semiconductor - Broad Line | |
| MarketCap: 2132.52 Millions | |
| Recent Price: 22.77 Smart Investing & Trading Score: 80 | |
| Day Percent Change: 0.80% Day Change: 0.18 | |
| Week Change: 0.62% Year-to-date Change: -5.0% | |
| VSH Links: Profile News Message Board | |
| Charts:- Daily , Weekly | |
| Add VSH to Watchlist: View: Get Complete VSH Trend Analysis ➞ | |
 | SHO Sunstone Hotel Investors, Inc. |
| Sector: Financials | |
| SubSector: REIT - Hotel/Motel | |
| MarketCap: 1861.04 Millions | |
| Recent Price: 10.19 Smart Investing & Trading Score: 10 | |
| Day Percent Change: 1.39% Day Change: 0.14 | |
| Week Change: -1.07% Year-to-date Change: -5.0% | |
| SHO Links: Profile News Message Board | |
| Charts:- Daily , Weekly | |
| Add SHO to Watchlist: View: Get Complete SHO Trend Analysis ➞ | |
 | NOVT Novanta Inc. |
| Sector: Technology | |
| SubSector: Scientific & Technical Instruments | |
| MarketCap: 2680.83 Millions | |
| Recent Price: 159.89 Smart Investing & Trading Score: 39 | |
| Day Percent Change: 0.15% Day Change: 0.24 | |
| Week Change: 0.3% Year-to-date Change: -5.1% | |
| NOVT Links: Profile News Message Board | |
| Charts:- Daily , Weekly | |
| Add NOVT to Watchlist: View: Get Complete NOVT Trend Analysis ➞ | |
 | RHP Ryman Hospitality Properties, Inc. |
| Sector: Financials | |
| SubSector: REIT - Hotel/Motel | |
| MarketCap: 1519.74 Millions | |
| Recent Price: 104.43 Smart Investing & Trading Score: 17 | |
| Day Percent Change: -0.37% Day Change: -0.39 | |
| Week Change: -2.46% Year-to-date Change: -5.1% | |
| RHP Links: Profile News Message Board | |
| Charts:- Daily , Weekly | |
| Add RHP to Watchlist: View: Get Complete RHP Trend Analysis ➞ | |
 | TGTX TG Therapeutics, Inc. |
| Sector: Health Care | |
| SubSector: Biotechnology | |
| MarketCap: 1022.85 Millions | |
| Recent Price: 16.19 Smart Investing & Trading Score: 74 | |
| Day Percent Change: -1.40% Day Change: -0.23 | |
| Week Change: 20.19% Year-to-date Change: -5.2% | |
| TGTX Links: Profile News Message Board | |
| Charts:- Daily , Weekly | |
| Add TGTX to Watchlist: View: Get Complete TGTX Trend Analysis ➞ | |
 | INVA Innoviva, Inc. |
| Sector: Health Care | |
| SubSector: Biotechnology | |
| MarketCap: 1023.15 Millions | |
| Recent Price: 15.20 Smart Investing & Trading Score: 60 | |
| Day Percent Change: -1.11% Day Change: -0.17 | |
| Week Change: -0.39% Year-to-date Change: -5.2% | |
| INVA Links: Profile News Message Board | |
| Charts:- Daily , Weekly | |
| Add INVA to Watchlist: View: Get Complete INVA Trend Analysis ➞ | |
 | CHCO City Holding Company |
| Sector: Financials | |
| SubSector: Regional - Mid-Atlantic Banks | |
| MarketCap: 1059.59 Millions | |
| Recent Price: 104.47 Smart Investing & Trading Score: 83 | |
| Day Percent Change: -0.28% Day Change: -0.29 | |
| Week Change: 0.35% Year-to-date Change: -5.3% | |
| CHCO Links: Profile News Message Board | |
| Charts:- Daily , Weekly | |
| Add CHCO to Watchlist: View: Get Complete CHCO Trend Analysis ➞ | |
| For tabular summary view of above stock list: Summary View ➞ 0 - 25 , 25 - 50 , 50 - 75 , 75 - 100 , 100 - 125 , 125 - 150 , 150 - 175 , 175 - 200 , 200 - 225 , 225 - 250 , 250 - 275 , 275 - 300 , 300 - 325 , 325 - 350 , 350 - 375 , 375 - 400 , 400 - 425 , 425 - 450 , 450 - 475 , 475 - 500 , 500 - 525 , 525 - 550 , 550 - 575 , 575 - 600 , 600 - 625 , 625 - 650 , 650 - 675 , 675 - 700 | ||
| Click To Change The Sort Order: By Market Cap or Company Size Performance: Year-to-date, Week and Day | |
| Select Chart Type: | ||
| Too many stocks? View smallcap stocks filtered by marketcap & sector |
| Marketcap: All SmallCap Stocks (default-no microcap), Large, Mid-Range, Small & MicroCap |
| Sector: Tech, Finance, Energy, Staples, Retail, Industrial, Materials, Utilities & Medical |
|
Best Stocks Today 12Stocks.com |
© 2024 12Stocks.com Terms & Conditions Privacy Contact Us
All Information Provided Only For Education And Not To Be Used For Investing or Trading. See Terms & Conditions


One More Thing ... Get Best Stocks Delivered Daily!
Never Ever Miss A Move With Our Top Ten Stocks Lists
Find Best Stocks In Any Market - Bull or Bear Market
Take A Peek At Our Top Ten Stocks Lists: Daily, Weekly, Year-to-Date & Top Trends
Find Best Stocks In Any Market - Bull or Bear Market
Take A Peek At Our Top Ten Stocks Lists: Daily, Weekly, Year-to-Date & Top Trends
Smallcap Stocks With Best Up Trends [0-bearish to 100-bullish]: Twist Bioscience[100], WideOpenWest [100], Joint [100], FTC Solar[100], Origin Materials[100], Alignment Healthcare[100], Clarus [100], IES [100], Emergent BioSolutions[100], Enovix [100], El Pollo[100]
Best Smallcap Stocks Year-to-Date:
Janux [482.74%], Viking [313.59%], Longboard [272.5%], Alpine Immune[239.29%], Bakkt [199.55%], Avidity Biosciences[192.48%], Vera [189.47%], Cullinan Oncology[176.9%], Super Micro[175.35%], Y-mAbs [151.47%], Sana [149.33%] Best Smallcap Stocks This Week:
Emergent BioSolutions[102.6%], Deciphera [73.24%], Origin Materials[66.52%], Eyenovia [60.78%], Cue Biopharma[56.04%], Aspen Aerogels[55.96%], Enovix [54.02%], Luna Innovations[53.77%], Codexis [47.37%], Carvana Co[44.31%], Office Properties[42.79%] Best Smallcap Stocks Daily:
Luna Innovations[36.00%], Twist Bioscience[28.74%], Ardelyx [28.42%], WideOpenWest [28.23%], 2U [26.63%], Joint [25.35%], FTC Solar[25.09%], Origin Materials[22.23%], Alignment Healthcare[21.97%], Clarus [18.67%], Aurora Innovation[18.09%]