
 Login Sign Up


| |||||
 |  | ||||

| 12Stocks.com Market Intelligence |
Best SmallCap Stocks
|
| In a hurry? Small Cap Stock Lists: Performance Trends Table, Stock Charts
Sort Small Cap stocks: Daily, Weekly, Year-to-Date, Market Cap & Trends. Filter Small Cap stocks list by sector: Show all, Tech, Finance, Energy, Staples, Retail, Industrial, Materials, Utilities and HealthCare Filter Small Cap stocks list by size: All Large Medium Small and MicroCap |
| 12Stocks.com Small Cap Stocks Performances & Trends Daily | |||||||||
|
|  The overall Smart Investing & Trading Score is 76 (0-bearish to 100-bullish) which puts Small Cap index in short term neutral to bullish trend. The Smart Investing & Trading Score from previous trading session is 90 and hence a deterioration of trend.
| ||||||||
Here are the Smart Investing & Trading Scores of the most requested small cap stocks at 12Stocks.com (click stock name for detailed review):
|


| 12Stocks.com: Investing in Smallcap Index with Stocks | |
|
The following table helps investors and traders sort through current performance and trends (as measured by Smart Investing & Trading Score) of various
stocks in the Smallcap Index. Quick View: Move mouse or cursor over stock symbol (ticker) to view short-term technical chart and over stock name to view long term chart. Click on  to add stock symbol to your watchlist and to add stock symbol to your watchlist and  to view watchlist. Click on any ticker or stock name for detailed market intelligence report for that stock. to view watchlist. Click on any ticker or stock name for detailed market intelligence report for that stock. |
12Stocks.com Performance of Stocks in Smallcap Index
| Ticker | Stock Name | Watchlist | Category | Recent Price | Smart Investing & Trading Score | Change % | YTD Change% |
| IDCC | InterDigital |   | Technology | 109.40 | 85 | 0.66% | 0.79% |
| MAC | Macerich | | Financials | 15.54 | 17 | -3.30% | 0.71% |
| GDOT | Green Dot | | Financials | 9.95 | 68 | -0.20% | 0.51% |
| SBRA | Sabra Health | | Financials | 14.33 | 58 | -1.04% | 0.42% |
| SR | Spire | | Utilities | 62.59 | 100 | 0.45% | 0.40% |
| MIR | Mirion | | Industrials | 10.30 | 33 | -1.15% | 0.39% |
| DOCN | DigitalOcean | | Technology | 37.00 | 42 | -0.86% | 0.05% |
| GNW | Genworth Financial | | Financials | 6.68 | 93 | 1.37% | 0.00% |
| OGS | ONE Gas | | Utilities | 63.72 | 51 | -1.77% | 0.00% |
| NTST | NetSTREIT | | Financials | 17.85 | 76 | -0.06% | -0.06% |
| VSH | Vishay Inter | | Technology | 23.93 | 100 | 0.50% | -0.17% |
| WDFC | WD-40 | | Materials | 238.67 | 40 | -0.05% | -0.17% |
| FUL | H.B. Fuller | | Materials | 81.15 | 90 | -0.25% | -0.32% |
| INVA | Innoviva | | Health Care | 15.98 | 70 | 0.00% | -0.37% |
| FFBC | First Financial | | Financials | 23.66 | 83 | 0.21% | -0.38% |
| JAMF | Jamf Holding | | Technology | 18.00 | 50 | 0.84% | -0.39% |
| PJT | PJT Partners | | Financials | 101.22 | 52 | 1.65% | -0.64% |
| ORIC | ORIC | | Health Care | 9.16 | 38 | 1.55% | -0.65% |
| CERE | Cerevel | | Health Care | 42.10 | 34 | -0.59% | -0.68% |
| SHOO | Steven Madden | | Consumer Staples | 41.66 | 32 | -0.26% | -0.81% |
| SONO | Sonos | | Technology | 16.99 | 15 | -0.29% | -0.88% |
| AMSF | Amerisafe | | Financials | 46.37 | 23 | -0.13% | -0.88% |
| NE | Noble | | Energy | 47.71 | 88 | 0.08% | -0.93% |
| SFBS | ServisFirst Bancshares | | Financials | 66.00 | 83 | 1.16% | -0.95% |
| STBA | S&T Bancorp | | Financials | 33.10 | 100 | 2.26% | -0.96% |
| For chart view version of above stock list: Chart View ➞ 0 - 25 , 25 - 50 , 50 - 75 , 75 - 100 , 100 - 125 , 125 - 150 , 150 - 175 , 175 - 200 , 200 - 225 , 225 - 250 , 250 - 275 , 275 - 300 , 300 - 325 , 325 - 350 , 350 - 375 , 375 - 400 , 400 - 425 , 425 - 450 , 450 - 475 , 475 - 500 , 500 - 525 , 525 - 550 , 550 - 575 , 575 - 600 , 600 - 625 , 625 - 650 , 650 - 675 , 675 - 700 | ||
 | Click To Change The Sort Order: By Market Cap or Company Size Performance: Year-to-date, Week and Day |  |
| Too many stocks? View smallcap stocks filtered by marketcap & sector |
| Marketcap: All SmallCap Stocks (default-no microcap), Large, Mid-Range, Small |
| Smallcap Sector: Tech, Finance, Energy, Staples, Retail, Industrial, Materials, & Medical |
|
Get the most comprehensive stock market coverage daily at 12Stocks.com ➞ Best Stocks Today ➞ Best Stocks Weekly ➞ Best Stocks Year-to-Date ➞ Best Stocks Trends ➞  Best Stocks Today 12Stocks.com Best Nasdaq Stocks ➞ Best S&P 500 Stocks ➞ Best Tech Stocks ➞ Best Biotech Stocks ➞ |
| Detailed Overview of SmallCap Stocks |
| SmallCap Technical Overview, Leaders & Laggards, Top SmallCap ETF Funds & Detailed SmallCap Stocks List, Charts, Trends & More |
| Smallcap: Technical Analysis, Trends & YTD Performance | |
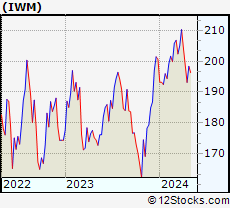
| SmallCap segment as represented by
IWM, an exchange-traded fund [ETF], holds basket of thousands of smallcap stocks from across all major sectors of the US stock market. The smallcap index (contains stocks like Riverbed & Sotheby's) is up by 3.67% and is currently underperforming the overall market by -6.9% year-to-date. Below is a quick view of technical charts and trends: | |
 IWM Weekly Chart |
|
| Long Term Trend: Very Good | |
| Medium Term Trend: Very Good | |
 IWM Daily Chart |
|
| Short Term Trend: Good | |
| Overall Trend Score: 76 | |
| YTD Performance: 3.67% | |
| **Trend Scores & Views Are Only For Educational Purposes And Not For Investing | |
| 12Stocks.com: Top Performing Small Cap Index Stocks | ||||||||||||||||||||||||||||||||||||||||||||||||
 The top performing Small Cap Index stocks year to date are
Now, more recently, over last week, the top performing Small Cap Index stocks on the move are


|
||||||||||||||||||||||||||||||||||||||||||||||||
| 12Stocks.com: Investing in Smallcap Index using Exchange Traded Funds | |
|
The following table shows list of key exchange traded funds (ETF) that
help investors track Smallcap index. The following list also includes leveraged ETF funds that track twice or thrice the daily returns of Smallcap indices. Short or inverse ETF funds move in the opposite direction to the index they track and are useful during market pullbacks or during bear markets. Quick View: Move mouse or cursor over ETF symbol (ticker) to view short-term technical chart and over ETF name to view long term chart. Click on ticker or stock name for detailed view. Click on to add stock symbol to your watchlist and to view watchlist. |
12Stocks.com List of ETFs that track Smallcap Index
| Ticker | ETF Name | Watchlist | Recent Price | Smart Investing & Trading Score | Change % | Week % | Year-to-date % |
| IWM | iShares Russell 2000 | | 208.08 | 76 | 0.07 | 1.85 | 3.67% |
| VTWO | Vanguard Russell 2000 ETF | | 84.11 | 71 | 0.00 | 1.8 | 3.71% |
| IJR | iShares Core S&P Small-Cap | | 110.39 | 68 | -0.22 | 1.29 | 1.98% |
| IWN | iShares Russell 2000 Value | | 158.71 | 76 | -0.07 | 1.61 | 2.18% |
| IWO | iShares Russell 2000 Growth | | 265.15 | 63 | -0.75 | 2.01 | 5.13% |
| IJS | iShares S&P Small-Cap 600 Value | | 101.87 | 76 | -0.15 | 1.34 | -1.16% |
| IJT | iShares S&P Small-Cap 600 Growth | | 131.34 | 71 | 0.04 | 1.14 | 4.95% |
| XSLV | PowerShares S&P SmallCap Low Volatil ETF | | 44.48 | 83 | -0.01 | 0.55 | 0.74% |
| SAA | ProShares Ultra SmallCap600 | | 24.90 | 71 | 0.50 | 2.28 | -0.18% |
| SMLV | SPDR SSGA US Small Cap Low Volatil ETF | | 113.28 | 95 | 0.43 | 1.85 | 0.68% |
| SDD | ProShares UltraShort SmallCap600 | | 17.84 | 35 | 0.96 | -2.41 | -3.19% |
| SBB | ProShares Short SmallCap600 | | 15.77 | 25 | 0.41 | -1.14 | -0.98% |
| 12Stocks.com: Charts, Trends, Fundamental Data and Performances of SmallCap Stocks | |
|
We now take in-depth look at all SmallCap stocks including charts, multi-period performances and overall trends (as measured by Smart Investing & Trading Score). One can sort SmallCap stocks (click link to choose) by Daily, Weekly and by Year-to-Date performances. Also, one can sort by size of the company or by market capitalization. |
| Select Your Default Chart Type: | |||||
| |||||
| Click on stock symbol or name for detailed view. Click on to add stock symbol to your watchlist and to view watchlist. Quick View: Move mouse or cursor over "Daily" to quickly view daily technical stock chart and over "Weekly" to view weekly technical stock chart. | |||||

 | IDCC InterDigital, Inc. |
| Sector: Technology | |
| SubSector: Wireless Communications | |
| MarketCap: 1225.27 Millions | |
| Recent Price: 109.40 Smart Investing & Trading Score: 85 | |
| Day Percent Change: 0.66% Day Change: 0.72 | |
| Week Change: 2.7% Year-to-date Change: 0.8% | |
| IDCC Links: Profile News Message Board | |
| Charts:- Daily , Weekly | |
| Add IDCC to Watchlist: View: Get Complete IDCC Trend Analysis ➞ | |
 | MAC The Macerich Company |
| Sector: Financials | |
| SubSector: REIT - Retail | |
| MarketCap: 1172.54 Millions | |
| Recent Price: 15.54 Smart Investing & Trading Score: 17 | |
| Day Percent Change: -3.30% Day Change: -0.53 | |
| Week Change: 1.7% Year-to-date Change: 0.7% | |
| MAC Links: Profile News Message Board | |
| Charts:- Daily , Weekly | |
| Add MAC to Watchlist: View: Get Complete MAC Trend Analysis ➞ | |
 | GDOT Green Dot Corporation |
| Sector: Financials | |
| SubSector: Credit Services | |
| MarketCap: 1320.08 Millions | |
| Recent Price: 9.95 Smart Investing & Trading Score: 68 | |
| Day Percent Change: -0.20% Day Change: -0.02 | |
| Week Change: 4.52% Year-to-date Change: 0.5% | |
| GDOT Links: Profile News Message Board | |
| Charts:- Daily , Weekly | |
| Add GDOT to Watchlist: View: Get Complete GDOT Trend Analysis ➞ | |
 | SBRA Sabra Health Care REIT, Inc. |
| Sector: Financials | |
| SubSector: REIT - Healthcare Facilities | |
| MarketCap: 2576.54 Millions | |
| Recent Price: 14.33 Smart Investing & Trading Score: 58 | |
| Day Percent Change: -1.04% Day Change: -0.15 | |
| Week Change: -1.38% Year-to-date Change: 0.4% | |
| SBRA Links: Profile News Message Board | |
| Charts:- Daily , Weekly | |
| Add SBRA to Watchlist: View: Get Complete SBRA Trend Analysis ➞ | |
 | SR Spire Inc. |
| Sector: Utilities | |
| SubSector: Gas Utilities | |
| MarketCap: 3745.87 Millions | |
| Recent Price: 62.59 Smart Investing & Trading Score: 100 | |
| Day Percent Change: 0.45% Day Change: 0.28 | |
| Week Change: 1.15% Year-to-date Change: 0.4% | |
| SR Links: Profile News Message Board | |
| Charts:- Daily , Weekly | |
| Add SR to Watchlist: View: Get Complete SR Trend Analysis ➞ | |
 | MIR Mirion Technologies, Inc. |
| Sector: Industrials | |
| SubSector: Specialty Industrial Machinery | |
| MarketCap: 1920 Millions | |
| Recent Price: 10.30 Smart Investing & Trading Score: 33 | |
| Day Percent Change: -1.15% Day Change: -0.12 | |
| Week Change: -1.06% Year-to-date Change: 0.4% | |
| MIR Links: Profile News Message Board | |
| Charts:- Daily , Weekly | |
| Add MIR to Watchlist: View: Get Complete MIR Trend Analysis ➞ | |
 | DOCN DigitalOcean Holdings, Inc. |
| Sector: Technology | |
| SubSector: Software - Infrastructure | |
| MarketCap: 3620 Millions | |
| Recent Price: 37.00 Smart Investing & Trading Score: 42 | |
| Day Percent Change: -0.86% Day Change: -0.32 | |
| Week Change: 3.04% Year-to-date Change: 0.1% | |
| DOCN Links: Profile News Message Board | |
| Charts:- Daily , Weekly | |
| Add DOCN to Watchlist: View: Get Complete DOCN Trend Analysis ➞ | |
 | GNW Genworth Financial, Inc. |
| Sector: Financials | |
| SubSector: Life Insurance | |
| MarketCap: 1719.76 Millions | |
| Recent Price: 6.68 Smart Investing & Trading Score: 93 | |
| Day Percent Change: 1.37% Day Change: 0.09 | |
| Week Change: 0.91% Year-to-date Change: 0.0% | |
| GNW Links: Profile News Message Board | |
| Charts:- Daily , Weekly | |
| Add GNW to Watchlist: View: Get Complete GNW Trend Analysis ➞ | |
 | OGS ONE Gas, Inc. |
| Sector: Utilities | |
| SubSector: Gas Utilities | |
| MarketCap: 4051.17 Millions | |
| Recent Price: 63.72 Smart Investing & Trading Score: 51 | |
| Day Percent Change: -1.77% Day Change: -1.15 | |
| Week Change: -0.67% Year-to-date Change: 0.0% | |
| OGS Links: Profile News Message Board | |
| Charts:- Daily , Weekly | |
| Add OGS to Watchlist: View: Get Complete OGS Trend Analysis ➞ | |
 | NTST NetSTREIT Corp. |
| Sector: Financials | |
| SubSector: REIT Retail | |
| MarketCap: 51267 Millions | |
| Recent Price: 17.85 Smart Investing & Trading Score: 76 | |
| Day Percent Change: -0.06% Day Change: -0.01 | |
| Week Change: 1.08% Year-to-date Change: -0.1% | |
| NTST Links: Profile News Message Board | |
| Charts:- Daily , Weekly | |
| Add NTST to Watchlist: View: Get Complete NTST Trend Analysis ➞ | |
 | VSH Vishay Intertechnology, Inc. |
| Sector: Technology | |
| SubSector: Semiconductor - Broad Line | |
| MarketCap: 2132.52 Millions | |
| Recent Price: 23.93 Smart Investing & Trading Score: 100 | |
| Day Percent Change: 0.50% Day Change: 0.12 | |
| Week Change: 6.31% Year-to-date Change: -0.2% | |
| VSH Links: Profile News Message Board | |
| Charts:- Daily , Weekly | |
| Add VSH to Watchlist: View: Get Complete VSH Trend Analysis ➞ | |
 | WDFC WD-40 Company |
| Sector: Materials | |
| SubSector: Specialty Chemicals | |
| MarketCap: 2900.57 Millions | |
| Recent Price: 238.67 Smart Investing & Trading Score: 40 | |
| Day Percent Change: -0.05% Day Change: -0.13 | |
| Week Change: 2.84% Year-to-date Change: -0.2% | |
| WDFC Links: Profile News Message Board | |
| Charts:- Daily , Weekly | |
| Add WDFC to Watchlist: View: Get Complete WDFC Trend Analysis ➞ | |
 | FUL H.B. Fuller Company |
| Sector: Materials | |
| SubSector: Specialty Chemicals | |
| MarketCap: 1655.67 Millions | |
| Recent Price: 81.15 Smart Investing & Trading Score: 90 | |
| Day Percent Change: -0.25% Day Change: -0.20 | |
| Week Change: 1.92% Year-to-date Change: -0.3% | |
| FUL Links: Profile News Message Board | |
| Charts:- Daily , Weekly | |
| Add FUL to Watchlist: View: Get Complete FUL Trend Analysis ➞ | |
 | INVA Innoviva, Inc. |
| Sector: Health Care | |
| SubSector: Biotechnology | |
| MarketCap: 1023.15 Millions | |
| Recent Price: 15.98 Smart Investing & Trading Score: 70 | |
| Day Percent Change: 0.00% Day Change: 0.00 | |
| Week Change: 2.44% Year-to-date Change: -0.4% | |
| INVA Links: Profile News Message Board | |
| Charts:- Daily , Weekly | |
| Add INVA to Watchlist: View: Get Complete INVA Trend Analysis ➞ | |
 | FFBC First Financial Bancorp. |
| Sector: Financials | |
| SubSector: Regional - Midwest Banks | |
| MarketCap: 1363.7 Millions | |
| Recent Price: 23.66 Smart Investing & Trading Score: 83 | |
| Day Percent Change: 0.21% Day Change: 0.05 | |
| Week Change: -0.25% Year-to-date Change: -0.4% | |
| FFBC Links: Profile News Message Board | |
| Charts:- Daily , Weekly | |
| Add FFBC to Watchlist: View: Get Complete FFBC Trend Analysis ➞ | |
 | JAMF Jamf Holding Corp. |
| Sector: Technology | |
| SubSector: Software Application | |
| MarketCap: 36987 Millions | |
| Recent Price: 18.00 Smart Investing & Trading Score: 50 | |
| Day Percent Change: 0.84% Day Change: 0.15 | |
| Week Change: -7.74% Year-to-date Change: -0.4% | |
| JAMF Links: Profile News Message Board | |
| Charts:- Daily , Weekly | |
| Add JAMF to Watchlist: View: Get Complete JAMF Trend Analysis ➞ | |
 | PJT PJT Partners Inc. |
| Sector: Financials | |
| SubSector: Asset Management | |
| MarketCap: 1100.93 Millions | |
| Recent Price: 101.22 Smart Investing & Trading Score: 52 | |
| Day Percent Change: 1.65% Day Change: 1.64 | |
| Week Change: -0.04% Year-to-date Change: -0.6% | |
| PJT Links: Profile News Message Board | |
| Charts:- Daily , Weekly | |
| Add PJT to Watchlist: View: Get Complete PJT Trend Analysis ➞ | |
 | ORIC ORIC Pharmaceuticals, Inc. |
| Sector: Health Care | |
| SubSector: Biotechnology | |
| MarketCap: 12787 Millions | |
| Recent Price: 9.16 Smart Investing & Trading Score: 38 | |
| Day Percent Change: 1.55% Day Change: 0.14 | |
| Week Change: 1.89% Year-to-date Change: -0.7% | |
| ORIC Links: Profile News Message Board | |
| Charts:- Daily , Weekly | |
| Add ORIC to Watchlist: View: Get Complete ORIC Trend Analysis ➞ | |
 | CERE Cerevel Therapeutics Holdings, Inc. |
| Sector: Health Care | |
| SubSector: Biotechnology | |
| MarketCap: 21587 Millions | |
| Recent Price: 42.10 Smart Investing & Trading Score: 34 | |
| Day Percent Change: -0.59% Day Change: -0.25 | |
| Week Change: -0.21% Year-to-date Change: -0.7% | |
| CERE Links: Profile News Message Board | |
| Charts:- Daily , Weekly | |
| Add CERE to Watchlist: View: Get Complete CERE Trend Analysis ➞ | |
 | SHOO Steven Madden, Ltd. |
| Sector: Consumer Staples | |
| SubSector: Textile - Apparel Footwear & Accessories | |
| MarketCap: 1756.3 Millions | |
| Recent Price: 41.66 Smart Investing & Trading Score: 32 | |
| Day Percent Change: -0.26% Day Change: -0.11 | |
| Week Change: 0.7% Year-to-date Change: -0.8% | |
| SHOO Links: Profile News Message Board | |
| Charts:- Daily , Weekly | |
| Add SHOO to Watchlist: View: Get Complete SHOO Trend Analysis ➞ | |
 | SONO Sonos, Inc. |
| Sector: Technology | |
| SubSector: Diversified Electronics | |
| MarketCap: 1047.96 Millions | |
| Recent Price: 16.99 Smart Investing & Trading Score: 15 | |
| Day Percent Change: -0.29% Day Change: -0.05 | |
| Week Change: 2.66% Year-to-date Change: -0.9% | |
| SONO Links: Profile News Message Board | |
| Charts:- Daily , Weekly | |
| Add SONO to Watchlist: View: Get Complete SONO Trend Analysis ➞ | |
 | AMSF Amerisafe, Inc. |
| Sector: Financials | |
| SubSector: Property & Casualty Insurance | |
| MarketCap: 1159.32 Millions | |
| Recent Price: 46.37 Smart Investing & Trading Score: 23 | |
| Day Percent Change: -0.13% Day Change: -0.06 | |
| Week Change: -1.07% Year-to-date Change: -0.9% | |
| AMSF Links: Profile News Message Board | |
| Charts:- Daily , Weekly | |
| Add AMSF to Watchlist: View: Get Complete AMSF Trend Analysis ➞ | |
 | NE Noble Corporation Plc |
| Sector: Energy | |
| SubSector: Oil & Gas Drilling | |
| MarketCap: 5520 Millions | |
| Recent Price: 47.71 Smart Investing & Trading Score: 88 | |
| Day Percent Change: 0.08% Day Change: 0.04 | |
| Week Change: 3.58% Year-to-date Change: -0.9% | |
| NE Links: Profile News Message Board | |
| Charts:- Daily , Weekly | |
| Add NE to Watchlist: View: Get Complete NE Trend Analysis ➞ | |
 | SFBS ServisFirst Bancshares, Inc. |
| Sector: Financials | |
| SubSector: Foreign Money Center Banks | |
| MarketCap: 1596.71 Millions | |
| Recent Price: 66.00 Smart Investing & Trading Score: 83 | |
| Day Percent Change: 1.16% Day Change: 0.76 | |
| Week Change: 1.9% Year-to-date Change: -1.0% | |
| SFBS Links: Profile News Message Board | |
| Charts:- Daily , Weekly | |
| Add SFBS to Watchlist: View: Get Complete SFBS Trend Analysis ➞ | |
 | STBA S&T Bancorp, Inc. |
| Sector: Financials | |
| SubSector: Regional - Northeast Banks | |
| MarketCap: 1136.99 Millions | |
| Recent Price: 33.10 Smart Investing & Trading Score: 100 | |
| Day Percent Change: 2.26% Day Change: 0.73 | |
| Week Change: 3.83% Year-to-date Change: -1.0% | |
| STBA Links: Profile News Message Board | |
| Charts:- Daily , Weekly | |
| Add STBA to Watchlist: View: Get Complete STBA Trend Analysis ➞ | |
| For tabular summary view of above stock list: Summary View ➞ 0 - 25 , 25 - 50 , 50 - 75 , 75 - 100 , 100 - 125 , 125 - 150 , 150 - 175 , 175 - 200 , 200 - 225 , 225 - 250 , 250 - 275 , 275 - 300 , 300 - 325 , 325 - 350 , 350 - 375 , 375 - 400 , 400 - 425 , 425 - 450 , 450 - 475 , 475 - 500 , 500 - 525 , 525 - 550 , 550 - 575 , 575 - 600 , 600 - 625 , 625 - 650 , 650 - 675 , 675 - 700 | ||
| Click To Change The Sort Order: By Market Cap or Company Size Performance: Year-to-date, Week and Day | |
| Select Chart Type: | ||
| Too many stocks? View smallcap stocks filtered by marketcap & sector |
| Marketcap: All SmallCap Stocks (default-no microcap), Large, Mid-Range, Small & MicroCap |
| Sector: Tech, Finance, Energy, Staples, Retail, Industrial, Materials, Utilities & Medical |
|
Best Stocks Today 12Stocks.com |
© 2024 12Stocks.com Terms & Conditions Privacy Contact Us
All Information Provided Only For Education And Not To Be Used For Investing or Trading. See Terms & Conditions


One More Thing ... Get Best Stocks Delivered Daily!
Never Ever Miss A Move With Our Top Ten Stocks Lists
Find Best Stocks In Any Market - Bull or Bear Market
Take A Peek At Our Top Ten Stocks Lists: Daily, Weekly, Year-to-Date & Top Trends
Find Best Stocks In Any Market - Bull or Bear Market
Take A Peek At Our Top Ten Stocks Lists: Daily, Weekly, Year-to-Date & Top Trends
Smallcap Stocks With Best Up Trends [0-bearish to 100-bullish]: CommScope Holding[100], Coeur Mining[100], Hecla Mining[100], MicroStrategy [100], Enovix [100], Rayonier Advanced[100], Nurix [100], Energy Fuels[100], NovaGold Resources[100], Piedmont Lithium[100], Wave Life[100]
Best Smallcap Stocks Year-to-Date:
CareMax [495.88%], Bakkt [413.9%], Janux [338.34%], Viking [260.02%], Alpine Immune[241.23%], Longboard [238.63%], Avidity Biosciences[226.33%], Super Micro[212.35%], Arcutis Bio[184.83%], Sweetgreen [180.97%], Novavax [171.04%] Best Smallcap Stocks This Week:
Vaxxinity [58.82%], Novavax [46.51%], Vicarious Surgical[45.62%], Harrow Health[44.48%], ProKidney [44.31%], Workhorse Group[36.06%], Maxeon Solar[35.94%], Fossil Group[35.44%], Humacyte [34.68%], MicroStrategy [34.23%], Cadiz [33.48%] Best Smallcap Stocks Daily:
Vaxxinity [45.95%], Presto Automation[31.90%], Vicarious Surgical[27.93%], Orchestra BioMed[12.77%], CommScope Holding[11.86%], Coeur Mining[11.57%], Hecla Mining[11.11%], MicroStrategy [10.04%], Tenaya [9.65%], Bakkt [9.25%], Enovix [9.25%]