
 Login Sign Up


| |||||
 |  | ||||

| 12Stocks.com Market Intelligence |
Best SmallCap Stocks
|
| In a hurry? Small Cap Stock Lists: Performance Trends Table, Stock Charts
Sort Small Cap stocks: Daily, Weekly, Year-to-Date, Market Cap & Trends. Filter Small Cap stocks list by sector: Show all, Tech, Finance, Energy, Staples, Retail, Industrial, Materials, Utilities and HealthCare Filter Small Cap stocks list by size: All Large Medium Small and MicroCap |
| 12Stocks.com Small Cap Stocks Performances & Trends Daily | |||||||||
|
|  The overall Smart Investing & Trading Score is 76 (0-bearish to 100-bullish) which puts Small Cap index in short term neutral to bullish trend. The Smart Investing & Trading Score from previous trading session is 90 and hence a deterioration of trend.
| ||||||||
Here are the Smart Investing & Trading Scores of the most requested small cap stocks at 12Stocks.com (click stock name for detailed review):
|


| 12Stocks.com: Investing in Smallcap Index with Stocks | |
|
The following table helps investors and traders sort through current performance and trends (as measured by Smart Investing & Trading Score) of various
stocks in the Smallcap Index. Quick View: Move mouse or cursor over stock symbol (ticker) to view short-term technical chart and over stock name to view long term chart. Click on  to add stock symbol to your watchlist and to add stock symbol to your watchlist and  to view watchlist. Click on any ticker or stock name for detailed market intelligence report for that stock. to view watchlist. Click on any ticker or stock name for detailed market intelligence report for that stock. |
12Stocks.com Performance of Stocks in Smallcap Index
| Ticker | Stock Name | Watchlist | Category | Recent Price | Smart Investing & Trading Score | Change % | YTD Change% |
| BDN | Brandywine Realty |   | Financials | 4.81 | 68 | -1.64% | -10.93% |
| NSP | Insperity | | Services & Goods | 104.21 | 83 | -0.97% | -11.10% |
| IRTC | iRhythm | | Health Care | 94.83 | 0 | -3.92% | -11.41% |
| PECO | Phillips Edison | | Financials | 32.60 | 18 | -0.15% | -11.49% |
| RLJ | RLJ Lodging | | Financials | 10.37 | 25 | -1.24% | -11.52% |
| SAFE | Safehold | | Financials | 20.69 | 88 | 1.47% | -11.58% |
| WERN | Werner Enterprises | | Transports | 37.35 | 50 | -2.10% | -11.85% |
| RXO | RXO | | Industrials | 20.58 | 32 | -2.60% | -11.94% |
| APPN | Appian | | Technology | 33.15 | 17 | -0.66% | -11.98% |
| APLE | Apple Hospitality | | Financials | 14.61 | 17 | -0.75% | -12.04% |
| BANR | Banner | | Financials | 47.06 | 88 | 1.05% | -12.14% |
| ZYME | Zymeworks | | Health Care | 9.12 | 40 | -2.77% | -12.22% |
| RAMP | LiveRamp | | Technology | 33.16 | 57 | 0.00% | -12.46% |
| LCII | LCI Industries | | Consumer Staples | 109.92 | 32 | -0.82% | -12.56% |
| OPK | OPKO Health | | Health Care | 1.32 | 78 | 1.54% | -12.58% |
| TNET | TriNet Group | | Services & Goods | 103.92 | 42 | 0.71% | -12.62% |
| BHVN | Biohaven Pharmaceutical | | Health Care | 37.37 | 35 | -2.81% | -12.69% |
| MSEX | Middlesex Water | | Utilities | 57.21 | 76 | -0.81% | -12.82% |
| ALKS | Alkermes | | Health Care | 24.15 | 24 | -1.27% | -12.94% |
| JBGS | JBG SMITH | | Financials | 14.80 | 37 | -0.80% | -12.99% |
| SSTK | Shutterstock | | Services & Goods | 41.94 | 27 | -0.19% | -13.13% |
| KLIC | Kulicke and | | Technology | 47.51 | 55 | -0.96% | -13.18% |
| SKIN | Beauty Health | | Consumer Staples | 2.74 | 20 | -1.08% | -13.43% |
| CORT | Corcept | | Health Care | 28.09 | 90 | 2.00% | -13.52% |
| IPAR | Inter Parfums | | Consumer Staples | 124.50 | 59 | -0.65% | -13.55% |
| For chart view version of above stock list: Chart View ➞ 0 - 25 , 25 - 50 , 50 - 75 , 75 - 100 , 100 - 125 , 125 - 150 , 150 - 175 , 175 - 200 , 200 - 225 , 225 - 250 , 250 - 275 , 275 - 300 , 300 - 325 , 325 - 350 , 350 - 375 , 375 - 400 , 400 - 425 , 425 - 450 , 450 - 475 , 475 - 500 , 500 - 525 , 525 - 550 , 550 - 575 , 575 - 600 , 600 - 625 , 625 - 650 , 650 - 675 , 675 - 700 | ||
 | Click To Change The Sort Order: By Market Cap or Company Size Performance: Year-to-date, Week and Day |  |
| Too many stocks? View smallcap stocks filtered by marketcap & sector |
| Marketcap: All SmallCap Stocks (default-no microcap), Large, Mid-Range, Small |
| Smallcap Sector: Tech, Finance, Energy, Staples, Retail, Industrial, Materials, & Medical |
|
Get the most comprehensive stock market coverage daily at 12Stocks.com ➞ Best Stocks Today ➞ Best Stocks Weekly ➞ Best Stocks Year-to-Date ➞ Best Stocks Trends ➞  Best Stocks Today 12Stocks.com Best Nasdaq Stocks ➞ Best S&P 500 Stocks ➞ Best Tech Stocks ➞ Best Biotech Stocks ➞ |
| Detailed Overview of SmallCap Stocks |
| SmallCap Technical Overview, Leaders & Laggards, Top SmallCap ETF Funds & Detailed SmallCap Stocks List, Charts, Trends & More |
| Smallcap: Technical Analysis, Trends & YTD Performance | |
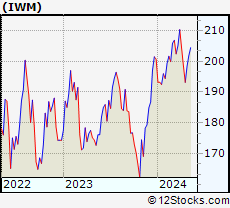
| SmallCap segment as represented by
IWM, an exchange-traded fund [ETF], holds basket of thousands of smallcap stocks from across all major sectors of the US stock market. The smallcap index (contains stocks like Riverbed & Sotheby's) is up by 3.67% and is currently underperforming the overall market by -6.9% year-to-date. Below is a quick view of technical charts and trends: | |
 IWM Weekly Chart |
|
| Long Term Trend: Very Good | |
| Medium Term Trend: Very Good | |
 IWM Daily Chart |
|
| Short Term Trend: Good | |
| Overall Trend Score: 76 | |
| YTD Performance: 3.67% | |
| **Trend Scores & Views Are Only For Educational Purposes And Not For Investing | |
| 12Stocks.com: Top Performing Small Cap Index Stocks | ||||||||||||||||||||||||||||||||||||||||||||||||
 The top performing Small Cap Index stocks year to date are
Now, more recently, over last week, the top performing Small Cap Index stocks on the move are


|
||||||||||||||||||||||||||||||||||||||||||||||||
| 12Stocks.com: Investing in Smallcap Index using Exchange Traded Funds | |
|
The following table shows list of key exchange traded funds (ETF) that
help investors track Smallcap index. The following list also includes leveraged ETF funds that track twice or thrice the daily returns of Smallcap indices. Short or inverse ETF funds move in the opposite direction to the index they track and are useful during market pullbacks or during bear markets. Quick View: Move mouse or cursor over ETF symbol (ticker) to view short-term technical chart and over ETF name to view long term chart. Click on ticker or stock name for detailed view. Click on to add stock symbol to your watchlist and to view watchlist. |
12Stocks.com List of ETFs that track Smallcap Index
| Ticker | ETF Name | Watchlist | Recent Price | Smart Investing & Trading Score | Change % | Week % | Year-to-date % |
| IWM | iShares Russell 2000 | | 208.08 | 76 | 0.07 | 1.85 | 3.67% |
| VTWO | Vanguard Russell 2000 ETF | | 84.11 | 71 | 0.00 | 1.8 | 3.71% |
| IJR | iShares Core S&P Small-Cap | | 110.39 | 68 | -0.22 | 1.29 | 1.98% |
| IWN | iShares Russell 2000 Value | | 158.71 | 76 | -0.07 | 1.61 | 2.18% |
| IWO | iShares Russell 2000 Growth | | 265.15 | 63 | -0.75 | 2.01 | 5.13% |
| IJS | iShares S&P Small-Cap 600 Value | | 101.87 | 76 | -0.15 | 1.34 | -1.16% |
| IJT | iShares S&P Small-Cap 600 Growth | | 131.34 | 71 | 0.04 | 1.14 | 4.95% |
| XSLV | PowerShares S&P SmallCap Low Volatil ETF | | 44.48 | 83 | -0.01 | 0.55 | 0.74% |
| SAA | ProShares Ultra SmallCap600 | | 24.90 | 71 | 0.50 | 2.28 | -0.18% |
| SMLV | SPDR SSGA US Small Cap Low Volatil ETF | | 113.28 | 95 | 0.43 | 1.85 | 0.68% |
| SDD | ProShares UltraShort SmallCap600 | | 17.84 | 35 | 0.96 | -2.41 | -3.19% |
| SBB | ProShares Short SmallCap600 | | 15.77 | 25 | 0.41 | -1.14 | -0.98% |
| 12Stocks.com: Charts, Trends, Fundamental Data and Performances of SmallCap Stocks | |
|
We now take in-depth look at all SmallCap stocks including charts, multi-period performances and overall trends (as measured by Smart Investing & Trading Score). One can sort SmallCap stocks (click link to choose) by Daily, Weekly and by Year-to-Date performances. Also, one can sort by size of the company or by market capitalization. |
| Select Your Default Chart Type: | |||||
| |||||
| Click on stock symbol or name for detailed view. Click on to add stock symbol to your watchlist and to view watchlist. Quick View: Move mouse or cursor over "Daily" to quickly view daily technical stock chart and over "Weekly" to view weekly technical stock chart. | |||||

 | BDN Brandywine Realty Trust |
| Sector: Financials | |
| SubSector: REIT - Diversified | |
| MarketCap: 1688.13 Millions | |
| Recent Price: 4.81 Smart Investing & Trading Score: 68 | |
| Day Percent Change: -1.64% Day Change: -0.08 | |
| Week Change: 2.12% Year-to-date Change: -10.9% | |
| BDN Links: Profile News Message Board | |
| Charts:- Daily , Weekly | |
| Add BDN to Watchlist: View: Get Complete BDN Trend Analysis ➞ | |
 | NSP Insperity, Inc. |
| Sector: Services & Goods | |
| SubSector: Business Services | |
| MarketCap: 1385.32 Millions | |
| Recent Price: 104.21 Smart Investing & Trading Score: 83 | |
| Day Percent Change: -0.97% Day Change: -1.02 | |
| Week Change: -0.89% Year-to-date Change: -11.1% | |
| NSP Links: Profile News Message Board | |
| Charts:- Daily , Weekly | |
| Add NSP to Watchlist: View: Get Complete NSP Trend Analysis ➞ | |
 | IRTC iRhythm Technologies, Inc. |
| Sector: Health Care | |
| SubSector: Medical Instruments & Supplies | |
| MarketCap: 2167.9 Millions | |
| Recent Price: 94.83 Smart Investing & Trading Score: 0 | |
| Day Percent Change: -3.92% Day Change: -3.87 | |
| Week Change: -4.22% Year-to-date Change: -11.4% | |
| IRTC Links: Profile News Message Board | |
| Charts:- Daily , Weekly | |
| Add IRTC to Watchlist: View: Get Complete IRTC Trend Analysis ➞ | |
 | PECO Phillips Edison & Company, Inc. |
| Sector: Financials | |
| SubSector: REIT - Retail | |
| MarketCap: 3920 Millions | |
| Recent Price: 32.60 Smart Investing & Trading Score: 18 | |
| Day Percent Change: -0.15% Day Change: -0.05 | |
| Week Change: -0.88% Year-to-date Change: -11.5% | |
| PECO Links: Profile News Message Board | |
| Charts:- Daily , Weekly | |
| Add PECO to Watchlist: View: Get Complete PECO Trend Analysis ➞ | |
 | RLJ RLJ Lodging Trust |
| Sector: Financials | |
| SubSector: REIT - Hotel/Motel | |
| MarketCap: 1019.34 Millions | |
| Recent Price: 10.37 Smart Investing & Trading Score: 25 | |
| Day Percent Change: -1.24% Day Change: -0.13 | |
| Week Change: 0.39% Year-to-date Change: -11.5% | |
| RLJ Links: Profile News Message Board | |
| Charts:- Daily , Weekly | |
| Add RLJ to Watchlist: View: Get Complete RLJ Trend Analysis ➞ | |
 | SAFE Safehold Inc. |
| Sector: Financials | |
| SubSector: REIT - Diversified | |
| MarketCap: 2994.63 Millions | |
| Recent Price: 20.69 Smart Investing & Trading Score: 88 | |
| Day Percent Change: 1.47% Day Change: 0.30 | |
| Week Change: 7.62% Year-to-date Change: -11.6% | |
| SAFE Links: Profile News Message Board | |
| Charts:- Daily , Weekly | |
| Add SAFE to Watchlist: View: Get Complete SAFE Trend Analysis ➞ | |
 | WERN Werner Enterprises, Inc. |
| Sector: Transports | |
| SubSector: Trucking | |
| MarketCap: 2409.65 Millions | |
| Recent Price: 37.35 Smart Investing & Trading Score: 50 | |
| Day Percent Change: -2.10% Day Change: -0.80 | |
| Week Change: 0.4% Year-to-date Change: -11.9% | |
| WERN Links: Profile News Message Board | |
| Charts:- Daily , Weekly | |
| Add WERN to Watchlist: View: Get Complete WERN Trend Analysis ➞ | |
 | RXO RXO, Inc. |
| Sector: Industrials | |
| SubSector: Trucking | |
| MarketCap: 2550 Millions | |
| Recent Price: 20.58 Smart Investing & Trading Score: 32 | |
| Day Percent Change: -2.60% Day Change: -0.55 | |
| Week Change: -0.39% Year-to-date Change: -11.9% | |
| RXO Links: Profile News Message Board | |
| Charts:- Daily , Weekly | |
| Add RXO to Watchlist: View: Get Complete RXO Trend Analysis ➞ | |
 | APPN Appian Corporation |
| Sector: Technology | |
| SubSector: Application Software | |
| MarketCap: 2737.92 Millions | |
| Recent Price: 33.15 Smart Investing & Trading Score: 17 | |
| Day Percent Change: -0.66% Day Change: -0.22 | |
| Week Change: 3.43% Year-to-date Change: -12.0% | |
| APPN Links: Profile News Message Board | |
| Charts:- Daily , Weekly | |
| Add APPN to Watchlist: View: Get Complete APPN Trend Analysis ➞ | |
 | APLE Apple Hospitality REIT, Inc. |
| Sector: Financials | |
| SubSector: REIT - Hotel/Motel | |
| MarketCap: 1515.74 Millions | |
| Recent Price: 14.61 Smart Investing & Trading Score: 17 | |
| Day Percent Change: -0.75% Day Change: -0.11 | |
| Week Change: -1.55% Year-to-date Change: -12.0% | |
| APLE Links: Profile News Message Board | |
| Charts:- Daily , Weekly | |
| Add APLE to Watchlist: View: Get Complete APLE Trend Analysis ➞ | |
 | BANR Banner Corporation |
| Sector: Financials | |
| SubSector: Regional - Mid-Atlantic Banks | |
| MarketCap: 1187.09 Millions | |
| Recent Price: 47.06 Smart Investing & Trading Score: 88 | |
| Day Percent Change: 1.05% Day Change: 0.49 | |
| Week Change: 1.31% Year-to-date Change: -12.1% | |
| BANR Links: Profile News Message Board | |
| Charts:- Daily , Weekly | |
| Add BANR to Watchlist: View: Get Complete BANR Trend Analysis ➞ | |
 | ZYME Zymeworks Inc. |
| Sector: Health Care | |
| SubSector: Biotechnology | |
| MarketCap: 1373.55 Millions | |
| Recent Price: 9.12 Smart Investing & Trading Score: 40 | |
| Day Percent Change: -2.77% Day Change: -0.26 | |
| Week Change: 3.52% Year-to-date Change: -12.2% | |
| ZYME Links: Profile News Message Board | |
| Charts:- Daily , Weekly | |
| Add ZYME to Watchlist: View: Get Complete ZYME Trend Analysis ➞ | |
 | RAMP LiveRamp Holdings, Inc. |
| Sector: Technology | |
| SubSector: Information Technology Services | |
| MarketCap: 2124.38 Millions | |
| Recent Price: 33.16 Smart Investing & Trading Score: 57 | |
| Day Percent Change: 0.00% Day Change: 0.00 | |
| Week Change: 2.35% Year-to-date Change: -12.5% | |
| RAMP Links: Profile News Message Board | |
| Charts:- Daily , Weekly | |
| Add RAMP to Watchlist: View: Get Complete RAMP Trend Analysis ➞ | |
 | LCII LCI Industries |
| Sector: Consumer Staples | |
| SubSector: Recreational Vehicles | |
| MarketCap: 1663.59 Millions | |
| Recent Price: 109.92 Smart Investing & Trading Score: 32 | |
| Day Percent Change: -0.82% Day Change: -0.91 | |
| Week Change: -4.98% Year-to-date Change: -12.6% | |
| LCII Links: Profile News Message Board | |
| Charts:- Daily , Weekly | |
| Add LCII to Watchlist: View: Get Complete LCII Trend Analysis ➞ | |
 | OPK OPKO Health, Inc. |
| Sector: Health Care | |
| SubSector: Biotechnology | |
| MarketCap: 1116.05 Millions | |
| Recent Price: 1.32 Smart Investing & Trading Score: 78 | |
| Day Percent Change: 1.54% Day Change: 0.02 | |
| Week Change: 3.13% Year-to-date Change: -12.6% | |
| OPK Links: Profile News Message Board | |
| Charts:- Daily , Weekly | |
| Add OPK to Watchlist: View: Get Complete OPK Trend Analysis ➞ | |
 | TNET TriNet Group, Inc. |
| Sector: Services & Goods | |
| SubSector: Business Services | |
| MarketCap: 2648.72 Millions | |
| Recent Price: 103.92 Smart Investing & Trading Score: 42 | |
| Day Percent Change: 0.71% Day Change: 0.73 | |
| Week Change: 0.44% Year-to-date Change: -12.6% | |
| TNET Links: Profile News Message Board | |
| Charts:- Daily , Weekly | |
| Add TNET to Watchlist: View: Get Complete TNET Trend Analysis ➞ | |
 | BHVN Biohaven Pharmaceutical Holding Company Ltd. |
| Sector: Health Care | |
| SubSector: Biotechnology | |
| MarketCap: 2024.25 Millions | |
| Recent Price: 37.37 Smart Investing & Trading Score: 35 | |
| Day Percent Change: -2.81% Day Change: -1.08 | |
| Week Change: 6.82% Year-to-date Change: -12.7% | |
| BHVN Links: Profile News Message Board | |
| Charts:- Daily , Weekly | |
| Add BHVN to Watchlist: View: Get Complete BHVN Trend Analysis ➞ | |
 | MSEX Middlesex Water Company |
| Sector: Utilities | |
| SubSector: Water Utilities | |
| MarketCap: 1082.02 Millions | |
| Recent Price: 57.21 Smart Investing & Trading Score: 76 | |
| Day Percent Change: -0.81% Day Change: -0.47 | |
| Week Change: -1.16% Year-to-date Change: -12.8% | |
| MSEX Links: Profile News Message Board | |
| Charts:- Daily , Weekly | |
| Add MSEX to Watchlist: View: Get Complete MSEX Trend Analysis ➞ | |
 | ALKS Alkermes plc |
| Sector: Health Care | |
| SubSector: Biotechnology | |
| MarketCap: 2311.95 Millions | |
| Recent Price: 24.15 Smart Investing & Trading Score: 24 | |
| Day Percent Change: -1.27% Day Change: -0.31 | |
| Week Change: 0.42% Year-to-date Change: -12.9% | |
| ALKS Links: Profile News Message Board | |
| Charts:- Daily , Weekly | |
| Add ALKS to Watchlist: View: Get Complete ALKS Trend Analysis ➞ | |
 | JBGS JBG SMITH Properties |
| Sector: Financials | |
| SubSector: Property Management | |
| MarketCap: 4335.32 Millions | |
| Recent Price: 14.80 Smart Investing & Trading Score: 37 | |
| Day Percent Change: -0.80% Day Change: -0.12 | |
| Week Change: 2.07% Year-to-date Change: -13.0% | |
| JBGS Links: Profile News Message Board | |
| Charts:- Daily , Weekly | |
| Add JBGS to Watchlist: View: Get Complete JBGS Trend Analysis ➞ | |
 | SSTK Shutterstock, Inc. |
| Sector: Services & Goods | |
| SubSector: Business Services | |
| MarketCap: 1409.62 Millions | |
| Recent Price: 41.94 Smart Investing & Trading Score: 27 | |
| Day Percent Change: -0.19% Day Change: -0.08 | |
| Week Change: 3.3% Year-to-date Change: -13.1% | |
| SSTK Links: Profile News Message Board | |
| Charts:- Daily , Weekly | |
| Add SSTK to Watchlist: View: Get Complete SSTK Trend Analysis ➞ | |
 | KLIC Kulicke and Soffa Industries, Inc. |
| Sector: Technology | |
| SubSector: Semiconductor Equipment & Materials | |
| MarketCap: 1336.68 Millions | |
| Recent Price: 47.51 Smart Investing & Trading Score: 55 | |
| Day Percent Change: -0.96% Day Change: -0.46 | |
| Week Change: -1.25% Year-to-date Change: -13.2% | |
| KLIC Links: Profile News Message Board | |
| Charts:- Daily , Weekly | |
| Add KLIC to Watchlist: View: Get Complete KLIC Trend Analysis ➞ | |
 | SKIN The Beauty Health Company |
| Sector: Consumer Staples | |
| SubSector: Household & Personal Products | |
| MarketCap: 1070 Millions | |
| Recent Price: 2.74 Smart Investing & Trading Score: 20 | |
| Day Percent Change: -1.08% Day Change: -0.03 | |
| Week Change: 0% Year-to-date Change: -13.4% | |
| SKIN Links: Profile News Message Board | |
| Charts:- Daily , Weekly | |
| Add SKIN to Watchlist: View: Get Complete SKIN Trend Analysis ➞ | |
 | CORT Corcept Therapeutics Incorporated |
| Sector: Health Care | |
| SubSector: Biotechnology | |
| MarketCap: 1228.45 Millions | |
| Recent Price: 28.09 Smart Investing & Trading Score: 90 | |
| Day Percent Change: 2.00% Day Change: 0.55 | |
| Week Change: 3.88% Year-to-date Change: -13.5% | |
| CORT Links: Profile News Message Board | |
| Charts:- Daily , Weekly | |
| Add CORT to Watchlist: View: Get Complete CORT Trend Analysis ➞ | |
 | IPAR Inter Parfums, Inc. |
| Sector: Consumer Staples | |
| SubSector: Personal Products | |
| MarketCap: 1302.55 Millions | |
| Recent Price: 124.50 Smart Investing & Trading Score: 59 | |
| Day Percent Change: -0.65% Day Change: -0.82 | |
| Week Change: 2.03% Year-to-date Change: -13.6% | |
| IPAR Links: Profile News Message Board | |
| Charts:- Daily , Weekly | |
| Add IPAR to Watchlist: View: Get Complete IPAR Trend Analysis ➞ | |
| For tabular summary view of above stock list: Summary View ➞ 0 - 25 , 25 - 50 , 50 - 75 , 75 - 100 , 100 - 125 , 125 - 150 , 150 - 175 , 175 - 200 , 200 - 225 , 225 - 250 , 250 - 275 , 275 - 300 , 300 - 325 , 325 - 350 , 350 - 375 , 375 - 400 , 400 - 425 , 425 - 450 , 450 - 475 , 475 - 500 , 500 - 525 , 525 - 550 , 550 - 575 , 575 - 600 , 600 - 625 , 625 - 650 , 650 - 675 , 675 - 700 | ||
| Click To Change The Sort Order: By Market Cap or Company Size Performance: Year-to-date, Week and Day | |
| Select Chart Type: | ||
| Too many stocks? View smallcap stocks filtered by marketcap & sector |
| Marketcap: All SmallCap Stocks (default-no microcap), Large, Mid-Range, Small & MicroCap |
| Sector: Tech, Finance, Energy, Staples, Retail, Industrial, Materials, Utilities & Medical |
|
Best Stocks Today 12Stocks.com |
© 2024 12Stocks.com Terms & Conditions Privacy Contact Us
All Information Provided Only For Education And Not To Be Used For Investing or Trading. See Terms & Conditions


One More Thing ... Get Best Stocks Delivered Daily!
Never Ever Miss A Move With Our Top Ten Stocks Lists
Find Best Stocks In Any Market - Bull or Bear Market
Take A Peek At Our Top Ten Stocks Lists: Daily, Weekly, Year-to-Date & Top Trends
Find Best Stocks In Any Market - Bull or Bear Market
Take A Peek At Our Top Ten Stocks Lists: Daily, Weekly, Year-to-Date & Top Trends
Smallcap Stocks With Best Up Trends [0-bearish to 100-bullish]: CommScope Holding[100], Coeur Mining[100], Hecla Mining[100], MicroStrategy [100], Enovix [100], Rayonier Advanced[100], Nurix [100], Energy Fuels[100], NovaGold Resources[100], Piedmont Lithium[100], Wave Life[100]
Best Smallcap Stocks Year-to-Date:
CareMax [495.88%], Bakkt [413.9%], Janux [338.34%], Viking [260.02%], Alpine Immune[241.23%], Longboard [238.63%], Avidity Biosciences[226.33%], Super Micro[212.35%], Arcutis Bio[184.83%], Sweetgreen [180.97%], Novavax [171.04%] Best Smallcap Stocks This Week:
Vaxxinity [58.82%], Novavax [46.51%], Vicarious Surgical[45.62%], Harrow Health[44.48%], ProKidney [44.31%], Workhorse Group[36.06%], Maxeon Solar[35.94%], Fossil Group[35.44%], Humacyte [34.68%], MicroStrategy [34.23%], Cadiz [33.48%] Best Smallcap Stocks Daily:
Vaxxinity [45.95%], Presto Automation[31.90%], Vicarious Surgical[27.93%], Orchestra BioMed[12.77%], CommScope Holding[11.86%], Coeur Mining[11.57%], Hecla Mining[11.11%], MicroStrategy [10.04%], Tenaya [9.65%], Bakkt [9.25%], Enovix [9.25%]