
 Login Sign Up


| |||||
 |  | ||||

| 12Stocks.com Market Intelligence |
Best SmallCap Stocks
|
| In a hurry? Small Cap Stock Lists: Performance Trends Table, Stock Charts
Sort Small Cap stocks: Daily, Weekly, Year-to-Date, Market Cap & Trends. Filter Small Cap stocks list by sector: Show all, Tech, Finance, Energy, Staples, Retail, Industrial, Materials, Utilities and HealthCare Filter Small Cap stocks list by size: All Large Medium Small and MicroCap |
| 12Stocks.com Small Cap Stocks Performances & Trends Daily | |||||||||
|
|  The overall Smart Investing & Trading Score is 76 (0-bearish to 100-bullish) which puts Small Cap index in short term neutral to bullish trend. The Smart Investing & Trading Score from previous trading session is 90 and hence a deterioration of trend.
| ||||||||
Here are the Smart Investing & Trading Scores of the most requested small cap stocks at 12Stocks.com (click stock name for detailed review):
|


| 12Stocks.com: Investing in Smallcap Index with Stocks | |
|
The following table helps investors and traders sort through current performance and trends (as measured by Smart Investing & Trading Score) of various
stocks in the Smallcap Index. Quick View: Move mouse or cursor over stock symbol (ticker) to view short-term technical chart and over stock name to view long term chart. Click on  to add stock symbol to your watchlist and to add stock symbol to your watchlist and  to view watchlist. Click on any ticker or stock name for detailed market intelligence report for that stock. to view watchlist. Click on any ticker or stock name for detailed market intelligence report for that stock. |
12Stocks.com Performance of Stocks in Smallcap Index
| Ticker | Stock Name | Watchlist | Category | Recent Price | Smart Investing & Trading Score | Change % | YTD Change% |
| CRGY | Crescent Energy |   | Energy | 12.02 | 68 | 3.26% | -8.87% |
| BNL | Broadstone Net | | Financials | 15.69 | 83 | 0.26% | -8.89% |
| DIOD | Diodes | | Technology | 73.27 | 93 | 1.19% | -9.00% |
| AVDX | AvidXchange | | Technology | 11.29 | 25 | 0.09% | -9.06% |
| AVNS | Avanos Medical | | Health Care | 20.39 | 95 | -0.15% | -9.09% |
| MNRO | Monro | | Consumer Staples | 26.65 | 17 | -3.76% | -9.17% |
| FIBK | First Interstate | | Financials | 27.89 | 83 | 0.87% | -9.30% |
| LNN | Lindsay | | Industrials | 117.05 | 35 | -0.78% | -9.38% |
| CIM | Chimera | | Financials | 4.52 | 83 | -0.88% | -9.42% |
| DEA | Easterly Government | | Financials | 12.17 | 75 | 0.00% | -9.45% |
| PDCO | Patterson | | Services & Goods | 25.76 | 38 | -0.35% | -9.46% |
| HOPE | Hope Bancorp | | Financials | 10.93 | 67 | 0.55% | -9.52% |
| BEAM | Beam | | Health Care | 24.62 | 64 | 3.49% | -9.55% |
| GT | Goodyear Tire | | Consumer Staples | 12.95 | 58 | -1.52% | -9.57% |
| CRC | California Resources | | Energy | 49.40 | 32 | 0.30% | -9.66% |
| HELE | Helen of Troy | | Consumer Staples | 108.88 | 45 | 0.74% | -9.88% |
| HRMY | Harmony Biosciences | | Health Care | 29.03 | 10 | -0.96% | -10.10% |
| NREF | NexPoint Real | | Financials | 14.13 | 87 | 0.07% | -10.20% |
| BGS | B&G Foods | | Consumer Staples | 9.40 | 32 | -1.57% | -10.48% |
| LXP | Lexington Realty | | Financials | 8.87 | 83 | -0.56% | -10.58% |
| ROG | Rogers | | Technology | 117.99 | 48 | -1.43% | -10.66% |
| WABC | Westamerica Ban | | Financials | 50.37 | 100 | 0.90% | -10.71% |
| PCH | PotlatchDeltic | | Industrials | 43.83 | 42 | -0.43% | -10.73% |
| ARI | Apollo Commercial | | Financials | 10.48 | 49 | 2.24% | -10.73% |
| RGNX | REGENXBIO | | Health Care | 15.99 | 35 | -0.12% | -10.92% |
| For chart view version of above stock list: Chart View ➞ 0 - 25 , 25 - 50 , 50 - 75 , 75 - 100 , 100 - 125 , 125 - 150 , 150 - 175 , 175 - 200 , 200 - 225 , 225 - 250 , 250 - 275 , 275 - 300 , 300 - 325 , 325 - 350 , 350 - 375 , 375 - 400 , 400 - 425 , 425 - 450 , 450 - 475 , 475 - 500 , 500 - 525 , 525 - 550 , 550 - 575 , 575 - 600 , 600 - 625 , 625 - 650 , 650 - 675 , 675 - 700 | ||
 | Click To Change The Sort Order: By Market Cap or Company Size Performance: Year-to-date, Week and Day |  |
| Too many stocks? View smallcap stocks filtered by marketcap & sector |
| Marketcap: All SmallCap Stocks (default-no microcap), Large, Mid-Range, Small |
| Smallcap Sector: Tech, Finance, Energy, Staples, Retail, Industrial, Materials, & Medical |
|
Get the most comprehensive stock market coverage daily at 12Stocks.com ➞ Best Stocks Today ➞ Best Stocks Weekly ➞ Best Stocks Year-to-Date ➞ Best Stocks Trends ➞  Best Stocks Today 12Stocks.com Best Nasdaq Stocks ➞ Best S&P 500 Stocks ➞ Best Tech Stocks ➞ Best Biotech Stocks ➞ |
| Detailed Overview of SmallCap Stocks |
| SmallCap Technical Overview, Leaders & Laggards, Top SmallCap ETF Funds & Detailed SmallCap Stocks List, Charts, Trends & More |
| Smallcap: Technical Analysis, Trends & YTD Performance | |
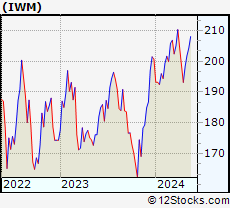
| SmallCap segment as represented by
IWM, an exchange-traded fund [ETF], holds basket of thousands of smallcap stocks from across all major sectors of the US stock market. The smallcap index (contains stocks like Riverbed & Sotheby's) is up by 3.67% and is currently underperforming the overall market by -6.9% year-to-date. Below is a quick view of technical charts and trends: | |
 IWM Weekly Chart |
|
| Long Term Trend: Very Good | |
| Medium Term Trend: Very Good | |
 IWM Daily Chart |
|
| Short Term Trend: Good | |
| Overall Trend Score: 76 | |
| YTD Performance: 3.67% | |
| **Trend Scores & Views Are Only For Educational Purposes And Not For Investing | |
| 12Stocks.com: Top Performing Small Cap Index Stocks | ||||||||||||||||||||||||||||||||||||||||||||||||
 The top performing Small Cap Index stocks year to date are
Now, more recently, over last week, the top performing Small Cap Index stocks on the move are


|
||||||||||||||||||||||||||||||||||||||||||||||||
| 12Stocks.com: Investing in Smallcap Index using Exchange Traded Funds | |
|
The following table shows list of key exchange traded funds (ETF) that
help investors track Smallcap index. The following list also includes leveraged ETF funds that track twice or thrice the daily returns of Smallcap indices. Short or inverse ETF funds move in the opposite direction to the index they track and are useful during market pullbacks or during bear markets. Quick View: Move mouse or cursor over ETF symbol (ticker) to view short-term technical chart and over ETF name to view long term chart. Click on ticker or stock name for detailed view. Click on to add stock symbol to your watchlist and to view watchlist. |
12Stocks.com List of ETFs that track Smallcap Index
| Ticker | ETF Name | Watchlist | Recent Price | Smart Investing & Trading Score | Change % | Week % | Year-to-date % |
| IWM | iShares Russell 2000 | | 208.08 | 76 | 0.07 | 1.85 | 3.67% |
| VTWO | Vanguard Russell 2000 ETF | | 84.11 | 71 | 0.00 | 1.8 | 3.71% |
| IJR | iShares Core S&P Small-Cap | | 110.39 | 68 | -0.22 | 1.29 | 1.98% |
| IWN | iShares Russell 2000 Value | | 158.71 | 76 | -0.07 | 1.61 | 2.18% |
| IWO | iShares Russell 2000 Growth | | 265.15 | 63 | -0.75 | 2.01 | 5.13% |
| IJS | iShares S&P Small-Cap 600 Value | | 101.87 | 76 | -0.15 | 1.34 | -1.16% |
| IJT | iShares S&P Small-Cap 600 Growth | | 131.34 | 71 | 0.04 | 1.14 | 4.95% |
| XSLV | PowerShares S&P SmallCap Low Volatil ETF | | 44.48 | 83 | -0.01 | 0.55 | 0.74% |
| SAA | ProShares Ultra SmallCap600 | | 24.90 | 71 | 0.50 | 2.28 | -0.18% |
| SMLV | SPDR SSGA US Small Cap Low Volatil ETF | | 113.28 | 95 | 0.43 | 1.85 | 0.68% |
| SDD | ProShares UltraShort SmallCap600 | | 17.84 | 35 | 0.96 | -2.41 | -3.19% |
| SBB | ProShares Short SmallCap600 | | 15.77 | 25 | 0.41 | -1.14 | -0.98% |
| 12Stocks.com: Charts, Trends, Fundamental Data and Performances of SmallCap Stocks | |
|
We now take in-depth look at all SmallCap stocks including charts, multi-period performances and overall trends (as measured by Smart Investing & Trading Score). One can sort SmallCap stocks (click link to choose) by Daily, Weekly and by Year-to-Date performances. Also, one can sort by size of the company or by market capitalization. |
| Select Your Default Chart Type: | |||||
| |||||
| Click on stock symbol or name for detailed view. Click on to add stock symbol to your watchlist and to view watchlist. Quick View: Move mouse or cursor over "Daily" to quickly view daily technical stock chart and over "Weekly" to view weekly technical stock chart. | |||||

 | CRGY Crescent Energy Company |
| Sector: Energy | |
| SubSector: Oil & Gas E&P | |
| MarketCap: 1700 Millions | |
| Recent Price: 12.02 Smart Investing & Trading Score: 68 | |
| Day Percent Change: 3.26% Day Change: 0.38 | |
| Week Change: -1.15% Year-to-date Change: -8.9% | |
| CRGY Links: Profile News Message Board | |
| Charts:- Daily , Weekly | |
| Add CRGY to Watchlist: View: Get Complete CRGY Trend Analysis ➞ | |
 | BNL Broadstone Net Lease, Inc. |
| Sector: Financials | |
| SubSector: REIT Diversified | |
| MarketCap: 27267 Millions | |
| Recent Price: 15.69 Smart Investing & Trading Score: 83 | |
| Day Percent Change: 0.26% Day Change: 0.04 | |
| Week Change: 2.95% Year-to-date Change: -8.9% | |
| BNL Links: Profile News Message Board | |
| Charts:- Daily , Weekly | |
| Add BNL to Watchlist: View: Get Complete BNL Trend Analysis ➞ | |
 | DIOD Diodes Incorporated |
| Sector: Technology | |
| SubSector: Semiconductor - Integrated Circuits | |
| MarketCap: 1967.6 Millions | |
| Recent Price: 73.27 Smart Investing & Trading Score: 93 | |
| Day Percent Change: 1.19% Day Change: 0.86 | |
| Week Change: 5.7% Year-to-date Change: -9.0% | |
| DIOD Links: Profile News Message Board | |
| Charts:- Daily , Weekly | |
| Add DIOD to Watchlist: View: Get Complete DIOD Trend Analysis ➞ | |
 | AVDX AvidXchange Holdings, Inc. |
| Sector: Technology | |
| SubSector: Software - Infrastructure | |
| MarketCap: 2120 Millions | |
| Recent Price: 11.29 Smart Investing & Trading Score: 25 | |
| Day Percent Change: 0.09% Day Change: 0.01 | |
| Week Change: 0.44% Year-to-date Change: -9.1% | |
| AVDX Links: Profile News Message Board | |
| Charts:- Daily , Weekly | |
| Add AVDX to Watchlist: View: Get Complete AVDX Trend Analysis ➞ | |
 | AVNS Avanos Medical, Inc. |
| Sector: Health Care | |
| SubSector: Medical Instruments & Supplies | |
| MarketCap: 1229.6 Millions | |
| Recent Price: 20.39 Smart Investing & Trading Score: 95 | |
| Day Percent Change: -0.15% Day Change: -0.03 | |
| Week Change: 4.56% Year-to-date Change: -9.1% | |
| AVNS Links: Profile News Message Board | |
| Charts:- Daily , Weekly | |
| Add AVNS to Watchlist: View: Get Complete AVNS Trend Analysis ➞ | |
 | MNRO Monro, Inc. |
| Sector: Consumer Staples | |
| SubSector: Auto Parts | |
| MarketCap: 1514.89 Millions | |
| Recent Price: 26.65 Smart Investing & Trading Score: 17 | |
| Day Percent Change: -3.76% Day Change: -1.04 | |
| Week Change: 0.45% Year-to-date Change: -9.2% | |
| MNRO Links: Profile News Message Board | |
| Charts:- Daily , Weekly | |
| Add MNRO to Watchlist: View: Get Complete MNRO Trend Analysis ➞ | |
 | FIBK First Interstate BancSystem, Inc. |
| Sector: Financials | |
| SubSector: Regional - Pacific Banks | |
| MarketCap: 1797.69 Millions | |
| Recent Price: 27.89 Smart Investing & Trading Score: 83 | |
| Day Percent Change: 0.87% Day Change: 0.24 | |
| Week Change: 0.5% Year-to-date Change: -9.3% | |
| FIBK Links: Profile News Message Board | |
| Charts:- Daily , Weekly | |
| Add FIBK to Watchlist: View: Get Complete FIBK Trend Analysis ➞ | |
 | LNN Lindsay Corporation |
| Sector: Industrials | |
| SubSector: Farm & Construction Machinery | |
| MarketCap: 1097.57 Millions | |
| Recent Price: 117.05 Smart Investing & Trading Score: 35 | |
| Day Percent Change: -0.78% Day Change: -0.92 | |
| Week Change: -2.24% Year-to-date Change: -9.4% | |
| LNN Links: Profile News Message Board | |
| Charts:- Daily , Weekly | |
| Add LNN to Watchlist: View: Get Complete LNN Trend Analysis ➞ | |
 | CIM Chimera Investment Corporation |
| Sector: Financials | |
| SubSector: Mortgage Investment | |
| MarketCap: 2164.09 Millions | |
| Recent Price: 4.52 Smart Investing & Trading Score: 83 | |
| Day Percent Change: -0.88% Day Change: -0.04 | |
| Week Change: -1.95% Year-to-date Change: -9.4% | |
| CIM Links: Profile News Message Board | |
| Charts:- Daily , Weekly | |
| Add CIM to Watchlist: View: Get Complete CIM Trend Analysis ➞ | |
 | DEA Easterly Government Properties, Inc. |
| Sector: Financials | |
| SubSector: REIT - Office | |
| MarketCap: 1832.56 Millions | |
| Recent Price: 12.17 Smart Investing & Trading Score: 75 | |
| Day Percent Change: 0.00% Day Change: 0.00 | |
| Week Change: 1.76% Year-to-date Change: -9.5% | |
| DEA Links: Profile News Message Board | |
| Charts:- Daily , Weekly | |
| Add DEA to Watchlist: View: Get Complete DEA Trend Analysis ➞ | |
 | PDCO Patterson Companies, Inc. |
| Sector: Services & Goods | |
| SubSector: Medical Equipment Wholesale | |
| MarketCap: 1672.2 Millions | |
| Recent Price: 25.76 Smart Investing & Trading Score: 38 | |
| Day Percent Change: -0.35% Day Change: -0.09 | |
| Week Change: 1.82% Year-to-date Change: -9.5% | |
| PDCO Links: Profile News Message Board | |
| Charts:- Daily , Weekly | |
| Add PDCO to Watchlist: View: Get Complete PDCO Trend Analysis ➞ | |
 | HOPE Hope Bancorp, Inc. |
| Sector: Financials | |
| SubSector: Regional - Pacific Banks | |
| MarketCap: 1099.29 Millions | |
| Recent Price: 10.93 Smart Investing & Trading Score: 67 | |
| Day Percent Change: 0.55% Day Change: 0.06 | |
| Week Change: -0.27% Year-to-date Change: -9.5% | |
| HOPE Links: Profile News Message Board | |
| Charts:- Daily , Weekly | |
| Add HOPE to Watchlist: View: Get Complete HOPE Trend Analysis ➞ | |
 | BEAM Beam Therapeutics Inc. |
| Sector: Health Care | |
| SubSector: Biotechnology | |
| MarketCap: 44987 Millions | |
| Recent Price: 24.62 Smart Investing & Trading Score: 64 | |
| Day Percent Change: 3.49% Day Change: 0.83 | |
| Week Change: 14.14% Year-to-date Change: -9.6% | |
| BEAM Links: Profile News Message Board | |
| Charts:- Daily , Weekly | |
| Add BEAM to Watchlist: View: Get Complete BEAM Trend Analysis ➞ | |
 | GT The Goodyear Tire & Rubber Company |
| Sector: Consumer Staples | |
| SubSector: Rubber & Plastics | |
| MarketCap: 1483.7 Millions | |
| Recent Price: 12.95 Smart Investing & Trading Score: 58 | |
| Day Percent Change: -1.52% Day Change: -0.20 | |
| Week Change: -0.08% Year-to-date Change: -9.6% | |
| GT Links: Profile News Message Board | |
| Charts:- Daily , Weekly | |
| Add GT to Watchlist: View: Get Complete GT Trend Analysis ➞ | |
 | CRC California Resources Corporation |
| Sector: Energy | |
| SubSector: Oil & Gas E&P | |
| MarketCap: 18247 Millions | |
| Recent Price: 49.40 Smart Investing & Trading Score: 32 | |
| Day Percent Change: 0.30% Day Change: 0.15 | |
| Week Change: 1.27% Year-to-date Change: -9.7% | |
| CRC Links: Profile News Message Board | |
| Charts:- Daily , Weekly | |
| Add CRC to Watchlist: View: Get Complete CRC Trend Analysis ➞ | |
 | HELE Helen of Troy Limited |
| Sector: Consumer Staples | |
| SubSector: Housewares & Accessories | |
| MarketCap: 3199.53 Millions | |
| Recent Price: 108.88 Smart Investing & Trading Score: 45 | |
| Day Percent Change: 0.74% Day Change: 0.80 | |
| Week Change: 6.33% Year-to-date Change: -9.9% | |
| HELE Links: Profile News Message Board | |
| Charts:- Daily , Weekly | |
| Add HELE to Watchlist: View: Get Complete HELE Trend Analysis ➞ | |
 | HRMY Harmony Biosciences Holdings, Inc. |
| Sector: Health Care | |
| SubSector: Biotechnology | |
| MarketCap: 24487 Millions | |
| Recent Price: 29.03 Smart Investing & Trading Score: 10 | |
| Day Percent Change: -0.96% Day Change: -0.28 | |
| Week Change: -3.68% Year-to-date Change: -10.1% | |
| HRMY Links: Profile News Message Board | |
| Charts:- Daily , Weekly | |
| Add HRMY to Watchlist: View: Get Complete HRMY Trend Analysis ➞ | |
 | NREF NexPoint Real Estate Finance, Inc. |
| Sector: Financials | |
| SubSector: REIT Diversified | |
| MarketCap: 97267 Millions | |
| Recent Price: 14.13 Smart Investing & Trading Score: 87 | |
| Day Percent Change: 0.07% Day Change: 0.01 | |
| Week Change: 5.76% Year-to-date Change: -10.2% | |
| NREF Links: Profile News Message Board | |
| Charts:- Daily , Weekly | |
| Add NREF to Watchlist: View: Get Complete NREF Trend Analysis ➞ | |
 | BGS B&G Foods, Inc. |
| Sector: Consumer Staples | |
| SubSector: Processed & Packaged Goods | |
| MarketCap: 1456.08 Millions | |
| Recent Price: 9.40 Smart Investing & Trading Score: 32 | |
| Day Percent Change: -1.57% Day Change: -0.15 | |
| Week Change: 17.35% Year-to-date Change: -10.5% | |
| BGS Links: Profile News Message Board | |
| Charts:- Daily , Weekly | |
| Add BGS to Watchlist: View: Get Complete BGS Trend Analysis ➞ | |
 | LXP Lexington Realty Trust |
| Sector: Financials | |
| SubSector: REIT - Diversified | |
| MarketCap: 2483.43 Millions | |
| Recent Price: 8.87 Smart Investing & Trading Score: 83 | |
| Day Percent Change: -0.56% Day Change: -0.05 | |
| Week Change: 1.14% Year-to-date Change: -10.6% | |
| LXP Links: Profile News Message Board | |
| Charts:- Daily , Weekly | |
| Add LXP to Watchlist: View: Get Complete LXP Trend Analysis ➞ | |
 | ROG Rogers Corporation |
| Sector: Technology | |
| SubSector: Diversified Electronics | |
| MarketCap: 1756.36 Millions | |
| Recent Price: 117.99 Smart Investing & Trading Score: 48 | |
| Day Percent Change: -1.43% Day Change: -1.71 | |
| Week Change: -2.16% Year-to-date Change: -10.7% | |
| ROG Links: Profile News Message Board | |
| Charts:- Daily , Weekly | |
| Add ROG to Watchlist: View: Get Complete ROG Trend Analysis ➞ | |
 | WABC Westamerica Bancorporation |
| Sector: Financials | |
| SubSector: Regional - Pacific Banks | |
| MarketCap: 1557.69 Millions | |
| Recent Price: 50.37 Smart Investing & Trading Score: 100 | |
| Day Percent Change: 0.90% Day Change: 0.45 | |
| Week Change: 0.7% Year-to-date Change: -10.7% | |
| WABC Links: Profile News Message Board | |
| Charts:- Daily , Weekly | |
| Add WABC to Watchlist: View: Get Complete WABC Trend Analysis ➞ | |
 | PCH PotlatchDeltic Corporation |
| Sector: Industrials | |
| SubSector: Lumber, Wood Production | |
| MarketCap: 2314.68 Millions | |
| Recent Price: 43.83 Smart Investing & Trading Score: 42 | |
| Day Percent Change: -0.43% Day Change: -0.19 | |
| Week Change: 1.53% Year-to-date Change: -10.7% | |
| PCH Links: Profile News Message Board | |
| Charts:- Daily , Weekly | |
| Add PCH to Watchlist: View: Get Complete PCH Trend Analysis ➞ | |
 | ARI Apollo Commercial Real Estate Finance, Inc. |
| Sector: Financials | |
| SubSector: Mortgage Investment | |
| MarketCap: 1302.19 Millions | |
| Recent Price: 10.48 Smart Investing & Trading Score: 49 | |
| Day Percent Change: 2.24% Day Change: 0.23 | |
| Week Change: 3.66% Year-to-date Change: -10.7% | |
| ARI Links: Profile News Message Board | |
| Charts:- Daily , Weekly | |
| Add ARI to Watchlist: View: Get Complete ARI Trend Analysis ➞ | |
 | RGNX REGENXBIO Inc. |
| Sector: Health Care | |
| SubSector: Biotechnology | |
| MarketCap: 1232.85 Millions | |
| Recent Price: 15.99 Smart Investing & Trading Score: 35 | |
| Day Percent Change: -0.12% Day Change: -0.02 | |
| Week Change: 3.56% Year-to-date Change: -10.9% | |
| RGNX Links: Profile News Message Board | |
| Charts:- Daily , Weekly | |
| Add RGNX to Watchlist: View: Get Complete RGNX Trend Analysis ➞ | |
| For tabular summary view of above stock list: Summary View ➞ 0 - 25 , 25 - 50 , 50 - 75 , 75 - 100 , 100 - 125 , 125 - 150 , 150 - 175 , 175 - 200 , 200 - 225 , 225 - 250 , 250 - 275 , 275 - 300 , 300 - 325 , 325 - 350 , 350 - 375 , 375 - 400 , 400 - 425 , 425 - 450 , 450 - 475 , 475 - 500 , 500 - 525 , 525 - 550 , 550 - 575 , 575 - 600 , 600 - 625 , 625 - 650 , 650 - 675 , 675 - 700 | ||
| Click To Change The Sort Order: By Market Cap or Company Size Performance: Year-to-date, Week and Day | |
| Select Chart Type: | ||
| Too many stocks? View smallcap stocks filtered by marketcap & sector |
| Marketcap: All SmallCap Stocks (default-no microcap), Large, Mid-Range, Small & MicroCap |
| Sector: Tech, Finance, Energy, Staples, Retail, Industrial, Materials, Utilities & Medical |
|
Best Stocks Today 12Stocks.com |
© 2024 12Stocks.com Terms & Conditions Privacy Contact Us
All Information Provided Only For Education And Not To Be Used For Investing or Trading. See Terms & Conditions


One More Thing ... Get Best Stocks Delivered Daily!
Never Ever Miss A Move With Our Top Ten Stocks Lists
Find Best Stocks In Any Market - Bull or Bear Market
Take A Peek At Our Top Ten Stocks Lists: Daily, Weekly, Year-to-Date & Top Trends
Find Best Stocks In Any Market - Bull or Bear Market
Take A Peek At Our Top Ten Stocks Lists: Daily, Weekly, Year-to-Date & Top Trends
Smallcap Stocks With Best Up Trends [0-bearish to 100-bullish]: CommScope Holding[100], Coeur Mining[100], Hecla Mining[100], MicroStrategy [100], Enovix [100], Rayonier Advanced[100], Nurix [100], Energy Fuels[100], NovaGold Resources[100], Piedmont Lithium[100], Wave Life[100]
Best Smallcap Stocks Year-to-Date:
CareMax [495.88%], Bakkt [413.9%], Janux [338.34%], Viking [260.02%], Alpine Immune[241.23%], Longboard [238.63%], Avidity Biosciences[226.33%], Super Micro[212.35%], Arcutis Bio[184.83%], Sweetgreen [180.97%], Novavax [171.04%] Best Smallcap Stocks This Week:
Vaxxinity [58.82%], Novavax [46.51%], Vicarious Surgical[45.62%], Harrow Health[44.48%], ProKidney [44.31%], Workhorse Group[36.06%], Maxeon Solar[35.94%], Fossil Group[35.44%], Humacyte [34.68%], MicroStrategy [34.23%], Cadiz [33.48%] Best Smallcap Stocks Daily:
Vaxxinity [45.95%], Presto Automation[31.90%], Vicarious Surgical[27.93%], Orchestra BioMed[12.77%], CommScope Holding[11.86%], Coeur Mining[11.57%], Hecla Mining[11.11%], MicroStrategy [10.04%], Tenaya [9.65%], Bakkt [9.25%], Enovix [9.25%]