
 Login Sign Up


| |||||
 |  | ||||

| 12Stocks.com Market Intelligence |
Best SmallCap Stocks
|
| In a hurry? Small Cap Stock Lists: Performance Trends Table, Stock Charts
Sort Small Cap stocks: Daily, Weekly, Year-to-Date, Market Cap & Trends. Filter Small Cap stocks list by sector: Show all, Tech, Finance, Energy, Staples, Retail, Industrial, Materials, Utilities and HealthCare Filter Small Cap stocks list by size: All Large Medium Small and MicroCap |
| 12Stocks.com Small Cap Stocks Performances & Trends Daily | |||||||||
|
|  The overall Smart Investing & Trading Score is 76 (0-bearish to 100-bullish) which puts Small Cap index in short term neutral to bullish trend. The Smart Investing & Trading Score from previous trading session is 90 and hence a deterioration of trend.
| ||||||||
Here are the Smart Investing & Trading Scores of the most requested small cap stocks at 12Stocks.com (click stock name for detailed review):
|


| 12Stocks.com: Investing in Smallcap Index with Stocks | |
|
The following table helps investors and traders sort through current performance and trends (as measured by Smart Investing & Trading Score) of various
stocks in the Smallcap Index. Quick View: Move mouse or cursor over stock symbol (ticker) to view short-term technical chart and over stock name to view long term chart. Click on  to add stock symbol to your watchlist and to add stock symbol to your watchlist and  to view watchlist. Click on any ticker or stock name for detailed market intelligence report for that stock. to view watchlist. Click on any ticker or stock name for detailed market intelligence report for that stock. |
12Stocks.com Performance of Stocks in Smallcap Index
| Ticker | Stock Name | Watchlist | Category | Recent Price | Smart Investing & Trading Score | Change % | YTD Change% |
| IBTX | Independent Bank |   | Financials | 43.94 | 87 | 1.76% | -13.64% |
| CVBF | CVB Financial | | Financials | 17.43 | 83 | 0.58% | -13.67% |
| BXMT | Blackstone Mortgage | | Financials | 18.36 | 32 | -0.33% | -13.68% |
| UHT | Universal Health | | Financials | 37.32 | 57 | -0.85% | -13.71% |
| ALLO | Allogene | | Health Care | 2.77 | 5 | -7.97% | -13.71% |
| MRTN | Marten Transport | | Transports | 18.10 | 50 | 0.17% | -13.73% |
| FHTX | Foghorn | | Health Care | 5.51 | 15 | -5.16% | -14.11% |
| OLO | Olo | | Technology | 4.88 | 31 | -1.21% | -14.69% |
| THS | TreeHouse Foods | | Consumer Staples | 35.35 | 35 | -0.20% | -14.72% |
| CATY | Cathay General | | Financials | 37.91 | 57 | -0.47% | -14.94% |
| SSD | Simpson | | Industrials | 168.35 | 0 | -0.71% | -14.97% |
| RMBS | Rambus | | Technology | 57.97 | 25 | 0.05% | -15.06% |
| BOWL | Bowlero | | Services & Goods | 11.98 | 59 | 2.66% | -15.16% |
| SHEN | Shenandoah Tele | | Technology | 18.32 | 69 | 0.88% | -15.26% |
| PLRX | Pliant | | Health Care | 15.27 | 62 | -2.18% | -15.73% |
| PRLB | Proto Labs | | Industrials | 32.82 | 52 | 1.05% | -15.76% |
| KW | Kennedy-Wilson | | Financials | 10.40 | 68 | -0.67% | -15.99% |
| GSHD | Goosehead Insurance | | Financials | 63.38 | 52 | -0.14% | -16.39% |
| WK | Workiva | | Technology | 84.83 | 55 | -0.32% | -16.45% |
| YOU | Clear Secure | | Technology | 17.29 | 10 | -0.80% | -16.55% |
| PWSC | PowerSchool | | Technology | 19.71 | 57 | 3.57% | -16.62% |
| SBH | Sally Beauty | | Services & Goods | 11.07 | 32 | -1.86% | -16.64% |
| VCYT | Veracyte | | Health Care | 22.88 | 50 | -2.22% | -16.83% |
| NAPA | Duckhorn Portfolio | | Consumer Staples | 8.18 | 59 | 0.25% | -16.87% |
| AMCX | AMC s | | Services & Goods | 15.61 | 75 | -2.19% | -16.92% |
| For chart view version of above stock list: Chart View ➞ 0 - 25 , 25 - 50 , 50 - 75 , 75 - 100 , 100 - 125 , 125 - 150 , 150 - 175 , 175 - 200 , 200 - 225 , 225 - 250 , 250 - 275 , 275 - 300 , 300 - 325 , 325 - 350 , 350 - 375 , 375 - 400 , 400 - 425 , 425 - 450 , 450 - 475 , 475 - 500 , 500 - 525 , 525 - 550 , 550 - 575 , 575 - 600 , 600 - 625 , 625 - 650 , 650 - 675 , 675 - 700 | ||
 | Click To Change The Sort Order: By Market Cap or Company Size Performance: Year-to-date, Week and Day |  |
| Too many stocks? View smallcap stocks filtered by marketcap & sector |
| Marketcap: All SmallCap Stocks (default-no microcap), Large, Mid-Range, Small |
| Smallcap Sector: Tech, Finance, Energy, Staples, Retail, Industrial, Materials, & Medical |
|
Get the most comprehensive stock market coverage daily at 12Stocks.com ➞ Best Stocks Today ➞ Best Stocks Weekly ➞ Best Stocks Year-to-Date ➞ Best Stocks Trends ➞  Best Stocks Today 12Stocks.com Best Nasdaq Stocks ➞ Best S&P 500 Stocks ➞ Best Tech Stocks ➞ Best Biotech Stocks ➞ |
| Detailed Overview of SmallCap Stocks |
| SmallCap Technical Overview, Leaders & Laggards, Top SmallCap ETF Funds & Detailed SmallCap Stocks List, Charts, Trends & More |
| Smallcap: Technical Analysis, Trends & YTD Performance | |
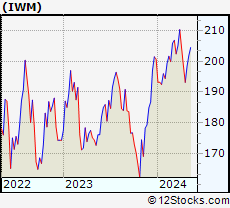
| SmallCap segment as represented by
IWM, an exchange-traded fund [ETF], holds basket of thousands of smallcap stocks from across all major sectors of the US stock market. The smallcap index (contains stocks like Riverbed & Sotheby's) is up by 3.67% and is currently underperforming the overall market by -6.9% year-to-date. Below is a quick view of technical charts and trends: | |
 IWM Weekly Chart |
|
| Long Term Trend: Very Good | |
| Medium Term Trend: Very Good | |
 IWM Daily Chart |
|
| Short Term Trend: Good | |
| Overall Trend Score: 76 | |
| YTD Performance: 3.67% | |
| **Trend Scores & Views Are Only For Educational Purposes And Not For Investing | |
| 12Stocks.com: Top Performing Small Cap Index Stocks | ||||||||||||||||||||||||||||||||||||||||||||||||
 The top performing Small Cap Index stocks year to date are
Now, more recently, over last week, the top performing Small Cap Index stocks on the move are


|
||||||||||||||||||||||||||||||||||||||||||||||||
| 12Stocks.com: Investing in Smallcap Index using Exchange Traded Funds | |
|
The following table shows list of key exchange traded funds (ETF) that
help investors track Smallcap index. The following list also includes leveraged ETF funds that track twice or thrice the daily returns of Smallcap indices. Short or inverse ETF funds move in the opposite direction to the index they track and are useful during market pullbacks or during bear markets. Quick View: Move mouse or cursor over ETF symbol (ticker) to view short-term technical chart and over ETF name to view long term chart. Click on ticker or stock name for detailed view. Click on to add stock symbol to your watchlist and to view watchlist. |
12Stocks.com List of ETFs that track Smallcap Index
| Ticker | ETF Name | Watchlist | Recent Price | Smart Investing & Trading Score | Change % | Week % | Year-to-date % |
| IWM | iShares Russell 2000 | | 208.08 | 76 | 0.07 | 1.85 | 3.67% |
| VTWO | Vanguard Russell 2000 ETF | | 84.11 | 71 | 0.00 | 1.8 | 3.71% |
| IJR | iShares Core S&P Small-Cap | | 110.39 | 68 | -0.22 | 1.29 | 1.98% |
| IWN | iShares Russell 2000 Value | | 158.71 | 76 | -0.07 | 1.61 | 2.18% |
| IWO | iShares Russell 2000 Growth | | 265.15 | 63 | -0.75 | 2.01 | 5.13% |
| IJS | iShares S&P Small-Cap 600 Value | | 101.87 | 76 | -0.15 | 1.34 | -1.16% |
| IJT | iShares S&P Small-Cap 600 Growth | | 131.34 | 71 | 0.04 | 1.14 | 4.95% |
| XSLV | PowerShares S&P SmallCap Low Volatil ETF | | 44.48 | 83 | -0.01 | 0.55 | 0.74% |
| SAA | ProShares Ultra SmallCap600 | | 24.90 | 71 | 0.50 | 2.28 | -0.18% |
| SMLV | SPDR SSGA US Small Cap Low Volatil ETF | | 113.28 | 95 | 0.43 | 1.85 | 0.68% |
| SDD | ProShares UltraShort SmallCap600 | | 17.84 | 35 | 0.96 | -2.41 | -3.19% |
| SBB | ProShares Short SmallCap600 | | 15.77 | 25 | 0.41 | -1.14 | -0.98% |
| 12Stocks.com: Charts, Trends, Fundamental Data and Performances of SmallCap Stocks | |
|
We now take in-depth look at all SmallCap stocks including charts, multi-period performances and overall trends (as measured by Smart Investing & Trading Score). One can sort SmallCap stocks (click link to choose) by Daily, Weekly and by Year-to-Date performances. Also, one can sort by size of the company or by market capitalization. |
| Select Your Default Chart Type: | |||||
| |||||
| Click on stock symbol or name for detailed view. Click on to add stock symbol to your watchlist and to view watchlist. Quick View: Move mouse or cursor over "Daily" to quickly view daily technical stock chart and over "Weekly" to view weekly technical stock chart. | |||||

 | IBTX Independent Bank Group, Inc. |
| Sector: Financials | |
| SubSector: Regional - Southeast Banks | |
| MarketCap: 1133.35 Millions | |
| Recent Price: 43.94 Smart Investing & Trading Score: 87 | |
| Day Percent Change: 1.76% Day Change: 0.76 | |
| Week Change: 2.88% Year-to-date Change: -13.6% | |
| IBTX Links: Profile News Message Board | |
| Charts:- Daily , Weekly | |
| Add IBTX to Watchlist: View: Get Complete IBTX Trend Analysis ➞ | |
 | CVBF CVB Financial Corp. |
| Sector: Financials | |
| SubSector: Regional - Pacific Banks | |
| MarketCap: 2699.99 Millions | |
| Recent Price: 17.43 Smart Investing & Trading Score: 83 | |
| Day Percent Change: 0.58% Day Change: 0.10 | |
| Week Change: 1.22% Year-to-date Change: -13.7% | |
| CVBF Links: Profile News Message Board | |
| Charts:- Daily , Weekly | |
| Add CVBF to Watchlist: View: Get Complete CVBF Trend Analysis ➞ | |
 | BXMT Blackstone Mortgage Trust, Inc. |
| Sector: Financials | |
| SubSector: Mortgage Investment | |
| MarketCap: 2820.69 Millions | |
| Recent Price: 18.36 Smart Investing & Trading Score: 32 | |
| Day Percent Change: -0.33% Day Change: -0.06 | |
| Week Change: 2.8% Year-to-date Change: -13.7% | |
| BXMT Links: Profile News Message Board | |
| Charts:- Daily , Weekly | |
| Add BXMT to Watchlist: View: Get Complete BXMT Trend Analysis ➞ | |
 | UHT Universal Health Realty Income Trust |
| Sector: Financials | |
| SubSector: REIT - Healthcare Facilities | |
| MarketCap: 1121.14 Millions | |
| Recent Price: 37.32 Smart Investing & Trading Score: 57 | |
| Day Percent Change: -0.85% Day Change: -0.32 | |
| Week Change: -0.53% Year-to-date Change: -13.7% | |
| UHT Links: Profile News Message Board | |
| Charts:- Daily , Weekly | |
| Add UHT to Watchlist: View: Get Complete UHT Trend Analysis ➞ | |
 | ALLO Allogene Therapeutics, Inc. |
| Sector: Health Care | |
| SubSector: Biotechnology | |
| MarketCap: 2858.65 Millions | |
| Recent Price: 2.77 Smart Investing & Trading Score: 5 | |
| Day Percent Change: -7.97% Day Change: -0.24 | |
| Week Change: 0.73% Year-to-date Change: -13.7% | |
| ALLO Links: Profile News Message Board | |
| Charts:- Daily , Weekly | |
| Add ALLO to Watchlist: View: Get Complete ALLO Trend Analysis ➞ | |
 | MRTN Marten Transport, Ltd. |
| Sector: Transports | |
| SubSector: Trucking | |
| MarketCap: 1012.15 Millions | |
| Recent Price: 18.10 Smart Investing & Trading Score: 50 | |
| Day Percent Change: 0.17% Day Change: 0.03 | |
| Week Change: 0.61% Year-to-date Change: -13.7% | |
| MRTN Links: Profile News Message Board | |
| Charts:- Daily , Weekly | |
| Add MRTN to Watchlist: View: Get Complete MRTN Trend Analysis ➞ | |
 | FHTX Foghorn Therapeutics Inc. |
| Sector: Health Care | |
| SubSector: Biotechnology | |
| MarketCap: 74487 Millions | |
| Recent Price: 5.51 Smart Investing & Trading Score: 15 | |
| Day Percent Change: -5.16% Day Change: -0.30 | |
| Week Change: -0.9% Year-to-date Change: -14.1% | |
| FHTX Links: Profile News Message Board | |
| Charts:- Daily , Weekly | |
| Add FHTX to Watchlist: View: Get Complete FHTX Trend Analysis ➞ | |
 | OLO Olo Inc. |
| Sector: Technology | |
| SubSector: Software - Application | |
| MarketCap: 1030 Millions | |
| Recent Price: 4.88 Smart Investing & Trading Score: 31 | |
| Day Percent Change: -1.21% Day Change: -0.06 | |
| Week Change: 4.5% Year-to-date Change: -14.7% | |
| OLO Links: Profile News Message Board | |
| Charts:- Daily , Weekly | |
| Add OLO to Watchlist: View: Get Complete OLO Trend Analysis ➞ | |
 | THS TreeHouse Foods, Inc. |
| Sector: Consumer Staples | |
| SubSector: Processed & Packaged Goods | |
| MarketCap: 2392.08 Millions | |
| Recent Price: 35.35 Smart Investing & Trading Score: 35 | |
| Day Percent Change: -0.20% Day Change: -0.07 | |
| Week Change: 2.05% Year-to-date Change: -14.7% | |
| THS Links: Profile News Message Board | |
| Charts:- Daily , Weekly | |
| Add THS to Watchlist: View: Get Complete THS Trend Analysis ➞ | |
 | CATY Cathay General Bancorp |
| Sector: Financials | |
| SubSector: Regional - Pacific Banks | |
| MarketCap: 1781.99 Millions | |
| Recent Price: 37.91 Smart Investing & Trading Score: 57 | |
| Day Percent Change: -0.47% Day Change: -0.18 | |
| Week Change: 0.66% Year-to-date Change: -14.9% | |
| CATY Links: Profile News Message Board | |
| Charts:- Daily , Weekly | |
| Add CATY to Watchlist: View: Get Complete CATY Trend Analysis ➞ | |
 | SSD Simpson Manufacturing Co., Inc. |
| Sector: Industrials | |
| SubSector: Small Tools & Accessories | |
| MarketCap: 2850.16 Millions | |
| Recent Price: 168.35 Smart Investing & Trading Score: 0 | |
| Day Percent Change: -0.71% Day Change: -1.21 | |
| Week Change: -4.35% Year-to-date Change: -15.0% | |
| SSD Links: Profile News Message Board | |
| Charts:- Daily , Weekly | |
| Add SSD to Watchlist: View: Get Complete SSD Trend Analysis ➞ | |
 | RMBS Rambus Inc. |
| Sector: Technology | |
| SubSector: Semiconductor- Memory Chips | |
| MarketCap: 1296 Millions | |
| Recent Price: 57.97 Smart Investing & Trading Score: 25 | |
| Day Percent Change: 0.05% Day Change: 0.03 | |
| Week Change: 2.24% Year-to-date Change: -15.1% | |
| RMBS Links: Profile News Message Board | |
| Charts:- Daily , Weekly | |
| Add RMBS to Watchlist: View: Get Complete RMBS Trend Analysis ➞ | |
 | BOWL Bowlero Corp. |
| Sector: Services & Goods | |
| SubSector: Leisure | |
| MarketCap: 2000 Millions | |
| Recent Price: 11.98 Smart Investing & Trading Score: 59 | |
| Day Percent Change: 2.66% Day Change: 0.31 | |
| Week Change: 9.11% Year-to-date Change: -15.2% | |
| BOWL Links: Profile News Message Board | |
| Charts:- Daily , Weekly | |
| Add BOWL to Watchlist: View: Get Complete BOWL Trend Analysis ➞ | |
 | SHEN Shenandoah Telecommunications Company |
| Sector: Technology | |
| SubSector: Telecom Services - Domestic | |
| MarketCap: 2329.67 Millions | |
| Recent Price: 18.32 Smart Investing & Trading Score: 69 | |
| Day Percent Change: 0.88% Day Change: 0.16 | |
| Week Change: 8.4% Year-to-date Change: -15.3% | |
| SHEN Links: Profile News Message Board | |
| Charts:- Daily , Weekly | |
| Add SHEN to Watchlist: View: Get Complete SHEN Trend Analysis ➞ | |
 | PLRX Pliant Therapeutics, Inc. |
| Sector: Health Care | |
| SubSector: Biotechnology | |
| MarketCap: 96487 Millions | |
| Recent Price: 15.27 Smart Investing & Trading Score: 62 | |
| Day Percent Change: -2.18% Day Change: -0.34 | |
| Week Change: 10.57% Year-to-date Change: -15.7% | |
| PLRX Links: Profile News Message Board | |
| Charts:- Daily , Weekly | |
| Add PLRX to Watchlist: View: Get Complete PLRX Trend Analysis ➞ | |
 | PRLB Proto Labs, Inc. |
| Sector: Industrials | |
| SubSector: Machine Tools & Accessories | |
| MarketCap: 1944.78 Millions | |
| Recent Price: 32.82 Smart Investing & Trading Score: 52 | |
| Day Percent Change: 1.05% Day Change: 0.34 | |
| Week Change: 3.34% Year-to-date Change: -15.8% | |
| PRLB Links: Profile News Message Board | |
| Charts:- Daily , Weekly | |
| Add PRLB to Watchlist: View: Get Complete PRLB Trend Analysis ➞ | |
 | KW Kennedy-Wilson Holdings, Inc. |
| Sector: Financials | |
| SubSector: Property Management | |
| MarketCap: 2025.42 Millions | |
| Recent Price: 10.40 Smart Investing & Trading Score: 68 | |
| Day Percent Change: -0.67% Day Change: -0.07 | |
| Week Change: 2.46% Year-to-date Change: -16.0% | |
| KW Links: Profile News Message Board | |
| Charts:- Daily , Weekly | |
| Add KW to Watchlist: View: Get Complete KW Trend Analysis ➞ | |
 | GSHD Goosehead Insurance, Inc |
| Sector: Financials | |
| SubSector: Insurance Brokers | |
| MarketCap: 1863.57 Millions | |
| Recent Price: 63.38 Smart Investing & Trading Score: 52 | |
| Day Percent Change: -0.14% Day Change: -0.09 | |
| Week Change: 5.01% Year-to-date Change: -16.4% | |
| GSHD Links: Profile News Message Board | |
| Charts:- Daily , Weekly | |
| Add GSHD to Watchlist: View: Get Complete GSHD Trend Analysis ➞ | |
 | WK Workiva Inc. |
| Sector: Technology | |
| SubSector: Application Software | |
| MarketCap: 1537.42 Millions | |
| Recent Price: 84.83 Smart Investing & Trading Score: 55 | |
| Day Percent Change: -0.32% Day Change: -0.27 | |
| Week Change: 3.12% Year-to-date Change: -16.5% | |
| WK Links: Profile News Message Board | |
| Charts:- Daily , Weekly | |
| Add WK to Watchlist: View: Get Complete WK Trend Analysis ➞ | |
 | YOU Clear Secure, Inc. |
| Sector: Technology | |
| SubSector: Software - Application | |
| MarketCap: 3510 Millions | |
| Recent Price: 17.29 Smart Investing & Trading Score: 10 | |
| Day Percent Change: -0.80% Day Change: -0.14 | |
| Week Change: 1.95% Year-to-date Change: -16.6% | |
| YOU Links: Profile News Message Board | |
| Charts:- Daily , Weekly | |
| Add YOU to Watchlist: View: Get Complete YOU Trend Analysis ➞ | |
 | PWSC PowerSchool Holdings, Inc. |
| Sector: Technology | |
| SubSector: Software - Application | |
| MarketCap: 3870 Millions | |
| Recent Price: 19.71 Smart Investing & Trading Score: 57 | |
| Day Percent Change: 3.57% Day Change: 0.68 | |
| Week Change: 8.83% Year-to-date Change: -16.6% | |
| PWSC Links: Profile News Message Board | |
| Charts:- Daily , Weekly | |
| Add PWSC to Watchlist: View: Get Complete PWSC Trend Analysis ➞ | |
 | SBH Sally Beauty Holdings, Inc. |
| Sector: Services & Goods | |
| SubSector: Specialty Retail, Other | |
| MarketCap: 1229.44 Millions | |
| Recent Price: 11.07 Smart Investing & Trading Score: 32 | |
| Day Percent Change: -1.86% Day Change: -0.21 | |
| Week Change: 3.85% Year-to-date Change: -16.6% | |
| SBH Links: Profile News Message Board | |
| Charts:- Daily , Weekly | |
| Add SBH to Watchlist: View: Get Complete SBH Trend Analysis ➞ | |
 | VCYT Veracyte, Inc. |
| Sector: Health Care | |
| SubSector: Biotechnology | |
| MarketCap: 1089.05 Millions | |
| Recent Price: 22.88 Smart Investing & Trading Score: 50 | |
| Day Percent Change: -2.22% Day Change: -0.52 | |
| Week Change: 7.07% Year-to-date Change: -16.8% | |
| VCYT Links: Profile News Message Board | |
| Charts:- Daily , Weekly | |
| Add VCYT to Watchlist: View: Get Complete VCYT Trend Analysis ➞ | |
 | NAPA The Duckhorn Portfolio, Inc. |
| Sector: Consumer Staples | |
| SubSector: Beverages - Wineries & Distilleries | |
| MarketCap: 1500 Millions | |
| Recent Price: 8.18 Smart Investing & Trading Score: 59 | |
| Day Percent Change: 0.25% Day Change: 0.02 | |
| Week Change: 0% Year-to-date Change: -16.9% | |
| NAPA Links: Profile News Message Board | |
| Charts:- Daily , Weekly | |
| Add NAPA to Watchlist: View: Get Complete NAPA Trend Analysis ➞ | |
 | AMCX AMC Networks Inc. |
| Sector: Services & Goods | |
| SubSector: Entertainment - Diversified | |
| MarketCap: 1477.37 Millions | |
| Recent Price: 15.61 Smart Investing & Trading Score: 75 | |
| Day Percent Change: -2.19% Day Change: -0.35 | |
| Week Change: 17.9% Year-to-date Change: -16.9% | |
| AMCX Links: Profile News Message Board | |
| Charts:- Daily , Weekly | |
| Add AMCX to Watchlist: View: Get Complete AMCX Trend Analysis ➞ | |
| For tabular summary view of above stock list: Summary View ➞ 0 - 25 , 25 - 50 , 50 - 75 , 75 - 100 , 100 - 125 , 125 - 150 , 150 - 175 , 175 - 200 , 200 - 225 , 225 - 250 , 250 - 275 , 275 - 300 , 300 - 325 , 325 - 350 , 350 - 375 , 375 - 400 , 400 - 425 , 425 - 450 , 450 - 475 , 475 - 500 , 500 - 525 , 525 - 550 , 550 - 575 , 575 - 600 , 600 - 625 , 625 - 650 , 650 - 675 , 675 - 700 | ||
| Click To Change The Sort Order: By Market Cap or Company Size Performance: Year-to-date, Week and Day | |
| Select Chart Type: | ||
| Too many stocks? View smallcap stocks filtered by marketcap & sector |
| Marketcap: All SmallCap Stocks (default-no microcap), Large, Mid-Range, Small & MicroCap |
| Sector: Tech, Finance, Energy, Staples, Retail, Industrial, Materials, Utilities & Medical |
|
Best Stocks Today 12Stocks.com |
© 2024 12Stocks.com Terms & Conditions Privacy Contact Us
All Information Provided Only For Education And Not To Be Used For Investing or Trading. See Terms & Conditions


One More Thing ... Get Best Stocks Delivered Daily!
Never Ever Miss A Move With Our Top Ten Stocks Lists
Find Best Stocks In Any Market - Bull or Bear Market
Take A Peek At Our Top Ten Stocks Lists: Daily, Weekly, Year-to-Date & Top Trends
Find Best Stocks In Any Market - Bull or Bear Market
Take A Peek At Our Top Ten Stocks Lists: Daily, Weekly, Year-to-Date & Top Trends
Smallcap Stocks With Best Up Trends [0-bearish to 100-bullish]: CommScope Holding[100], Coeur Mining[100], Hecla Mining[100], MicroStrategy [100], Enovix [100], Rayonier Advanced[100], Nurix [100], Energy Fuels[100], NovaGold Resources[100], Piedmont Lithium[100], Wave Life[100]
Best Smallcap Stocks Year-to-Date:
CareMax [495.88%], Bakkt [413.9%], Janux [338.34%], Viking [260.02%], Alpine Immune[241.23%], Longboard [238.63%], Avidity Biosciences[226.33%], Super Micro[212.35%], Arcutis Bio[184.83%], Sweetgreen [180.97%], Novavax [171.04%] Best Smallcap Stocks This Week:
Vaxxinity [58.82%], Novavax [46.51%], Vicarious Surgical[45.62%], Harrow Health[44.48%], ProKidney [44.31%], Workhorse Group[36.06%], Maxeon Solar[35.94%], Fossil Group[35.44%], Humacyte [34.68%], MicroStrategy [34.23%], Cadiz [33.48%] Best Smallcap Stocks Daily:
Vaxxinity [45.95%], Presto Automation[31.90%], Vicarious Surgical[27.93%], Orchestra BioMed[12.77%], CommScope Holding[11.86%], Coeur Mining[11.57%], Hecla Mining[11.11%], MicroStrategy [10.04%], Tenaya [9.65%], Bakkt [9.25%], Enovix [9.25%]