
 Login Sign Up


| |||||
 |  | ||||

| 12Stocks.com Market Intelligence |
Best SmallCap Stocks
|
| In a hurry? Small Cap Stock Lists: Performance Trends Table, Stock Charts
Sort Small Cap stocks: Daily, Weekly, Year-to-Date, Market Cap & Trends. Filter Small Cap stocks list by sector: Show all, Tech, Finance, Energy, Staples, Retail, Industrial, Materials, Utilities and HealthCare Filter Small Cap stocks list by size: All Large Medium Small and MicroCap |
| 12Stocks.com Small Cap Stocks Performances & Trends Daily | |||||||||
|
|  The overall Smart Investing & Trading Score is 69 (0-bearish to 100-bullish) which puts Small Cap index in short term neutral to bullish trend. The Smart Investing & Trading Score from previous trading session is 49 and hence an improvement of trend.
| ||||||||
Here are the Smart Investing & Trading Scores of the most requested small cap stocks at 12Stocks.com (click stock name for detailed review):
|


| 12Stocks.com: Investing in Smallcap Index with Stocks | |
|
The following table helps investors and traders sort through current performance and trends (as measured by Smart Investing & Trading Score) of various
stocks in the Smallcap Index. Quick View: Move mouse or cursor over stock symbol (ticker) to view short-term technical chart and over stock name to view long term chart. Click on  to add stock symbol to your watchlist and to add stock symbol to your watchlist and  to view watchlist. Click on any ticker or stock name for detailed market intelligence report for that stock. to view watchlist. Click on any ticker or stock name for detailed market intelligence report for that stock. |
12Stocks.com Performance of Stocks in Smallcap Index
| Ticker | Stock Name | Watchlist | Category | Recent Price | Smart Investing & Trading Score | Change % | YTD Change% |
| MNRO | Monro |   | Consumer Staples | 26.99 | 27 | 0.19% | -8.01% |
| COKE | Coca-Cola Consolidated | | Consumer Staples | 853.40 | 90 | 1.47% | -8.08% |
| ODP | Office Depot | | Services & Goods | 51.74 | 64 | 1.63% | -8.10% |
| MC | Moelis & | | Financials | 51.58 | 42 | -0.54% | -8.11% |
| VC | Visteon | | Consumer Staples | 114.72 | 100 | -0.49% | -8.15% |
| GBCI | Glacier Bancorp | | Financials | 37.91 | 100 | 0.69% | -8.25% |
| TOWN | TowneBank | | Financials | 27.30 | 93 | 1.00% | -8.27% |
| ESE | ESCO | | Technology | 107.28 | 90 | 1.71% | -8.33% |
| JBT | John Bean | | Industrials | 91.14 | 32 | 0.84% | -8.36% |
| AUB | Atlantic Union | | Financials | 33.48 | 82 | 0.42% | -8.37% |
| LNN | Lindsay | | Industrials | 118.29 | 69 | -1.33% | -8.42% |
| RLJ | RLJ Lodging | | Financials | 10.73 | 0 | 0.28% | -8.45% |
| NTCT | NetScout Systems | | Technology | 20.09 | 74 | -0.84% | -8.47% |
| SSD | Simpson | | Industrials | 181.05 | 42 | 1.59% | -8.55% |
| AWR | American States | | Utilities | 73.53 | 100 | 1.02% | -8.57% |
| KTOS | Kratos Defense | | Services & Goods | 18.54 | 90 | 2.49% | -8.62% |
| RXT | Rackspace | | Technology | 1.83 | 69 | 5.17% | -8.73% |
| MGRC | McGrath RentCorp | | Transports | 109.00 | 39 | 0.32% | -8.88% |
| DAN | Dana | | Consumer Staples | 13.31 | 100 | -0.08% | -8.90% |
| CNXN | PC Connection | | Technology | 61.17 | 10 | 3.17% | -8.99% |
| SEMR | Semrush | | Technology | 12.63 | 95 | -0.08% | -9.07% |
| PNM | PNM Resources | | Utilities | 37.78 | 100 | 0.19% | -9.18% |
| ROCK | Gibraltar Industries | | Materials | 71.69 | 35 | 0.63% | -9.23% |
| SCL | Stepan | | Materials | 85.70 | 74 | 0.14% | -9.36% |
| SFNC | Simmons First | | Financials | 17.98 | 44 | 1.58% | -9.38% |
| For chart view version of above stock list: Chart View ➞ 0 - 25 , 25 - 50 , 50 - 75 , 75 - 100 , 100 - 125 , 125 - 150 , 150 - 175 , 175 - 200 , 200 - 225 , 225 - 250 , 250 - 275 , 275 - 300 , 300 - 325 , 325 - 350 , 350 - 375 , 375 - 400 , 400 - 425 , 425 - 450 , 450 - 475 , 475 - 500 , 500 - 525 , 525 - 550 , 550 - 575 , 575 - 600 , 600 - 625 , 625 - 650 , 650 - 675 , 675 - 700 | ||
 | Click To Change The Sort Order: By Market Cap or Company Size Performance: Year-to-date, Week and Day |  |
| Too many stocks? View smallcap stocks filtered by marketcap & sector |
| Marketcap: All SmallCap Stocks (default-no microcap), Large, Mid-Range, Small |
| Smallcap Sector: Tech, Finance, Energy, Staples, Retail, Industrial, Materials, & Medical |
|
Get the most comprehensive stock market coverage daily at 12Stocks.com ➞ Best Stocks Today ➞ Best Stocks Weekly ➞ Best Stocks Year-to-Date ➞ Best Stocks Trends ➞  Best Stocks Today 12Stocks.com Best Nasdaq Stocks ➞ Best S&P 500 Stocks ➞ Best Tech Stocks ➞ Best Biotech Stocks ➞ |
| Detailed Overview of SmallCap Stocks |
| SmallCap Technical Overview, Leaders & Laggards, Top SmallCap ETF Funds & Detailed SmallCap Stocks List, Charts, Trends & More |
| Smallcap: Technical Analysis, Trends & YTD Performance | |
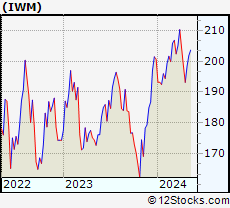
| SmallCap segment as represented by
IWM, an exchange-traded fund [ETF], holds basket of thousands of smallcap stocks from across all major sectors of the US stock market. The smallcap index (contains stocks like Riverbed & Sotheby's) is up by 0.59% and is currently underperforming the overall market by -6.29% year-to-date. Below is a quick view of technical charts and trends: | |
 IWM Weekly Chart |
|
| Long Term Trend: Not Good | |
| Medium Term Trend: Very Good | |
 IWM Daily Chart |
|
| Short Term Trend: Very Good | |
| Overall Trend Score: 69 | |
| YTD Performance: 0.59% | |
| **Trend Scores & Views Are Only For Educational Purposes And Not For Investing | |
| 12Stocks.com: Top Performing Small Cap Index Stocks | ||||||||||||||||||||||||||||||||||||||||||||||||
 The top performing Small Cap Index stocks year to date are
Now, more recently, over last week, the top performing Small Cap Index stocks on the move are


|
||||||||||||||||||||||||||||||||||||||||||||||||
| 12Stocks.com: Investing in Smallcap Index using Exchange Traded Funds | |
|
The following table shows list of key exchange traded funds (ETF) that
help investors track Smallcap index. The following list also includes leveraged ETF funds that track twice or thrice the daily returns of Smallcap indices. Short or inverse ETF funds move in the opposite direction to the index they track and are useful during market pullbacks or during bear markets. Quick View: Move mouse or cursor over ETF symbol (ticker) to view short-term technical chart and over ETF name to view long term chart. Click on ticker or stock name for detailed view. Click on to add stock symbol to your watchlist and to view watchlist. |
12Stocks.com List of ETFs that track Smallcap Index
| Ticker | ETF Name | Watchlist | Recent Price | Smart Investing & Trading Score | Change % | Week % | Year-to-date % |
| IWM | iShares Russell 2000 | | 201.90 | 69 | 0.99 | 1.77 | 0.59% |
| IJR | iShares Core S&P Small-Cap | | 107.13 | 82 | 0.75 | 1.4 | -1.03% |
| VTWO | Vanguard Russell 2000 ETF | | 81.61 | 69 | 0.94 | 1.73 | 0.63% |
| IWN | iShares Russell 2000 Value | | 154.21 | 100 | 0.87 | 2.03 | -0.72% |
| IJS | iShares S&P Small-Cap 600 Value | | 98.72 | 64 | 0.71 | 1.57 | -4.22% |
| IWO | iShares Russell 2000 Growth | | 256.87 | 57 | 0.99 | 1.49 | 1.84% |
| IJT | iShares S&P Small-Cap 600 Growth | | 127.76 | 95 | 0.82 | 1.32 | 2.09% |
| XSLV | PowerShares S&P SmallCap Low Volatil ETF | | 43.22 | 87 | 0.19 | 1.17 | -2.11% |
| SBB | ProShares Short SmallCap600 | | 16.16 | 13 | -1.28 | -1.37 | 1.44% |
| SDD | ProShares UltraShort SmallCap600 | | 18.84 | 23 | -2.41 | -2.61 | 2.27% |
| SAA | ProShares Ultra SmallCap600 | | 23.59 | 69 | 2.86 | 2.39 | -5.45% |
| SMLV | SPDR SSGA US Small Cap Low Volatil ETF | | 109.69 | 87 | 0.78 | 2.01 | -2.52% |
| 12Stocks.com: Charts, Trends, Fundamental Data and Performances of SmallCap Stocks | |
|
We now take in-depth look at all SmallCap stocks including charts, multi-period performances and overall trends (as measured by Smart Investing & Trading Score). One can sort SmallCap stocks (click link to choose) by Daily, Weekly and by Year-to-Date performances. Also, one can sort by size of the company or by market capitalization. |
| Select Your Default Chart Type: | |||||
| |||||
| Click on stock symbol or name for detailed view. Click on to add stock symbol to your watchlist and to view watchlist. Quick View: Move mouse or cursor over "Daily" to quickly view daily technical stock chart and over "Weekly" to view weekly technical stock chart. | |||||

 | MNRO Monro, Inc. |
| Sector: Consumer Staples | |
| SubSector: Auto Parts | |
| MarketCap: 1514.89 Millions | |
| Recent Price: 26.99 Smart Investing & Trading Score: 27 | |
| Day Percent Change: 0.19% Day Change: 0.05 | |
| Week Change: -2.88% Year-to-date Change: -8.0% | |
| MNRO Links: Profile News Message Board | |
| Charts:- Daily , Weekly | |
| Add MNRO to Watchlist: View: Get Complete MNRO Trend Analysis ➞ | |
 | COKE Coca-Cola Consolidated, Inc. |
| Sector: Consumer Staples | |
| SubSector: Beverages - Soft Drinks | |
| MarketCap: 1392.2 Millions | |
| Recent Price: 853.40 Smart Investing & Trading Score: 90 | |
| Day Percent Change: 1.47% Day Change: 12.37 | |
| Week Change: 3.76% Year-to-date Change: -8.1% | |
| COKE Links: Profile News Message Board | |
| Charts:- Daily , Weekly | |
| Add COKE to Watchlist: View: Get Complete COKE Trend Analysis ➞ | |
 | ODP Office Depot, Inc. |
| Sector: Services & Goods | |
| SubSector: Specialty Retail, Other | |
| MarketCap: 1024.44 Millions | |
| Recent Price: 51.74 Smart Investing & Trading Score: 64 | |
| Day Percent Change: 1.63% Day Change: 0.83 | |
| Week Change: 0.68% Year-to-date Change: -8.1% | |
| ODP Links: Profile News Message Board | |
| Charts:- Daily , Weekly | |
| Add ODP to Watchlist: View: Get Complete ODP Trend Analysis ➞ | |
 | MC Moelis & Company |
| Sector: Financials | |
| SubSector: Asset Management | |
| MarketCap: 1675.93 Millions | |
| Recent Price: 51.58 Smart Investing & Trading Score: 42 | |
| Day Percent Change: -0.54% Day Change: -0.28 | |
| Week Change: 3.68% Year-to-date Change: -8.1% | |
| MC Links: Profile News Message Board | |
| Charts:- Daily , Weekly | |
| Add MC to Watchlist: View: Get Complete MC Trend Analysis ➞ | |
 | VC Visteon Corporation |
| Sector: Consumer Staples | |
| SubSector: Auto Parts | |
| MarketCap: 1441.49 Millions | |
| Recent Price: 114.72 Smart Investing & Trading Score: 100 | |
| Day Percent Change: -0.49% Day Change: -0.57 | |
| Week Change: 2.26% Year-to-date Change: -8.2% | |
| VC Links: Profile News Message Board | |
| Charts:- Daily , Weekly | |
| Add VC to Watchlist: View: Get Complete VC Trend Analysis ➞ | |
 | GBCI Glacier Bancorp, Inc. |
| Sector: Financials | |
| SubSector: Regional - Pacific Banks | |
| MarketCap: 3142.89 Millions | |
| Recent Price: 37.91 Smart Investing & Trading Score: 100 | |
| Day Percent Change: 0.69% Day Change: 0.26 | |
| Week Change: 2.13% Year-to-date Change: -8.3% | |
| GBCI Links: Profile News Message Board | |
| Charts:- Daily , Weekly | |
| Add GBCI to Watchlist: View: Get Complete GBCI Trend Analysis ➞ | |
 | TOWN TowneBank |
| Sector: Financials | |
| SubSector: Regional - Mid-Atlantic Banks | |
| MarketCap: 1344.09 Millions | |
| Recent Price: 27.30 Smart Investing & Trading Score: 93 | |
| Day Percent Change: 1.00% Day Change: 0.27 | |
| Week Change: 1.41% Year-to-date Change: -8.3% | |
| TOWN Links: Profile News Message Board | |
| Charts:- Daily , Weekly | |
| Add TOWN to Watchlist: View: Get Complete TOWN Trend Analysis ➞ | |
 | ESE ESCO Technologies Inc. |
| Sector: Technology | |
| SubSector: Scientific & Technical Instruments | |
| MarketCap: 1968.03 Millions | |
| Recent Price: 107.28 Smart Investing & Trading Score: 90 | |
| Day Percent Change: 1.71% Day Change: 1.80 | |
| Week Change: 1.84% Year-to-date Change: -8.3% | |
| ESE Links: Profile News Message Board | |
| Charts:- Daily , Weekly | |
| Add ESE to Watchlist: View: Get Complete ESE Trend Analysis ➞ | |
 | JBT John Bean Technologies Corporation |
| Sector: Industrials | |
| SubSector: Diversified Machinery | |
| MarketCap: 2197.36 Millions | |
| Recent Price: 91.14 Smart Investing & Trading Score: 32 | |
| Day Percent Change: 0.84% Day Change: 0.76 | |
| Week Change: 0.37% Year-to-date Change: -8.4% | |
| JBT Links: Profile News Message Board | |
| Charts:- Daily , Weekly | |
| Add JBT to Watchlist: View: Get Complete JBT Trend Analysis ➞ | |
 | AUB Atlantic Union Bankshares Corporation |
| Sector: Financials | |
| SubSector: Regional - Mid-Atlantic Banks | |
| MarketCap: 1728.79 Millions | |
| Recent Price: 33.48 Smart Investing & Trading Score: 82 | |
| Day Percent Change: 0.42% Day Change: 0.14 | |
| Week Change: 3.72% Year-to-date Change: -8.4% | |
| AUB Links: Profile News Message Board | |
| Charts:- Daily , Weekly | |
| Add AUB to Watchlist: View: Get Complete AUB Trend Analysis ➞ | |
 | LNN Lindsay Corporation |
| Sector: Industrials | |
| SubSector: Farm & Construction Machinery | |
| MarketCap: 1097.57 Millions | |
| Recent Price: 118.29 Smart Investing & Trading Score: 69 | |
| Day Percent Change: -1.33% Day Change: -1.59 | |
| Week Change: 1.76% Year-to-date Change: -8.4% | |
| LNN Links: Profile News Message Board | |
| Charts:- Daily , Weekly | |
| Add LNN to Watchlist: View: Get Complete LNN Trend Analysis ➞ | |
 | RLJ RLJ Lodging Trust |
| Sector: Financials | |
| SubSector: REIT - Hotel/Motel | |
| MarketCap: 1019.34 Millions | |
| Recent Price: 10.73 Smart Investing & Trading Score: 0 | |
| Day Percent Change: 0.28% Day Change: 0.03 | |
| Week Change: -3.42% Year-to-date Change: -8.5% | |
| RLJ Links: Profile News Message Board | |
| Charts:- Daily , Weekly | |
| Add RLJ to Watchlist: View: Get Complete RLJ Trend Analysis ➞ | |
 | NTCT NetScout Systems, Inc. |
| Sector: Technology | |
| SubSector: Business Software & Services | |
| MarketCap: 1657.28 Millions | |
| Recent Price: 20.09 Smart Investing & Trading Score: 74 | |
| Day Percent Change: -0.84% Day Change: -0.17 | |
| Week Change: 0.95% Year-to-date Change: -8.5% | |
| NTCT Links: Profile News Message Board | |
| Charts:- Daily , Weekly | |
| Add NTCT to Watchlist: View: Get Complete NTCT Trend Analysis ➞ | |
 | SSD Simpson Manufacturing Co., Inc. |
| Sector: Industrials | |
| SubSector: Small Tools & Accessories | |
| MarketCap: 2850.16 Millions | |
| Recent Price: 181.05 Smart Investing & Trading Score: 42 | |
| Day Percent Change: 1.59% Day Change: 2.84 | |
| Week Change: 4.29% Year-to-date Change: -8.6% | |
| SSD Links: Profile News Message Board | |
| Charts:- Daily , Weekly | |
| Add SSD to Watchlist: View: Get Complete SSD Trend Analysis ➞ | |
 | AWR American States Water Company |
| Sector: Utilities | |
| SubSector: Water Utilities | |
| MarketCap: 3519.12 Millions | |
| Recent Price: 73.53 Smart Investing & Trading Score: 100 | |
| Day Percent Change: 1.02% Day Change: 0.74 | |
| Week Change: 5.18% Year-to-date Change: -8.6% | |
| AWR Links: Profile News Message Board | |
| Charts:- Daily , Weekly | |
| Add AWR to Watchlist: View: Get Complete AWR Trend Analysis ➞ | |
 | KTOS Kratos Defense & Security Solutions, Inc. |
| Sector: Services & Goods | |
| SubSector: Security & Protection Services | |
| MarketCap: 1369.63 Millions | |
| Recent Price: 18.54 Smart Investing & Trading Score: 90 | |
| Day Percent Change: 2.49% Day Change: 0.45 | |
| Week Change: -1.67% Year-to-date Change: -8.6% | |
| KTOS Links: Profile News Message Board | |
| Charts:- Daily , Weekly | |
| Add KTOS to Watchlist: View: Get Complete KTOS Trend Analysis ➞ | |
 | RXT Rackspace Technology, Inc. |
| Sector: Technology | |
| SubSector: Software Infrastructure | |
| MarketCap: 40287 Millions | |
| Recent Price: 1.83 Smart Investing & Trading Score: 69 | |
| Day Percent Change: 5.17% Day Change: 0.09 | |
| Week Change: 4.57% Year-to-date Change: -8.7% | |
| RXT Links: Profile News Message Board | |
| Charts:- Daily , Weekly | |
| Add RXT to Watchlist: View: Get Complete RXT Trend Analysis ➞ | |
 | MGRC McGrath RentCorp |
| Sector: Transports | |
| SubSector: Rental & Leasing Services | |
| MarketCap: 1289.04 Millions | |
| Recent Price: 109.00 Smart Investing & Trading Score: 39 | |
| Day Percent Change: 0.32% Day Change: 0.35 | |
| Week Change: -2.43% Year-to-date Change: -8.9% | |
| MGRC Links: Profile News Message Board | |
| Charts:- Daily , Weekly | |
| Add MGRC to Watchlist: View: Get Complete MGRC Trend Analysis ➞ | |
 | DAN Dana Incorporated |
| Sector: Consumer Staples | |
| SubSector: Auto Parts | |
| MarketCap: 1052.59 Millions | |
| Recent Price: 13.31 Smart Investing & Trading Score: 100 | |
| Day Percent Change: -0.08% Day Change: -0.01 | |
| Week Change: 6.65% Year-to-date Change: -8.9% | |
| DAN Links: Profile News Message Board | |
| Charts:- Daily , Weekly | |
| Add DAN to Watchlist: View: Get Complete DAN Trend Analysis ➞ | |
 | CNXN PC Connection, Inc. |
| Sector: Technology | |
| SubSector: Computers Wholesale | |
| MarketCap: 1020.19 Millions | |
| Recent Price: 61.17 Smart Investing & Trading Score: 10 | |
| Day Percent Change: 3.17% Day Change: 1.88 | |
| Week Change: -3.96% Year-to-date Change: -9.0% | |
| CNXN Links: Profile News Message Board | |
| Charts:- Daily , Weekly | |
| Add CNXN to Watchlist: View: Get Complete CNXN Trend Analysis ➞ | |
 | SEMR Semrush Holdings, Inc. |
| Sector: Technology | |
| SubSector: Software - Application | |
| MarketCap: 1330 Millions | |
| Recent Price: 12.63 Smart Investing & Trading Score: 95 | |
| Day Percent Change: -0.08% Day Change: -0.01 | |
| Week Change: 5.07% Year-to-date Change: -9.1% | |
| SEMR Links: Profile News Message Board | |
| Charts:- Daily , Weekly | |
| Add SEMR to Watchlist: View: Get Complete SEMR Trend Analysis ➞ | |
 | PNM PNM Resources, Inc. |
| Sector: Utilities | |
| SubSector: Diversified Utilities | |
| MarketCap: 2755.3 Millions | |
| Recent Price: 37.78 Smart Investing & Trading Score: 100 | |
| Day Percent Change: 0.19% Day Change: 0.07 | |
| Week Change: 4.02% Year-to-date Change: -9.2% | |
| PNM Links: Profile News Message Board | |
| Charts:- Daily , Weekly | |
| Add PNM to Watchlist: View: Get Complete PNM Trend Analysis ➞ | |
 | ROCK Gibraltar Industries, Inc. |
| Sector: Materials | |
| SubSector: Steel & Iron | |
| MarketCap: 1341.08 Millions | |
| Recent Price: 71.69 Smart Investing & Trading Score: 35 | |
| Day Percent Change: 0.63% Day Change: 0.45 | |
| Week Change: -0.79% Year-to-date Change: -9.2% | |
| ROCK Links: Profile News Message Board | |
| Charts:- Daily , Weekly | |
| Add ROCK to Watchlist: View: Get Complete ROCK Trend Analysis ➞ | |
 | SCL Stepan Company |
| Sector: Materials | |
| SubSector: Specialty Chemicals | |
| MarketCap: 1812.97 Millions | |
| Recent Price: 85.70 Smart Investing & Trading Score: 74 | |
| Day Percent Change: 0.14% Day Change: 0.12 | |
| Week Change: 2.05% Year-to-date Change: -9.4% | |
| SCL Links: Profile News Message Board | |
| Charts:- Daily , Weekly | |
| Add SCL to Watchlist: View: Get Complete SCL Trend Analysis ➞ | |
 | SFNC Simmons First National Corporation |
| Sector: Financials | |
| SubSector: Money Center Banks | |
| MarketCap: 2125.49 Millions | |
| Recent Price: 17.98 Smart Investing & Trading Score: 44 | |
| Day Percent Change: 1.58% Day Change: 0.28 | |
| Week Change: 2.74% Year-to-date Change: -9.4% | |
| SFNC Links: Profile News Message Board | |
| Charts:- Daily , Weekly | |
| Add SFNC to Watchlist: View: Get Complete SFNC Trend Analysis ➞ | |
| For tabular summary view of above stock list: Summary View ➞ 0 - 25 , 25 - 50 , 50 - 75 , 75 - 100 , 100 - 125 , 125 - 150 , 150 - 175 , 175 - 200 , 200 - 225 , 225 - 250 , 250 - 275 , 275 - 300 , 300 - 325 , 325 - 350 , 350 - 375 , 375 - 400 , 400 - 425 , 425 - 450 , 450 - 475 , 475 - 500 , 500 - 525 , 525 - 550 , 550 - 575 , 575 - 600 , 600 - 625 , 625 - 650 , 650 - 675 , 675 - 700 | ||
| Click To Change The Sort Order: By Market Cap or Company Size Performance: Year-to-date, Week and Day | |
| Select Chart Type: | ||
| Too many stocks? View smallcap stocks filtered by marketcap & sector |
| Marketcap: All SmallCap Stocks (default-no microcap), Large, Mid-Range, Small & MicroCap |
| Sector: Tech, Finance, Energy, Staples, Retail, Industrial, Materials, Utilities & Medical |
|
Best Stocks Today 12Stocks.com |
© 2024 12Stocks.com Terms & Conditions Privacy Contact Us
All Information Provided Only For Education And Not To Be Used For Investing or Trading. See Terms & Conditions


One More Thing ... Get Best Stocks Delivered Daily!
Never Ever Miss A Move With Our Top Ten Stocks Lists
Find Best Stocks In Any Market - Bull or Bear Market
Take A Peek At Our Top Ten Stocks Lists: Daily, Weekly, Year-to-Date & Top Trends
Find Best Stocks In Any Market - Bull or Bear Market
Take A Peek At Our Top Ten Stocks Lists: Daily, Weekly, Year-to-Date & Top Trends
Smallcap Stocks With Best Up Trends [0-bearish to 100-bullish]: Twist Bioscience[100], WideOpenWest [100], Joint [100], FTC Solar[100], Origin Materials[100], Alignment Healthcare[100], Clarus [100], IES [100], Emergent BioSolutions[100], Enovix [100], El Pollo[100]
Best Smallcap Stocks Year-to-Date:
Janux [482.74%], Viking [313.59%], Longboard [272.5%], Alpine Immune[239.29%], Bakkt [199.55%], Avidity Biosciences[192.48%], Vera [189.47%], Cullinan Oncology[176.9%], Super Micro[175.35%], Y-mAbs [151.47%], Sana [149.33%] Best Smallcap Stocks This Week:
Emergent BioSolutions[102.6%], Deciphera [73.24%], Origin Materials[66.52%], Eyenovia [60.78%], Cue Biopharma[56.04%], Aspen Aerogels[55.96%], Enovix [54.02%], Luna Innovations[53.77%], Codexis [47.37%], Carvana Co[44.31%], Office Properties[42.79%] Best Smallcap Stocks Daily:
Luna Innovations[36.00%], Twist Bioscience[28.74%], Ardelyx [28.42%], WideOpenWest [28.23%], 2U [26.63%], Joint [25.35%], FTC Solar[25.09%], Origin Materials[22.23%], Alignment Healthcare[21.97%], Clarus [18.67%], Aurora Innovation[18.09%]