
 Login Sign Up


| |||||
 |  | ||||

| 12Stocks.com Market Intelligence |
Best SmallCap Stocks
|
| In a hurry? Small Cap Stock Lists: Performance Trends Table, Stock Charts
Sort Small Cap stocks: Daily, Weekly, Year-to-Date, Market Cap & Trends. Filter Small Cap stocks list by sector: Show all, Tech, Finance, Energy, Staples, Retail, Industrial, Materials, Utilities and HealthCare Filter Small Cap stocks list by size: All Large Medium Small and MicroCap |
| 12Stocks.com Small Cap Stocks Performances & Trends Daily | |||||||||
|
|  The overall Smart Investing & Trading Score is 44 (0-bearish to 100-bullish) which puts Small Cap index in short term neutral trend. The Smart Investing & Trading Score from previous trading session is 58 and hence a deterioration of trend.
| ||||||||
Here are the Smart Investing & Trading Scores of the most requested small cap stocks at 12Stocks.com (click stock name for detailed review):
|


| 12Stocks.com: Investing in Smallcap Index with Stocks | |
|
The following table helps investors and traders sort through current performance and trends (as measured by Smart Investing & Trading Score) of various
stocks in the Smallcap Index. Quick View: Move mouse or cursor over stock symbol (ticker) to view short-term technical chart and over stock name to view long term chart. Click on  to add stock symbol to your watchlist and to add stock symbol to your watchlist and  to view watchlist. Click on any ticker or stock name for detailed market intelligence report for that stock. to view watchlist. Click on any ticker or stock name for detailed market intelligence report for that stock. |
12Stocks.com Performance of Stocks in Smallcap Index
| Ticker | Stock Name | Watchlist | Category | Recent Price | Smart Investing & Trading Score | Change % | Weekly Change% |
| AVAH | Aveanna Healthcare |   | Health Care | 2.20 | 63 | -5.78% | -3.93% |
| SDGR | Schrodinger | | Health Care | 23.35 | 0 | -2.87% | -3.95% |
| DNUT | Krispy Kreme | | Consumer Staples | 13.10 | 17 | 0.73% | -3.96% |
| INGN | Inogen | | Health Care | 6.48 | 50 | -8.09% | -4.00% |
| RELY | Remitly Global | | Technology | 17.77 | 71 | -3.58% | -4.00% |
| EVH | Evolent Health | | Technology | 28.32 | 13 | -3.21% | -4.03% |
| FIZZ | National Beverage | | Consumer Staples | 43.51 | 10 | -2.29% | -4.06% |
| CNK | Cinemark | | Services & Goods | 17.48 | 46 | -1.30% | -4.06% |
| GDYN | Grid Dynamics | | Technology | 9.93 | 18 | -3.03% | -4.06% |
| CYTK | Cytokinetics | | Health Care | 64.80 | 10 | -3.02% | -4.07% |
| NAUT | Nautilus | | Health Care | 2.36 | 20 | -2.88% | -4.07% |
| KTOS | Kratos Defense | | Services & Goods | 17.28 | 44 | -2.76% | -4.11% |
| SCLX | Scilex Holding | | Health Care | 0.86 | 35 | -5.31% | -4.12% |
| FOLD | Amicus | | Health Care | 10.17 | 18 | -3.51% | -4.15% |
| VIR | Vir | | Health Care | 7.63 | 20 | -5.10% | -4.15% |
| HPP | Hudson Pacific | | Financials | 5.68 | 20 | -4.54% | -4.22% |
| INZY | Inozyme Pharma | | Health Care | 4.29 | 10 | -2.39% | -4.24% |
| FEAM | 5E Advanced | | Materials | 1.13 | 17 | -3.42% | -4.24% |
| FUL | H.B. Fuller | | Materials | 73.68 | 0 | -1.84% | -4.25% |
| VRCA | Verrica | | Health Care | 6.66 | 49 | -1.91% | -4.31% |
| OIS | Oil States | | Energy | 5.32 | 10 | 1.33% | -4.32% |
| MYPS | PLAYSTUDIOS | | Services & Goods | 2.21 | 20 | 0.45% | -4.33% |
| HSHP | Himalaya Shipping | | Industrials | 7.71 | 43 | 0.92% | -4.34% |
| EBS | Emergent BioSolutions | | Health Care | 1.95 | 68 | -10.55% | -4.41% |
| UNFI | United Natural | | Consumer Staples | 8.86 | 27 | 0.45% | -4.42% |


| Too many stocks? View smallcap stocks filtered by marketcap & sector |
| Marketcap: All SmallCap Stocks (default-no microcap), Large, Mid-Range, Small |
| Smallcap Sector: Tech, Finance, Energy, Staples, Retail, Industrial, Materials, & Medical |
|
Get the most comprehensive stock market coverage daily at 12Stocks.com ➞ Best Stocks Today ➞ Best Stocks Weekly ➞ Best Stocks Year-to-Date ➞ Best Stocks Trends ➞  Best Stocks Today 12Stocks.com Best Nasdaq Stocks ➞ Best S&P 500 Stocks ➞ Best Tech Stocks ➞ Best Biotech Stocks ➞ |
| Detailed Overview of SmallCap Stocks |
| SmallCap Technical Overview, Leaders & Laggards, Top SmallCap ETF Funds & Detailed SmallCap Stocks List, Charts, Trends & More |
| Smallcap: Technical Analysis, Trends & YTD Performance | |
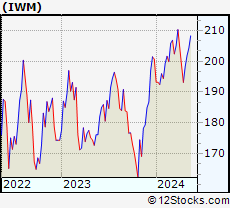
| SmallCap segment as represented by
IWM, an exchange-traded fund [ETF], holds basket of thousands of smallcap stocks from across all major sectors of the US stock market. The smallcap index (contains stocks like Riverbed & Sotheby's) is down by -2.11% and is currently underperforming the overall market by -7.27% year-to-date. Below is a quick view of technical charts and trends: | |
 IWM Weekly Chart |
|
| Long Term Trend: Good | |
| Medium Term Trend: Not Good | |
 IWM Daily Chart |
|
| Short Term Trend: Very Good | |
| Overall Trend Score: 44 | |
| YTD Performance: -2.11% | |
| **Trend Scores & Views Are Only For Educational Purposes And Not For Investing | |
| 12Stocks.com: Top Performing Small Cap Index Stocks | ||||||||||||||||||||||||||||||||||||||||||||||||
 The top performing Small Cap Index stocks year to date are
Now, more recently, over last week, the top performing Small Cap Index stocks on the move are


|
||||||||||||||||||||||||||||||||||||||||||||||||
| 12Stocks.com: Investing in Smallcap Index using Exchange Traded Funds | |
|
The following table shows list of key exchange traded funds (ETF) that
help investors track Smallcap index. The following list also includes leveraged ETF funds that track twice or thrice the daily returns of Smallcap indices. Short or inverse ETF funds move in the opposite direction to the index they track and are useful during market pullbacks or during bear markets. Quick View: Move mouse or cursor over ETF symbol (ticker) to view short-term technical chart and over ETF name to view long term chart. Click on ticker or stock name for detailed view. Click on to add stock symbol to your watchlist and to view watchlist. |
12Stocks.com List of ETFs that track Smallcap Index
| Ticker | ETF Name | Watchlist | Recent Price | Smart Investing & Trading Score | Change % | Week % | Year-to-date % |
| IWM | iShares Russell 2000 | | 196.48 | 44 | -0.61 | 1.73 | -2.11% |
| IJR | iShares Core S&P Small-Cap | | 104.86 | 78 | -0.80 | 1.59 | -3.13% |
| VTWO | Vanguard Russell 2000 ETF | | 79.45 | 63 | -0.60 | 1.75 | -2.03% |
| IWN | iShares Russell 2000 Value | | 150.18 | 68 | -0.73 | 1.62 | -3.32% |
| IWO | iShares Russell 2000 Growth | | 249.86 | 51 | -0.56 | 1.86 | -0.94% |
| IJS | iShares S&P Small-Cap 600 Value | | 96.69 | 60 | -1.04 | 1.13 | -6.19% |
| IJT | iShares S&P Small-Cap 600 Growth | | 125.06 | 63 | -0.25 | 2.33 | -0.06% |
| XSLV | PowerShares S&P SmallCap Low Volatil ETF | | 42.54 | 73 | -0.93 | 0.85 | -3.65% |
| SDD | ProShares UltraShort SmallCap600 | | 19.58 | 42 | 0.46 | -3.74 | 6.26% |
| SBB | ProShares Short SmallCap600 | | 16.50 | 40 | 0.79 | -2.02 | 3.58% |
| SMLV | SPDR SSGA US Small Cap Low Volatil ETF | | 107.33 | 73 | -1.01 | 1.17 | -4.61% |
| SAA | ProShares Ultra SmallCap600 | | 22.66 | 58 | -1.52 | 3.94 | -9.18% |
| 12Stocks.com: Charts, Trends, Fundamental Data and Performances of SmallCap Stocks | |
|
We now take in-depth look at all SmallCap stocks including charts, multi-period performances and overall trends (as measured by Smart Investing & Trading Score). One can sort SmallCap stocks (click link to choose) by Daily, Weekly and by Year-to-Date performances. Also, one can sort by size of the company or by market capitalization. |
| Select Your Default Chart Type: | |||||
| |||||
| Click on stock symbol or name for detailed view. Click on to add stock symbol to your watchlist and to view watchlist. Quick View: Move mouse or cursor over "Daily" to quickly view daily technical stock chart and over "Weekly" to view weekly technical stock chart. | |||||

 | AVAH Aveanna Healthcare Holdings Inc. |
| Sector: Health Care | |
| SubSector: Medical Care Facilities | |
| MarketCap: 305 Millions | |
| Recent Price: 2.20 Smart Investing & Trading Score: 63 | |
| Day Percent Change: -5.78% Day Change: -0.13 | |
| Week Change: -3.93% Year-to-date Change: -18.4% | |
| AVAH Links: Profile News Message Board | |
| Charts:- Daily , Weekly | |
| Add AVAH to Watchlist: View: Get Complete AVAH Trend Analysis ➞ | |
 | SDGR Schrodinger, Inc. |
| Sector: Health Care | |
| SubSector: Health Information Services | |
| MarketCap: 47287 Millions | |
| Recent Price: 23.35 Smart Investing & Trading Score: 0 | |
| Day Percent Change: -2.87% Day Change: -0.69 | |
| Week Change: -3.95% Year-to-date Change: -34.8% | |
| SDGR Links: Profile News Message Board | |
| Charts:- Daily , Weekly | |
| Add SDGR to Watchlist: View: Get Complete SDGR Trend Analysis ➞ | |
 | DNUT Krispy Kreme, Inc. |
| Sector: Consumer Staples | |
| SubSector: Grocery Stores | |
| MarketCap: 2480 Millions | |
| Recent Price: 13.10 Smart Investing & Trading Score: 17 | |
| Day Percent Change: 0.73% Day Change: 0.09 | |
| Week Change: -3.96% Year-to-date Change: -13.8% | |
| DNUT Links: Profile News Message Board | |
| Charts:- Daily , Weekly | |
| Add DNUT to Watchlist: View: Get Complete DNUT Trend Analysis ➞ | |
 | INGN Inogen, Inc. |
| Sector: Health Care | |
| SubSector: Medical Instruments & Supplies | |
| MarketCap: 8803.6 Millions | |
| Recent Price: 6.48 Smart Investing & Trading Score: 50 | |
| Day Percent Change: -8.09% Day Change: -0.57 | |
| Week Change: -4% Year-to-date Change: 18.0% | |
| INGN Links: Profile News Message Board | |
| Charts:- Daily , Weekly | |
| Add INGN to Watchlist: View: Get Complete INGN Trend Analysis ➞ | |
 | RELY Remitly Global, Inc. |
| Sector: Technology | |
| SubSector: Software - Infrastructure | |
| MarketCap: 3320 Millions | |
| Recent Price: 17.77 Smart Investing & Trading Score: 71 | |
| Day Percent Change: -3.58% Day Change: -0.66 | |
| Week Change: -4% Year-to-date Change: -8.5% | |
| RELY Links: Profile News Message Board | |
| Charts:- Daily , Weekly | |
| Add RELY to Watchlist: View: Get Complete RELY Trend Analysis ➞ | |
 | EVH Evolent Health, Inc. |
| Sector: Technology | |
| SubSector: Healthcare Information Services | |
| MarketCap: 486.755 Millions | |
| Recent Price: 28.32 Smart Investing & Trading Score: 13 | |
| Day Percent Change: -3.21% Day Change: -0.94 | |
| Week Change: -4.03% Year-to-date Change: -14.3% | |
| EVH Links: Profile News Message Board | |
| Charts:- Daily , Weekly | |
| Add EVH to Watchlist: View: Get Complete EVH Trend Analysis ➞ | |
 | FIZZ National Beverage Corp. |
| Sector: Consumer Staples | |
| SubSector: Beverages - Soft Drinks | |
| MarketCap: 2031.4 Millions | |
| Recent Price: 43.51 Smart Investing & Trading Score: 10 | |
| Day Percent Change: -2.29% Day Change: -1.02 | |
| Week Change: -4.06% Year-to-date Change: -12.5% | |
| FIZZ Links: Profile News Message Board | |
| Charts:- Daily , Weekly | |
| Add FIZZ to Watchlist: View: Get Complete FIZZ Trend Analysis ➞ | |
 | CNK Cinemark Holdings, Inc. |
| Sector: Services & Goods | |
| SubSector: Movie Production, Theaters | |
| MarketCap: 1776.29 Millions | |
| Recent Price: 17.48 Smart Investing & Trading Score: 46 | |
| Day Percent Change: -1.30% Day Change: -0.23 | |
| Week Change: -4.06% Year-to-date Change: 24.1% | |
| CNK Links: Profile News Message Board | |
| Charts:- Daily , Weekly | |
| Add CNK to Watchlist: View: Get Complete CNK Trend Analysis ➞ | |
 | GDYN Grid Dynamics Holdings, Inc. |
| Sector: Technology | |
| SubSector: Information Technology Services | |
| MarketCap: 318.968 Millions | |
| Recent Price: 9.93 Smart Investing & Trading Score: 18 | |
| Day Percent Change: -3.03% Day Change: -0.31 | |
| Week Change: -4.06% Year-to-date Change: -25.5% | |
| GDYN Links: Profile News Message Board | |
| Charts:- Daily , Weekly | |
| Add GDYN to Watchlist: View: Get Complete GDYN Trend Analysis ➞ | |
 | CYTK Cytokinetics, Incorporated |
| Sector: Health Care | |
| SubSector: Biotechnology | |
| MarketCap: 654.285 Millions | |
| Recent Price: 64.80 Smart Investing & Trading Score: 10 | |
| Day Percent Change: -3.02% Day Change: -2.02 | |
| Week Change: -4.07% Year-to-date Change: -22.4% | |
| CYTK Links: Profile News Message Board | |
| Charts:- Daily , Weekly | |
| Add CYTK to Watchlist: View: Get Complete CYTK Trend Analysis ➞ | |
 | NAUT Nautilus Biotechnology, Inc. |
| Sector: Health Care | |
| SubSector: Biotechnology | |
| MarketCap: 458 Millions | |
| Recent Price: 2.36 Smart Investing & Trading Score: 20 | |
| Day Percent Change: -2.88% Day Change: -0.07 | |
| Week Change: -4.07% Year-to-date Change: -28.3% | |
| NAUT Links: Profile News Message Board | |
| Charts:- Daily , Weekly | |
| Add NAUT to Watchlist: View: Get Complete NAUT Trend Analysis ➞ | |
 | KTOS Kratos Defense & Security Solutions, Inc. |
| Sector: Services & Goods | |
| SubSector: Security & Protection Services | |
| MarketCap: 1369.63 Millions | |
| Recent Price: 17.28 Smart Investing & Trading Score: 44 | |
| Day Percent Change: -2.76% Day Change: -0.49 | |
| Week Change: -4.11% Year-to-date Change: -14.8% | |
| KTOS Links: Profile News Message Board | |
| Charts:- Daily , Weekly | |
| Add KTOS to Watchlist: View: Get Complete KTOS Trend Analysis ➞ | |
 | SCLX Scilex Holding Company |
| Sector: Health Care | |
| SubSector: Drug Manufacturers - General | |
| MarketCap: 927 Millions | |
| Recent Price: 0.86 Smart Investing & Trading Score: 35 | |
| Day Percent Change: -5.31% Day Change: -0.05 | |
| Week Change: -4.12% Year-to-date Change: -56.1% | |
| SCLX Links: Profile News Message Board | |
| Charts:- Daily , Weekly | |
| Add SCLX to Watchlist: View: Get Complete SCLX Trend Analysis ➞ | |
 | FOLD Amicus Therapeutics, Inc. |
| Sector: Health Care | |
| SubSector: Biotechnology | |
| MarketCap: 2676.75 Millions | |
| Recent Price: 10.17 Smart Investing & Trading Score: 18 | |
| Day Percent Change: -3.51% Day Change: -0.37 | |
| Week Change: -4.15% Year-to-date Change: -28.3% | |
| FOLD Links: Profile News Message Board | |
| Charts:- Daily , Weekly | |
| Add FOLD to Watchlist: View: Get Complete FOLD Trend Analysis ➞ | |
 | VIR Vir Biotechnology, Inc. |
| Sector: Health Care | |
| SubSector: Biotechnology | |
| MarketCap: 3916.75 Millions | |
| Recent Price: 7.63 Smart Investing & Trading Score: 20 | |
| Day Percent Change: -5.10% Day Change: -0.41 | |
| Week Change: -4.15% Year-to-date Change: -24.2% | |
| VIR Links: Profile News Message Board | |
| Charts:- Daily , Weekly | |
| Add VIR to Watchlist: View: Get Complete VIR Trend Analysis ➞ | |
 | HPP Hudson Pacific Properties, Inc. |
| Sector: Financials | |
| SubSector: REIT - Office | |
| MarketCap: 3267.16 Millions | |
| Recent Price: 5.68 Smart Investing & Trading Score: 20 | |
| Day Percent Change: -4.54% Day Change: -0.27 | |
| Week Change: -4.22% Year-to-date Change: -39.0% | |
| HPP Links: Profile News Message Board | |
| Charts:- Daily , Weekly | |
| Add HPP to Watchlist: View: Get Complete HPP Trend Analysis ➞ | |
 | INZY Inozyme Pharma, Inc. |
| Sector: Health Care | |
| SubSector: Biotechnology | |
| MarketCap: 53487 Millions | |
| Recent Price: 4.29 Smart Investing & Trading Score: 10 | |
| Day Percent Change: -2.39% Day Change: -0.11 | |
| Week Change: -4.24% Year-to-date Change: 0.9% | |
| INZY Links: Profile News Message Board | |
| Charts:- Daily , Weekly | |
| Add INZY to Watchlist: View: Get Complete INZY Trend Analysis ➞ | |
 | FEAM 5E Advanced Materials Inc. |
| Sector: Materials | |
| SubSector: Specialty Chemicals | |
| MarketCap: 247 Millions | |
| Recent Price: 1.13 Smart Investing & Trading Score: 17 | |
| Day Percent Change: -3.42% Day Change: -0.04 | |
| Week Change: -4.24% Year-to-date Change: -19.9% | |
| FEAM Links: Profile News Message Board | |
| Charts:- Daily , Weekly | |
| Add FEAM to Watchlist: View: Get Complete FEAM Trend Analysis ➞ | |
 | FUL H.B. Fuller Company |
| Sector: Materials | |
| SubSector: Specialty Chemicals | |
| MarketCap: 1655.67 Millions | |
| Recent Price: 73.68 Smart Investing & Trading Score: 0 | |
| Day Percent Change: -1.84% Day Change: -1.38 | |
| Week Change: -4.25% Year-to-date Change: -9.5% | |
| FUL Links: Profile News Message Board | |
| Charts:- Daily , Weekly | |
| Add FUL to Watchlist: View: Get Complete FUL Trend Analysis ➞ | |
 | VRCA Verrica Pharmaceuticals Inc. |
| Sector: Health Care | |
| SubSector: Biotechnology | |
| MarketCap: 289.585 Millions | |
| Recent Price: 6.66 Smart Investing & Trading Score: 49 | |
| Day Percent Change: -1.91% Day Change: -0.13 | |
| Week Change: -4.31% Year-to-date Change: -9.0% | |
| VRCA Links: Profile News Message Board | |
| Charts:- Daily , Weekly | |
| Add VRCA to Watchlist: View: Get Complete VRCA Trend Analysis ➞ | |
 | OIS Oil States International, Inc. |
| Sector: Energy | |
| SubSector: Oil & Gas Equipment & Services | |
| MarketCap: 131.061 Millions | |
| Recent Price: 5.32 Smart Investing & Trading Score: 10 | |
| Day Percent Change: 1.33% Day Change: 0.07 | |
| Week Change: -4.32% Year-to-date Change: -21.7% | |
| OIS Links: Profile News Message Board | |
| Charts:- Daily , Weekly | |
| Add OIS to Watchlist: View: Get Complete OIS Trend Analysis ➞ | |
 | MYPS PLAYSTUDIOS, Inc. |
| Sector: Services & Goods | |
| SubSector: Electronic Gaming & Multimedia | |
| MarketCap: 635 Millions | |
| Recent Price: 2.21 Smart Investing & Trading Score: 20 | |
| Day Percent Change: 0.45% Day Change: 0.01 | |
| Week Change: -4.33% Year-to-date Change: -17.4% | |
| MYPS Links: Profile News Message Board | |
| Charts:- Daily , Weekly | |
| Add MYPS to Watchlist: View: Get Complete MYPS Trend Analysis ➞ | |
 | HSHP Himalaya Shipping Ltd. |
| Sector: Industrials | |
| SubSector: Marine Shipping | |
| MarketCap: 179 Millions | |
| Recent Price: 7.71 Smart Investing & Trading Score: 43 | |
| Day Percent Change: 0.92% Day Change: 0.07 | |
| Week Change: -4.34% Year-to-date Change: 14.2% | |
| HSHP Links: Profile News Message Board | |
| Charts:- Daily , Weekly | |
| Add HSHP to Watchlist: View: Get Complete HSHP Trend Analysis ➞ | |
 | EBS Emergent BioSolutions Inc. |
| Sector: Health Care | |
| SubSector: Biotechnology | |
| MarketCap: 2417.65 Millions | |
| Recent Price: 1.95 Smart Investing & Trading Score: 68 | |
| Day Percent Change: -10.55% Day Change: -0.23 | |
| Week Change: -4.41% Year-to-date Change: -18.8% | |
| EBS Links: Profile News Message Board | |
| Charts:- Daily , Weekly | |
| Add EBS to Watchlist: View: Get Complete EBS Trend Analysis ➞ | |
 | UNFI United Natural Foods, Inc. |
| Sector: Consumer Staples | |
| SubSector: Food Wholesale | |
| MarketCap: 746.329 Millions | |
| Recent Price: 8.86 Smart Investing & Trading Score: 27 | |
| Day Percent Change: 0.45% Day Change: 0.04 | |
| Week Change: -4.42% Year-to-date Change: -45.4% | |
| UNFI Links: Profile News Message Board | |
| Charts:- Daily , Weekly | |
| Add UNFI to Watchlist: View: Get Complete UNFI Trend Analysis ➞ | |
| Too many stocks? View smallcap stocks filtered by marketcap & sector |
| Marketcap: All SmallCap Stocks (default-no microcap), Large, Mid-Range, Small & MicroCap |
| Sector: Tech, Finance, Energy, Staples, Retail, Industrial, Materials, Utilities & Medical |
|
Best Stocks Today 12Stocks.com |
© 2024 12Stocks.com Terms & Conditions Privacy Contact Us
All Information Provided Only For Education And Not To Be Used For Investing or Trading. See Terms & Conditions


One More Thing ... Get Best Stocks Delivered Daily!
Never Ever Miss A Move With Our Top Ten Stocks Lists
Find Best Stocks In Any Market - Bull or Bear Market
Take A Peek At Our Top Ten Stocks Lists: Daily, Weekly, Year-to-Date & Top Trends
Find Best Stocks In Any Market - Bull or Bear Market
Take A Peek At Our Top Ten Stocks Lists: Daily, Weekly, Year-to-Date & Top Trends
Smallcap Stocks With Best Up Trends [0-bearish to 100-bullish]: B. Riley[100], Central Pacific[100], California Water[100], Cricut [100], Carpenter [100], Haemonetics [100], Sanmina [100], Trustmark [100], Comstock Resources[100], EchoStar [100], Mueller Industries[100]
Best Smallcap Stocks Year-to-Date:
CareMax [490.72%], Janux [338.34%], Viking [270.02%], Alpine Immune[239.52%], Longboard [218%], Super Micro[177%], Arcutis Bio[166.56%], Avidity Biosciences[159.79%], Vera [149.94%], Hippo [128.87%], Stoke [122.15%] Best Smallcap Stocks This Week:
Matterport [168.97%], B. Riley[73.54%], Impinj [33.73%], ProKidney [32.84%], Seres [32.65%], Riot Blockchain[32.64%], Ribbon [25.58%], Cullinan Oncology[22.92%], P.A.M. Transportation[22.85%], NuScale Power[21.44%], Hibbett Sports[21.03%] Best Smallcap Stocks Daily:
Impinj [28.65%], P.A.M. Transportation[17.95%], B. Riley[16.61%], Strategic Education[16.28%], OptiNose [14.56%], JELD-WEN Holding[11.54%], Sonic Automotive[10.86%], Intevac [10.54%], SiTime [8.84%], Noodles & [8.08%], ProKidney [7.75%]