
 Login Sign Up


| |||||
 |  | ||||

| 12Stocks.com Market Intelligence |
Best SmallCap Stocks
|
| In a hurry? Small Cap Stock Lists: Performance Trends Table, Stock Charts
Sort Small Cap stocks: Daily, Weekly, Year-to-Date, Market Cap & Trends. Filter Small Cap stocks list by sector: Show all, Tech, Finance, Energy, Staples, Retail, Industrial, Materials, Utilities and HealthCare Filter Small Cap stocks list by size: All Large Medium Small and MicroCap |
| 12Stocks.com Small Cap Stocks Performances & Trends Daily | |||||||||
|
|  The overall Smart Investing & Trading Score is 44 (0-bearish to 100-bullish) which puts Small Cap index in short term neutral trend. The Smart Investing & Trading Score from previous trading session is 13 and hence an improvement of trend.
| ||||||||
Here are the Smart Investing & Trading Scores of the most requested small cap stocks at 12Stocks.com (click stock name for detailed review):
|


| 12Stocks.com: Investing in Smallcap Index with Stocks | |
|
The following table helps investors and traders sort through current performance and trends (as measured by Smart Investing & Trading Score) of various
stocks in the Smallcap Index. Quick View: Move mouse or cursor over stock symbol (ticker) to view short-term technical chart and over stock name to view long term chart. Click on  to add stock symbol to your watchlist and to add stock symbol to your watchlist and  to view watchlist. Click on any ticker or stock name for detailed market intelligence report for that stock. to view watchlist. Click on any ticker or stock name for detailed market intelligence report for that stock. |
12Stocks.com Performance of Stocks in Smallcap Index
| Ticker | Stock Name | Watchlist | Category | Recent Price | Smart Investing & Trading Score | Change % | Weekly Change% |
| DCO | Ducommun |   | Industrials | 51.80 | 51 | 0.62% | -5.54% |
| BRZE | Braze | | Technology | 39.54 | 17 | 0.10% | -5.54% |
| FLNC | Fluence Energy | | Utilities | 15.87 | 25 | -0.87% | -5.54% |
| LZ | LegalZoom.com | | Industrials | 11.98 | 41 | -0.13% | -5.56% |
| CVCO | Cavco Industries | | Industrials | 355.30 | 36 | 1.10% | -5.57% |
| VAXX | Vaxxinity | | Health Care | 0.46 | 25 | 10.05% | -5.58% |
| AVXL | Anavex Life | | Health Care | 4.05 | 20 | -0.37% | -5.59% |
| GAMB | Gambling.com Group | | Services & Goods | 8.59 | 50 | 0.12% | -5.60% |
| IRBT | iRobot | | Consumer Staples | 7.41 | 10 | 5.41% | -5.61% |
| TLYS | Tilly s | | Services & Goods | 5.51 | 10 | 1.29% | -5.65% |
| CNS | Cohen & Steers | | Financials | 65.97 | 0 | -1.35% | -5.68% |
| PBF | PBF Energy | | Energy | 56.33 | 36 | -1.65% | -5.68% |
| HLX | Helix Energy | | Energy | 10.94 | 58 | 2.34% | -5.69% |
| STEM | Stem | | Technology | 1.65 | 42 | 4.43% | -5.71% |
| MXL | MaxLinear | | Technology | 20.79 | 43 | 1.12% | -5.71% |
| IONQ | IonQ | | Technology | 7.57 | 25 | 3.98% | -5.73% |
| MCRB | Seres | | Health Care | 0.62 | 10 | -1.63% | -5.74% |
| PTGX | Protagonist | | Health Care | 25.48 | 26 | -0.33% | -5.75% |
| INSE | Inspired Entertainment | | Services & Goods | 9.02 | 18 | -0.22% | -5.75% |
| GDEN | Golden Entertainment | | Services & Goods | 33.60 | 10 | 0.34% | -5.76% |
| LXP | Lexington Realty | | Financials | 8.54 | 10 | 0.18% | -5.79% |
| PCH | PotlatchDeltic | | Industrials | 41.33 | 10 | 0.38% | -5.89% |
| TDW | Tidewater | | Energy | 91.15 | 36 | 1.21% | -5.92% |
| QNST | QuinStreet | | Technology | 16.20 | 36 | -4.54% | -5.98% |
| ZIP | ZipRecruiter | | Industrials | 10.52 | 17 | 1.54% | -5.99% |
| For chart view version of above stock list: Chart View ➞ 0 - 25 , 25 - 50 , 50 - 75 , 75 - 100 , 100 - 125 , 125 - 150 , 150 - 175 , 175 - 200 , 200 - 225 , 225 - 250 , 250 - 275 , 275 - 300 , 300 - 325 , 325 - 350 , 350 - 375 , 375 - 400 , 400 - 425 , 425 - 450 , 450 - 475 , 475 - 500 , 500 - 525 , 525 - 550 , 550 - 575 , 575 - 600 , 600 - 625 , 625 - 650 , 650 - 675 , 675 - 700 , 700 - 725 , 725 - 750 , 750 - 775 , 775 - 800 , 800 - 825 , 825 - 850 , 850 - 875 , 875 - 900 , 900 - 925 , 925 - 950 , 950 - 975 , 975 - 1000 , 1000 - 1025 , 1025 - 1050 , 1050 - 1075 , 1075 - 1100 , 1100 - 1125 , 1125 - 1150 , 1150 - 1175 , 1175 - 1200 , 1200 - 1225 , 1225 - 1250 , 1250 - 1275 , 1275 - 1300 , 1300 - 1325 , 1325 - 1350 , 1350 - 1375 , 1375 - 1400 , 1400 - 1425 , 1425 - 1450 , 1450 - 1475 , 1475 - 1500 | ||
 | Click To Change The Sort Order: By Market Cap or Company Size Performance: Year-to-date, Week and Day |  |
| Too many stocks? View smallcap stocks filtered by marketcap & sector |
| Marketcap: All SmallCap Stocks (default-no microcap), Large, Mid-Range, Small |
| Smallcap Sector: Tech, Finance, Energy, Staples, Retail, Industrial, Materials, & Medical |
|
Get the most comprehensive stock market coverage daily at 12Stocks.com ➞ Best Stocks Today ➞ Best Stocks Weekly ➞ Best Stocks Year-to-Date ➞ Best Stocks Trends ➞  Best Stocks Today 12Stocks.com Best Nasdaq Stocks ➞ Best S&P 500 Stocks ➞ Best Tech Stocks ➞ Best Biotech Stocks ➞ |
| Detailed Overview of SmallCap Stocks |
| SmallCap Technical Overview, Leaders & Laggards, Top SmallCap ETF Funds & Detailed SmallCap Stocks List, Charts, Trends & More |
| Smallcap: Technical Analysis, Trends & YTD Performance | |
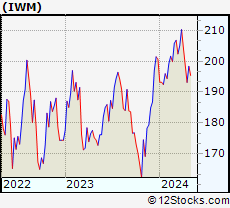
| SmallCap segment as represented by
IWM, an exchange-traded fund [ETF], holds basket of thousands of smallcap stocks from across all major sectors of the US stock market. The smallcap index (contains stocks like Riverbed & Sotheby's) is down by -2.78% and is currently underperforming the overall market by -7.83% year-to-date. Below is a quick view of technical charts and trends: | |
 IWM Weekly Chart |
|
| Long Term Trend: Good | |
| Medium Term Trend: Not Good | |
 IWM Daily Chart |
|
| Short Term Trend: Deteriorating | |
| Overall Trend Score: 44 | |
| YTD Performance: -2.78% | |
| **Trend Scores & Views Are Only For Educational Purposes And Not For Investing | |
| 12Stocks.com: Top Performing Small Cap Index Stocks | ||||||||||||||||||||||||||||||||||||||||||||||||
 The top performing Small Cap Index stocks year to date are
Now, more recently, over last week, the top performing Small Cap Index stocks on the move are


|
||||||||||||||||||||||||||||||||||||||||||||||||
| 12Stocks.com: Investing in Smallcap Index using Exchange Traded Funds | |
|
The following table shows list of key exchange traded funds (ETF) that
help investors track Smallcap index. The following list also includes leveraged ETF funds that track twice or thrice the daily returns of Smallcap indices. Short or inverse ETF funds move in the opposite direction to the index they track and are useful during market pullbacks or during bear markets. Quick View: Move mouse or cursor over ETF symbol (ticker) to view short-term technical chart and over ETF name to view long term chart. Click on ticker or stock name for detailed view. Click on to add stock symbol to your watchlist and to view watchlist. |
12Stocks.com List of ETFs that track Smallcap Index
| Ticker | ETF Name | Watchlist | Recent Price | Smart Investing & Trading Score | Change % | Week % | Year-to-date % |
| IWM | iShares Russell 2000 | | 195.14 | 44 | 1.11 | -1.79 | -2.78% |
| IJR | iShares Core S&P Small-Cap | | 103.30 | 38 | 1.15 | -1.16 | -4.57% |
| IWN | iShares Russell 2000 Value | | 146.73 | 10 | 0.48 | -2.43 | -5.54% |
| IWO | iShares Russell 2000 Growth | | 248.39 | 36 | 0.15 | -2.73 | -1.52% |
| IJS | iShares S&P Small-Cap 600 Value | | 94.21 | 10 | 0.10 | -2.04 | -8.6% |
| XSLV | PowerShares S&P SmallCap Low Volatil ETF | | 41.58 | 18 | 0.39 | -1.21 | -5.82% |
| 12Stocks.com: Charts, Trends, Fundamental Data and Performances of SmallCap Stocks | |
|
We now take in-depth look at all SmallCap stocks including charts, multi-period performances and overall trends (as measured by Smart Investing & Trading Score). One can sort SmallCap stocks (click link to choose) by Daily, Weekly and by Year-to-Date performances. Also, one can sort by size of the company or by market capitalization. |
| Select Your Default Chart Type: | |||||
| |||||
| Click on stock symbol or name for detailed view. Click on to add stock symbol to your watchlist and to view watchlist. Quick View: Move mouse or cursor over "Daily" to quickly view daily technical stock chart and over "Weekly" to view weekly technical stock chart. | |||||

 | DCO Ducommun Incorporated |
| Sector: Industrials | |
| SubSector: Aerospace/Defense Products & Services | |
| MarketCap: 261.101 Millions | |
| Recent Price: 51.80 Smart Investing & Trading Score: 51 | |
| Day Percent Change: 0.62% Day Change: 0.32 | |
| Week Change: -5.54% Year-to-date Change: -0.5% | |
| DCO Links: Profile News Message Board | |
| Charts:- Daily , Weekly | |
| Add DCO to Watchlist: View: Get Complete DCO Trend Analysis ➞ | |
 | BRZE Braze, Inc. |
| Sector: Technology | |
| SubSector: Software - Application | |
| MarketCap: 4340 Millions | |
| Recent Price: 39.54 Smart Investing & Trading Score: 17 | |
| Day Percent Change: 0.10% Day Change: 0.04 | |
| Week Change: -5.54% Year-to-date Change: -25.7% | |
| BRZE Links: Profile News Message Board | |
| Charts:- Daily , Weekly | |
| Add BRZE to Watchlist: View: Get Complete BRZE Trend Analysis ➞ | |
 | FLNC Fluence Energy, Inc. |
| Sector: Utilities | |
| SubSector: Utilities - Renewable | |
| MarketCap: 4550 Millions | |
| Recent Price: 15.87 Smart Investing & Trading Score: 25 | |
| Day Percent Change: -0.87% Day Change: -0.14 | |
| Week Change: -5.54% Year-to-date Change: -33.7% | |
| FLNC Links: Profile News Message Board | |
| Charts:- Daily , Weekly | |
| Add FLNC to Watchlist: View: Get Complete FLNC Trend Analysis ➞ | |
 | LZ LegalZoom.com, Inc. |
| Sector: Industrials | |
| SubSector: Specialty Business Services | |
| MarketCap: 2330 Millions | |
| Recent Price: 11.98 Smart Investing & Trading Score: 41 | |
| Day Percent Change: -0.13% Day Change: -0.02 | |
| Week Change: -5.56% Year-to-date Change: 5.6% | |
| LZ Links: Profile News Message Board | |
| Charts:- Daily , Weekly | |
| Add LZ to Watchlist: View: Get Complete LZ Trend Analysis ➞ | |
 | CVCO Cavco Industries, Inc. |
| Sector: Industrials | |
| SubSector: Residential Construction | |
| MarketCap: 1375.86 Millions | |
| Recent Price: 355.30 Smart Investing & Trading Score: 36 | |
| Day Percent Change: 1.10% Day Change: 3.85 | |
| Week Change: -5.57% Year-to-date Change: 2.5% | |
| CVCO Links: Profile News Message Board | |
| Charts:- Daily , Weekly | |
| Add CVCO to Watchlist: View: Get Complete CVCO Trend Analysis ➞ | |
 | VAXX Vaxxinity, Inc. |
| Sector: Health Care | |
| SubSector: Biotechnology | |
| MarketCap: 320 Millions | |
| Recent Price: 0.46 Smart Investing & Trading Score: 25 | |
| Day Percent Change: 10.05% Day Change: 0.04 | |
| Week Change: -5.58% Year-to-date Change: -45.2% | |
| VAXX Links: Profile News Message Board | |
| Charts:- Daily , Weekly | |
| Add VAXX to Watchlist: View: Get Complete VAXX Trend Analysis ➞ | |
 | AVXL Anavex Life Sciences Corp. |
| Sector: Health Care | |
| SubSector: Biotechnology | |
| MarketCap: 175.985 Millions | |
| Recent Price: 4.05 Smart Investing & Trading Score: 20 | |
| Day Percent Change: -0.37% Day Change: -0.02 | |
| Week Change: -5.59% Year-to-date Change: -56.4% | |
| AVXL Links: Profile News Message Board | |
| Charts:- Daily , Weekly | |
| Add AVXL to Watchlist: View: Get Complete AVXL Trend Analysis ➞ | |
 | GAMB Gambling.com Group Limited |
| Sector: Services & Goods | |
| SubSector: Gambling | |
| MarketCap: 376 Millions | |
| Recent Price: 8.59 Smart Investing & Trading Score: 50 | |
| Day Percent Change: 0.12% Day Change: 0.01 | |
| Week Change: -5.6% Year-to-date Change: -12.0% | |
| GAMB Links: Profile News Message Board | |
| Charts:- Daily , Weekly | |
| Add GAMB to Watchlist: View: Get Complete GAMB Trend Analysis ➞ | |
 | IRBT iRobot Corporation |
| Sector: Consumer Staples | |
| SubSector: Appliances | |
| MarketCap: 1193.38 Millions | |
| Recent Price: 7.41 Smart Investing & Trading Score: 10 | |
| Day Percent Change: 5.41% Day Change: 0.38 | |
| Week Change: -5.61% Year-to-date Change: -80.9% | |
| IRBT Links: Profile News Message Board | |
| Charts:- Daily , Weekly | |
| Add IRBT to Watchlist: View: Get Complete IRBT Trend Analysis ➞ | |
 | TLYS Tilly s, Inc. |
| Sector: Services & Goods | |
| SubSector: Apparel Stores | |
| MarketCap: 127.408 Millions | |
| Recent Price: 5.51 Smart Investing & Trading Score: 10 | |
| Day Percent Change: 1.29% Day Change: 0.07 | |
| Week Change: -5.65% Year-to-date Change: -26.9% | |
| TLYS Links: Profile News Message Board | |
| Charts:- Daily , Weekly | |
| Add TLYS to Watchlist: View: Get Complete TLYS Trend Analysis ➞ | |
 | CNS Cohen & Steers, Inc. |
| Sector: Financials | |
| SubSector: Asset Management | |
| MarketCap: 2082.43 Millions | |
| Recent Price: 65.97 Smart Investing & Trading Score: 0 | |
| Day Percent Change: -1.35% Day Change: -0.91 | |
| Week Change: -5.68% Year-to-date Change: -12.9% | |
| CNS Links: Profile News Message Board | |
| Charts:- Daily , Weekly | |
| Add CNS to Watchlist: View: Get Complete CNS Trend Analysis ➞ | |
 | PBF PBF Energy Inc |
| Sector: Energy | |
| SubSector: Oil & Gas Refining & Marketing | |
| MarketCap: 1118.54 Millions | |
| Recent Price: 56.33 Smart Investing & Trading Score: 36 | |
| Day Percent Change: -1.65% Day Change: -0.95 | |
| Week Change: -5.68% Year-to-date Change: 28.1% | |
| PBF Links: Profile News Message Board | |
| Charts:- Daily , Weekly | |
| Add PBF to Watchlist: View: Get Complete PBF Trend Analysis ➞ | |
 | HLX Helix Energy Solutions Group, Inc. |
| Sector: Energy | |
| SubSector: Oil & Gas Equipment & Services | |
| MarketCap: 341.661 Millions | |
| Recent Price: 10.94 Smart Investing & Trading Score: 58 | |
| Day Percent Change: 2.34% Day Change: 0.25 | |
| Week Change: -5.69% Year-to-date Change: 6.4% | |
| HLX Links: Profile News Message Board | |
| Charts:- Daily , Weekly | |
| Add HLX to Watchlist: View: Get Complete HLX Trend Analysis ➞ | |
 | STEM Stem, Inc. |
| Sector: Technology | |
| SubSector: Software - Infrastructure | |
| MarketCap: 836 Millions | |
| Recent Price: 1.65 Smart Investing & Trading Score: 42 | |
| Day Percent Change: 4.43% Day Change: 0.07 | |
| Week Change: -5.71% Year-to-date Change: -57.0% | |
| STEM Links: Profile News Message Board | |
| Charts:- Daily , Weekly | |
| Add STEM to Watchlist: View: Get Complete STEM Trend Analysis ➞ | |
 | MXL MaxLinear, Inc. |
| Sector: Technology | |
| SubSector: Semiconductor - Integrated Circuits | |
| MarketCap: 751.31 Millions | |
| Recent Price: 20.79 Smart Investing & Trading Score: 43 | |
| Day Percent Change: 1.12% Day Change: 0.23 | |
| Week Change: -5.71% Year-to-date Change: -12.5% | |
| MXL Links: Profile News Message Board | |
| Charts:- Daily , Weekly | |
| Add MXL to Watchlist: View: Get Complete MXL Trend Analysis ➞ | |
 | IONQ IonQ, Inc. |
| Sector: Technology | |
| SubSector: Computer Hardware | |
| MarketCap: 2680 Millions | |
| Recent Price: 7.57 Smart Investing & Trading Score: 25 | |
| Day Percent Change: 3.98% Day Change: 0.29 | |
| Week Change: -5.73% Year-to-date Change: -39.3% | |
| IONQ Links: Profile News Message Board | |
| Charts:- Daily , Weekly | |
| Add IONQ to Watchlist: View: Get Complete IONQ Trend Analysis ➞ | |
 | MCRB Seres Therapeutics, Inc. |
| Sector: Health Care | |
| SubSector: Biotechnology | |
| MarketCap: 217.585 Millions | |
| Recent Price: 0.62 Smart Investing & Trading Score: 10 | |
| Day Percent Change: -1.63% Day Change: -0.01 | |
| Week Change: -5.74% Year-to-date Change: -55.9% | |
| MCRB Links: Profile News Message Board | |
| Charts:- Daily , Weekly | |
| Add MCRB to Watchlist: View: Get Complete MCRB Trend Analysis ➞ | |
 | PTGX Protagonist Therapeutics, Inc. |
| Sector: Health Care | |
| SubSector: Biotechnology | |
| MarketCap: 165.285 Millions | |
| Recent Price: 25.48 Smart Investing & Trading Score: 26 | |
| Day Percent Change: -0.33% Day Change: -0.09 | |
| Week Change: -5.75% Year-to-date Change: 11.1% | |
| PTGX Links: Profile News Message Board | |
| Charts:- Daily , Weekly | |
| Add PTGX to Watchlist: View: Get Complete PTGX Trend Analysis ➞ | |
 | INSE Inspired Entertainment, Inc. |
| Sector: Services & Goods | |
| SubSector: Gaming Activities | |
| MarketCap: 80.9289 Millions | |
| Recent Price: 9.02 Smart Investing & Trading Score: 18 | |
| Day Percent Change: -0.22% Day Change: -0.02 | |
| Week Change: -5.75% Year-to-date Change: -8.7% | |
| INSE Links: Profile News Message Board | |
| Charts:- Daily , Weekly | |
| Add INSE to Watchlist: View: Get Complete INSE Trend Analysis ➞ | |
 | GDEN Golden Entertainment, Inc. |
| Sector: Services & Goods | |
| SubSector: Resorts & Casinos | |
| MarketCap: 130.794 Millions | |
| Recent Price: 33.60 Smart Investing & Trading Score: 10 | |
| Day Percent Change: 0.34% Day Change: 0.11 | |
| Week Change: -5.76% Year-to-date Change: -15.8% | |
| GDEN Links: Profile News Message Board | |
| Charts:- Daily , Weekly | |
| Add GDEN to Watchlist: View: Get Complete GDEN Trend Analysis ➞ | |
 | LXP Lexington Realty Trust |
| Sector: Financials | |
| SubSector: REIT - Diversified | |
| MarketCap: 2483.43 Millions | |
| Recent Price: 8.54 Smart Investing & Trading Score: 10 | |
| Day Percent Change: 0.18% Day Change: 0.02 | |
| Week Change: -5.79% Year-to-date Change: -13.9% | |
| LXP Links: Profile News Message Board | |
| Charts:- Daily , Weekly | |
| Add LXP to Watchlist: View: Get Complete LXP Trend Analysis ➞ | |
 | PCH PotlatchDeltic Corporation |
| Sector: Industrials | |
| SubSector: Lumber, Wood Production | |
| MarketCap: 2314.68 Millions | |
| Recent Price: 41.33 Smart Investing & Trading Score: 10 | |
| Day Percent Change: 0.38% Day Change: 0.16 | |
| Week Change: -5.89% Year-to-date Change: -15.8% | |
| PCH Links: Profile News Message Board | |
| Charts:- Daily , Weekly | |
| Add PCH to Watchlist: View: Get Complete PCH Trend Analysis ➞ | |
 | TDW Tidewater Inc. |
| Sector: Energy | |
| SubSector: Oil & Gas Equipment & Services | |
| MarketCap: 295.061 Millions | |
| Recent Price: 91.15 Smart Investing & Trading Score: 36 | |
| Day Percent Change: 1.21% Day Change: 1.09 | |
| Week Change: -5.92% Year-to-date Change: 26.4% | |
| TDW Links: Profile News Message Board | |
| Charts:- Daily , Weekly | |
| Add TDW to Watchlist: View: Get Complete TDW Trend Analysis ➞ | |
 | QNST QuinStreet, Inc. |
| Sector: Technology | |
| SubSector: Internet Software & Services | |
| MarketCap: 411.791 Millions | |
| Recent Price: 16.20 Smart Investing & Trading Score: 36 | |
| Day Percent Change: -4.54% Day Change: -0.77 | |
| Week Change: -5.98% Year-to-date Change: 26.4% | |
| QNST Links: Profile News Message Board | |
| Charts:- Daily , Weekly | |
| Add QNST to Watchlist: View: Get Complete QNST Trend Analysis ➞ | |
 | ZIP ZipRecruiter, Inc. |
| Sector: Industrials | |
| SubSector: Staffing & Employment Services | |
| MarketCap: 1730 Millions | |
| Recent Price: 10.52 Smart Investing & Trading Score: 17 | |
| Day Percent Change: 1.54% Day Change: 0.16 | |
| Week Change: -5.99% Year-to-date Change: -24.9% | |
| ZIP Links: Profile News Message Board | |
| Charts:- Daily , Weekly | |
| Add ZIP to Watchlist: View: Get Complete ZIP Trend Analysis ➞ | |
| For tabular summary view of above stock list: Summary View ➞ 0 - 25 , 25 - 50 , 50 - 75 , 75 - 100 , 100 - 125 , 125 - 150 , 150 - 175 , 175 - 200 , 200 - 225 , 225 - 250 , 250 - 275 , 275 - 300 , 300 - 325 , 325 - 350 , 350 - 375 , 375 - 400 , 400 - 425 , 425 - 450 , 450 - 475 , 475 - 500 , 500 - 525 , 525 - 550 , 550 - 575 , 575 - 600 , 600 - 625 , 625 - 650 , 650 - 675 , 675 - 700 , 700 - 725 , 725 - 750 , 750 - 775 , 775 - 800 , 800 - 825 , 825 - 850 , 850 - 875 , 875 - 900 , 900 - 925 , 925 - 950 , 950 - 975 , 975 - 1000 , 1000 - 1025 , 1025 - 1050 , 1050 - 1075 , 1075 - 1100 , 1100 - 1125 , 1125 - 1150 , 1150 - 1175 , 1175 - 1200 , 1200 - 1225 , 1225 - 1250 , 1250 - 1275 , 1275 - 1300 , 1300 - 1325 , 1325 - 1350 , 1350 - 1375 , 1375 - 1400 , 1400 - 1425 , 1425 - 1450 , 1450 - 1475 , 1475 - 1500 | ||
| Click To Change The Sort Order: By Market Cap or Company Size Performance: Year-to-date, Week and Day | |
| Select Chart Type: | ||
| Too many stocks? View smallcap stocks filtered by marketcap & sector |
| Marketcap: All SmallCap Stocks (default-no microcap), Large, Mid-Range, Small & MicroCap |
| Sector: Tech, Finance, Energy, Staples, Retail, Industrial, Materials, Utilities & Medical |
|
Best Stocks Today 12Stocks.com |
© 2024 12Stocks.com Terms & Conditions Privacy Contact Us
All Information Provided Only For Education And Not To Be Used For Investing or Trading. See Terms & Conditions


One More Thing ... Get Best Stocks Delivered Daily!
Never Ever Miss A Move With Our Top Ten Stocks Lists
Find Best Stocks In Any Market - Bull or Bear Market
Take A Peek At Our Top Ten Stocks Lists: Daily, Weekly, Year-to-Date & Top Trends
Find Best Stocks In Any Market - Bull or Bear Market
Take A Peek At Our Top Ten Stocks Lists: Daily, Weekly, Year-to-Date & Top Trends
Smallcap Stocks With Best Up Trends [0-bearish to 100-bullish]: Badger Meter[100], Apogee Enterprises[100], Cullinan Oncology[100], Oscar Health[100], Richardson Electronics[100], NextNav [100], Lantheus [100], Envestnet [100], Geron [100], Seneca Foods[100], IMAX [100]
Best Smallcap Stocks Year-to-Date:
Agenus [522.66%], CareMax [417.53%], Janux [348.12%], Viking [251.48%], Super Micro[239.3%], Alpine Immune[238.6%], Longboard [184.12%], Vera [161.3%], Avidity Biosciences[159.18%], Hippo [128.32%], Acrivon [118.61%] Best Smallcap Stocks This Week:
Macatawa Bank[45.05%], 23andMe Holding[33.3%], ProKidney [32%], Snap One[29.73%], Vertex Energy[25.96%], ALX Oncology[22.79%], Vanda [21.84%], Expensify [18.37%], E.W. Scripps[15%], Cullinan Oncology[13.89%], Humacyte [12.67%] Best Smallcap Stocks Daily:
23andMe Holding[65.91%], Vertex Energy[33.78%], Expensify [15.23%], Vuzix [13.73%], Badger Meter[12.03%], E.W. Scripps[11.68%], Zura Bio[10.99%], Vaxxinity [10.05%], Barnes Group[9.70%], eHealth [9.68%], Montrose Environmental[8.91%]