
 Login Sign Up


| |||||
 |  | ||||

| 12Stocks.com Market Intelligence |
Best SmallCap Stocks
|
| In a hurry? Small Cap Stock Lists: Performance Trends Table, Stock Charts
Sort Small Cap stocks: Daily, Weekly, Year-to-Date, Market Cap & Trends. Filter Small Cap stocks list by sector: Show all, Tech, Finance, Energy, Staples, Retail, Industrial, Materials, Utilities and HealthCare Filter Small Cap stocks list by size: All Large Medium Small and MicroCap |
| 12Stocks.com Small Cap Stocks Performances & Trends Daily | |||||||||
|
|  The overall Smart Investing & Trading Score is 44 (0-bearish to 100-bullish) which puts Small Cap index in short term neutral trend. The Smart Investing & Trading Score from previous trading session is 58 and hence a deterioration of trend.
| ||||||||
Here are the Smart Investing & Trading Scores of the most requested small cap stocks at 12Stocks.com (click stock name for detailed review):
|


| 12Stocks.com: Investing in Smallcap Index with Stocks | |
|
The following table helps investors and traders sort through current performance and trends (as measured by Smart Investing & Trading Score) of various
stocks in the Smallcap Index. Quick View: Move mouse or cursor over stock symbol (ticker) to view short-term technical chart and over stock name to view long term chart. Click on  to add stock symbol to your watchlist and to add stock symbol to your watchlist and  to view watchlist. Click on any ticker or stock name for detailed market intelligence report for that stock. to view watchlist. Click on any ticker or stock name for detailed market intelligence report for that stock. |
12Stocks.com Performance of Stocks in Smallcap Index
| Ticker | Stock Name | Watchlist | Category | Recent Price | Smart Investing & Trading Score | Change % | Weekly Change% |
| RXRX | Recursion |   | Health Care | 7.84 | 25 | -1.38% | 6.67% |
| EAF | GrafTech | | Industrials | 1.61 | 66 | -2.42% | 6.62% |
| DIOD | Diodes | | Technology | 71.30 | 100 | 0.56% | 6.59% |
| ZUO | Zuora | | Technology | 9.86 | 73 | -1.69% | 6.59% |
| GOGL | Golden Ocean | | Transports | 13.82 | 90 | 1.69% | 6.55% |
| AMAL | Amalgamated Bank | | Financials | 23.93 | 64 | -0.21% | 6.54% |
| EGHT | 8x8 | | Technology | 2.32 | 47 | -2.11% | 6.42% |
| ZETA | Zeta Global | | Technology | 12.45 | 88 | 2.26% | 6.41% |
| ASAN | Asana | | Technology | 14.47 | 42 | -3.40% | 6.40% |
| BLFS | BioLife Solutions | | Health Care | 16.86 | 86 | -1.92% | 6.31% |
| RMBS | Rambus | | Technology | 58.12 | 42 | 2.83% | 6.29% |
| PLXS | Plexus | | Technology | 99.09 | 93 | 3.57% | 6.27% |
| IBP | Installed Building | | Industrials | 235.22 | 56 | -0.01% | 6.27% |
| THR | Thermon Group | | Industrials | 31.59 | 42 | 1.77% | 6.22% |
| DBI | Designer Brands | | Services & Goods | 9.33 | 68 | -1.17% | 6.14% |
| FN | Fabrinet | | Technology | 172.20 | 35 | 1.34% | 6.09% |
| LMND | Lemonade | | Financials | 17.06 | 83 | -2.01% | 6.09% |
| BWMN | Bowman Consulting | | Industrials | 32.09 | 65 | 0.50% | 6.08% |
| TMDX | TransMedics Group | | Health Care | 89.28 | 86 | 0.46% | 6.06% |
| BIRD | Allbirds | | Services & Goods | 0.63 | 45 | -0.49% | 6.02% |
| PEBO | Peoples Bancorp | | Financials | 30.20 | 87 | 0.53% | 6.00% |
| GDOT | Green Dot | | Financials | 9.02 | 87 | 0.45% | 5.99% |
| FWRG | First Watch | | Services & Goods | 23.63 | 80 | 2.45% | 5.96% |
| ARRY | Array | | Technology | 11.94 | 83 | -2.37% | 5.94% |
| CARA | Cara | | Health Care | 0.70 | 61 | 4.23% | 5.90% |


| Too many stocks? View smallcap stocks filtered by marketcap & sector |
| Marketcap: All SmallCap Stocks (default-no microcap), Large, Mid-Range, Small |
| Smallcap Sector: Tech, Finance, Energy, Staples, Retail, Industrial, Materials, & Medical |
|
Get the most comprehensive stock market coverage daily at 12Stocks.com ➞ Best Stocks Today ➞ Best Stocks Weekly ➞ Best Stocks Year-to-Date ➞ Best Stocks Trends ➞  Best Stocks Today 12Stocks.com Best Nasdaq Stocks ➞ Best S&P 500 Stocks ➞ Best Tech Stocks ➞ Best Biotech Stocks ➞ |
| Detailed Overview of SmallCap Stocks |
| SmallCap Technical Overview, Leaders & Laggards, Top SmallCap ETF Funds & Detailed SmallCap Stocks List, Charts, Trends & More |
| Smallcap: Technical Analysis, Trends & YTD Performance | |
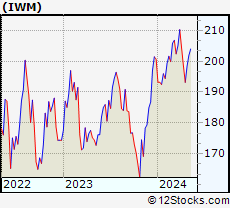
| SmallCap segment as represented by
IWM, an exchange-traded fund [ETF], holds basket of thousands of smallcap stocks from across all major sectors of the US stock market. The smallcap index (contains stocks like Riverbed & Sotheby's) is down by -2.11% and is currently underperforming the overall market by -7.27% year-to-date. Below is a quick view of technical charts and trends: | |
 IWM Weekly Chart |
|
| Long Term Trend: Good | |
| Medium Term Trend: Not Good | |
 IWM Daily Chart |
|
| Short Term Trend: Very Good | |
| Overall Trend Score: 44 | |
| YTD Performance: -2.11% | |
| **Trend Scores & Views Are Only For Educational Purposes And Not For Investing | |
| 12Stocks.com: Top Performing Small Cap Index Stocks | ||||||||||||||||||||||||||||||||||||||||||||||||
 The top performing Small Cap Index stocks year to date are
Now, more recently, over last week, the top performing Small Cap Index stocks on the move are


|
||||||||||||||||||||||||||||||||||||||||||||||||
| 12Stocks.com: Investing in Smallcap Index using Exchange Traded Funds | |
|
The following table shows list of key exchange traded funds (ETF) that
help investors track Smallcap index. The following list also includes leveraged ETF funds that track twice or thrice the daily returns of Smallcap indices. Short or inverse ETF funds move in the opposite direction to the index they track and are useful during market pullbacks or during bear markets. Quick View: Move mouse or cursor over ETF symbol (ticker) to view short-term technical chart and over ETF name to view long term chart. Click on ticker or stock name for detailed view. Click on to add stock symbol to your watchlist and to view watchlist. |
12Stocks.com List of ETFs that track Smallcap Index
| Ticker | ETF Name | Watchlist | Recent Price | Smart Investing & Trading Score | Change % | Week % | Year-to-date % |
| IWM | iShares Russell 2000 | | 196.48 | 44 | -0.61 | 1.73 | -2.11% |
| IJR | iShares Core S&P Small-Cap | | 104.86 | 78 | -0.80 | 1.59 | -3.13% |
| VTWO | Vanguard Russell 2000 ETF | | 79.45 | 63 | -0.60 | 1.75 | -2.03% |
| IWN | iShares Russell 2000 Value | | 150.18 | 68 | -0.73 | 1.62 | -3.32% |
| IWO | iShares Russell 2000 Growth | | 249.86 | 51 | -0.56 | 1.86 | -0.94% |
| IJS | iShares S&P Small-Cap 600 Value | | 96.69 | 60 | -1.04 | 1.13 | -6.19% |
| IJT | iShares S&P Small-Cap 600 Growth | | 125.06 | 63 | -0.25 | 2.33 | -0.06% |
| XSLV | PowerShares S&P SmallCap Low Volatil ETF | | 42.54 | 73 | -0.93 | 0.85 | -3.65% |
| SDD | ProShares UltraShort SmallCap600 | | 19.58 | 42 | 0.46 | -3.74 | 6.26% |
| SBB | ProShares Short SmallCap600 | | 16.50 | 40 | 0.79 | -2.02 | 3.58% |
| SMLV | SPDR SSGA US Small Cap Low Volatil ETF | | 107.33 | 73 | -1.01 | 1.17 | -4.61% |
| SAA | ProShares Ultra SmallCap600 | | 22.66 | 58 | -1.52 | 3.94 | -9.18% |
| 12Stocks.com: Charts, Trends, Fundamental Data and Performances of SmallCap Stocks | |
|
We now take in-depth look at all SmallCap stocks including charts, multi-period performances and overall trends (as measured by Smart Investing & Trading Score). One can sort SmallCap stocks (click link to choose) by Daily, Weekly and by Year-to-Date performances. Also, one can sort by size of the company or by market capitalization. |
| Select Your Default Chart Type: | |||||
| |||||
| Click on stock symbol or name for detailed view. Click on to add stock symbol to your watchlist and to view watchlist. Quick View: Move mouse or cursor over "Daily" to quickly view daily technical stock chart and over "Weekly" to view weekly technical stock chart. | |||||

 | RXRX Recursion Pharmaceuticals, Inc. |
| Sector: Health Care | |
| SubSector: Biotechnology | |
| MarketCap: 1470 Millions | |
| Recent Price: 7.84 Smart Investing & Trading Score: 25 | |
| Day Percent Change: -1.38% Day Change: -0.11 | |
| Week Change: 6.67% Year-to-date Change: -19.9% | |
| RXRX Links: Profile News Message Board | |
| Charts:- Daily , Weekly | |
| Add RXRX to Watchlist: View: Get Complete RXRX Trend Analysis ➞ | |
 | EAF GrafTech International Ltd. |
| Sector: Industrials | |
| SubSector: Diversified Machinery | |
| MarketCap: 2084.36 Millions | |
| Recent Price: 1.61 Smart Investing & Trading Score: 66 | |
| Day Percent Change: -2.42% Day Change: -0.04 | |
| Week Change: 6.62% Year-to-date Change: -26.5% | |
| EAF Links: Profile News Message Board | |
| Charts:- Daily , Weekly | |
| Add EAF to Watchlist: View: Get Complete EAF Trend Analysis ➞ | |
 | DIOD Diodes Incorporated |
| Sector: Technology | |
| SubSector: Semiconductor - Integrated Circuits | |
| MarketCap: 1967.6 Millions | |
| Recent Price: 71.30 Smart Investing & Trading Score: 100 | |
| Day Percent Change: 0.56% Day Change: 0.40 | |
| Week Change: 6.59% Year-to-date Change: -11.5% | |
| DIOD Links: Profile News Message Board | |
| Charts:- Daily , Weekly | |
| Add DIOD to Watchlist: View: Get Complete DIOD Trend Analysis ➞ | |
 | ZUO Zuora, Inc. |
| Sector: Technology | |
| SubSector: Application Software | |
| MarketCap: 1063.22 Millions | |
| Recent Price: 9.86 Smart Investing & Trading Score: 73 | |
| Day Percent Change: -1.69% Day Change: -0.17 | |
| Week Change: 6.59% Year-to-date Change: 4.9% | |
| ZUO Links: Profile News Message Board | |
| Charts:- Daily , Weekly | |
| Add ZUO to Watchlist: View: Get Complete ZUO Trend Analysis ➞ | |
 | GOGL Golden Ocean Group Limited |
| Sector: Transports | |
| SubSector: Shipping | |
| MarketCap: 446.614 Millions | |
| Recent Price: 13.82 Smart Investing & Trading Score: 90 | |
| Day Percent Change: 1.69% Day Change: 0.23 | |
| Week Change: 6.55% Year-to-date Change: 41.6% | |
| GOGL Links: Profile News Message Board | |
| Charts:- Daily , Weekly | |
| Add GOGL to Watchlist: View: Get Complete GOGL Trend Analysis ➞ | |
 | AMAL Amalgamated Bank |
| Sector: Financials | |
| SubSector: Regional - Northeast Banks | |
| MarketCap: 321.899 Millions | |
| Recent Price: 23.93 Smart Investing & Trading Score: 64 | |
| Day Percent Change: -0.21% Day Change: -0.05 | |
| Week Change: 6.54% Year-to-date Change: -11.2% | |
| AMAL Links: Profile News Message Board | |
| Charts:- Daily , Weekly | |
| Add AMAL to Watchlist: View: Get Complete AMAL Trend Analysis ➞ | |
 | EGHT 8x8, Inc. |
| Sector: Technology | |
| SubSector: Diversified Communication Services | |
| MarketCap: 1861.64 Millions | |
| Recent Price: 2.32 Smart Investing & Trading Score: 47 | |
| Day Percent Change: -2.11% Day Change: -0.05 | |
| Week Change: 6.42% Year-to-date Change: -38.6% | |
| EGHT Links: Profile News Message Board | |
| Charts:- Daily , Weekly | |
| Add EGHT to Watchlist: View: Get Complete EGHT Trend Analysis ➞ | |
 | ZETA Zeta Global Holdings Corp. |
| Sector: Technology | |
| SubSector: Software - Application | |
| MarketCap: 1780 Millions | |
| Recent Price: 12.45 Smart Investing & Trading Score: 88 | |
| Day Percent Change: 2.26% Day Change: 0.27 | |
| Week Change: 6.41% Year-to-date Change: 41.1% | |
| ZETA Links: Profile News Message Board | |
| Charts:- Daily , Weekly | |
| Add ZETA to Watchlist: View: Get Complete ZETA Trend Analysis ➞ | |
 | ASAN Asana, Inc. |
| Sector: Technology | |
| SubSector: Software Application | |
| MarketCap: 45087 Millions | |
| Recent Price: 14.47 Smart Investing & Trading Score: 42 | |
| Day Percent Change: -3.40% Day Change: -0.51 | |
| Week Change: 6.4% Year-to-date Change: -23.9% | |
| ASAN Links: Profile News Message Board | |
| Charts:- Daily , Weekly | |
| Add ASAN to Watchlist: View: Get Complete ASAN Trend Analysis ➞ | |
 | BLFS BioLife Solutions, Inc. |
| Sector: Health Care | |
| SubSector: Medical Instruments & Supplies | |
| MarketCap: 264.36 Millions | |
| Recent Price: 16.86 Smart Investing & Trading Score: 86 | |
| Day Percent Change: -1.92% Day Change: -0.33 | |
| Week Change: 6.31% Year-to-date Change: 3.8% | |
| BLFS Links: Profile News Message Board | |
| Charts:- Daily , Weekly | |
| Add BLFS to Watchlist: View: Get Complete BLFS Trend Analysis ➞ | |
 | RMBS Rambus Inc. |
| Sector: Technology | |
| SubSector: Semiconductor- Memory Chips | |
| MarketCap: 1296 Millions | |
| Recent Price: 58.12 Smart Investing & Trading Score: 42 | |
| Day Percent Change: 2.83% Day Change: 1.60 | |
| Week Change: 6.29% Year-to-date Change: -14.8% | |
| RMBS Links: Profile News Message Board | |
| Charts:- Daily , Weekly | |
| Add RMBS to Watchlist: View: Get Complete RMBS Trend Analysis ➞ | |
 | PLXS Plexus Corp. |
| Sector: Technology | |
| SubSector: Printed Circuit Boards | |
| MarketCap: 1457.15 Millions | |
| Recent Price: 99.09 Smart Investing & Trading Score: 93 | |
| Day Percent Change: 3.57% Day Change: 3.42 | |
| Week Change: 6.27% Year-to-date Change: -8.4% | |
| PLXS Links: Profile News Message Board | |
| Charts:- Daily , Weekly | |
| Add PLXS to Watchlist: View: Get Complete PLXS Trend Analysis ➞ | |
 | IBP Installed Building Products, Inc. |
| Sector: Industrials | |
| SubSector: General Building Materials | |
| MarketCap: 1284.23 Millions | |
| Recent Price: 235.22 Smart Investing & Trading Score: 56 | |
| Day Percent Change: -0.01% Day Change: -0.03 | |
| Week Change: 6.27% Year-to-date Change: 28.7% | |
| IBP Links: Profile News Message Board | |
| Charts:- Daily , Weekly | |
| Add IBP to Watchlist: View: Get Complete IBP Trend Analysis ➞ | |
 | THR Thermon Group Holdings, Inc. |
| Sector: Industrials | |
| SubSector: Diversified Machinery | |
| MarketCap: 492.816 Millions | |
| Recent Price: 31.59 Smart Investing & Trading Score: 42 | |
| Day Percent Change: 1.77% Day Change: 0.55 | |
| Week Change: 6.22% Year-to-date Change: -3.0% | |
| THR Links: Profile News Message Board | |
| Charts:- Daily , Weekly | |
| Add THR to Watchlist: View: Get Complete THR Trend Analysis ➞ | |
 | DBI Designer Brands Inc. |
| Sector: Services & Goods | |
| SubSector: Apparel Stores | |
| MarketCap: 467.308 Millions | |
| Recent Price: 9.33 Smart Investing & Trading Score: 68 | |
| Day Percent Change: -1.17% Day Change: -0.11 | |
| Week Change: 6.14% Year-to-date Change: 5.4% | |
| DBI Links: Profile News Message Board | |
| Charts:- Daily , Weekly | |
| Add DBI to Watchlist: View: Get Complete DBI Trend Analysis ➞ | |
 | FN Fabrinet |
| Sector: Technology | |
| SubSector: Electronic Equipment | |
| MarketCap: 1876 Millions | |
| Recent Price: 172.20 Smart Investing & Trading Score: 35 | |
| Day Percent Change: 1.34% Day Change: 2.27 | |
| Week Change: 6.09% Year-to-date Change: -9.5% | |
| FN Links: Profile News Message Board | |
| Charts:- Daily , Weekly | |
| Add FN to Watchlist: View: Get Complete FN Trend Analysis ➞ | |
 | LMND Lemonade, Inc. |
| Sector: Financials | |
| SubSector: Insurance Property & Casualty | |
| MarketCap: 56457 Millions | |
| Recent Price: 17.06 Smart Investing & Trading Score: 83 | |
| Day Percent Change: -2.01% Day Change: -0.35 | |
| Week Change: 6.09% Year-to-date Change: 5.8% | |
| LMND Links: Profile News Message Board | |
| Charts:- Daily , Weekly | |
| Add LMND to Watchlist: View: Get Complete LMND Trend Analysis ➞ | |
 | BWMN Bowman Consulting Group Ltd. |
| Sector: Industrials | |
| SubSector: Engineering & Construction | |
| MarketCap: 443 Millions | |
| Recent Price: 32.09 Smart Investing & Trading Score: 65 | |
| Day Percent Change: 0.50% Day Change: 0.16 | |
| Week Change: 6.08% Year-to-date Change: -8.9% | |
| BWMN Links: Profile News Message Board | |
| Charts:- Daily , Weekly | |
| Add BWMN to Watchlist: View: Get Complete BWMN Trend Analysis ➞ | |
 | TMDX TransMedics Group, Inc. |
| Sector: Health Care | |
| SubSector: Medical Appliances & Equipment | |
| MarketCap: 331.68 Millions | |
| Recent Price: 89.28 Smart Investing & Trading Score: 86 | |
| Day Percent Change: 0.46% Day Change: 0.41 | |
| Week Change: 6.06% Year-to-date Change: 13.1% | |
| TMDX Links: Profile News Message Board | |
| Charts:- Daily , Weekly | |
| Add TMDX to Watchlist: View: Get Complete TMDX Trend Analysis ➞ | |
 | BIRD Allbirds, Inc. |
| Sector: Services & Goods | |
| SubSector: Apparel Retail | |
| MarketCap: 184 Millions | |
| Recent Price: 0.63 Smart Investing & Trading Score: 45 | |
| Day Percent Change: -0.49% Day Change: 0.00 | |
| Week Change: 6.02% Year-to-date Change: -48.5% | |
| BIRD Links: Profile News Message Board | |
| Charts:- Daily , Weekly | |
| Add BIRD to Watchlist: View: Get Complete BIRD Trend Analysis ➞ | |
 | PEBO Peoples Bancorp Inc. |
| Sector: Financials | |
| SubSector: Regional - Midwest Banks | |
| MarketCap: 449.77 Millions | |
| Recent Price: 30.20 Smart Investing & Trading Score: 87 | |
| Day Percent Change: 0.53% Day Change: 0.16 | |
| Week Change: 6% Year-to-date Change: -10.6% | |
| PEBO Links: Profile News Message Board | |
| Charts:- Daily , Weekly | |
| Add PEBO to Watchlist: View: Get Complete PEBO Trend Analysis ➞ | |
 | GDOT Green Dot Corporation |
| Sector: Financials | |
| SubSector: Credit Services | |
| MarketCap: 1320.08 Millions | |
| Recent Price: 9.02 Smart Investing & Trading Score: 87 | |
| Day Percent Change: 0.45% Day Change: 0.04 | |
| Week Change: 5.99% Year-to-date Change: -8.9% | |
| GDOT Links: Profile News Message Board | |
| Charts:- Daily , Weekly | |
| Add GDOT to Watchlist: View: Get Complete GDOT Trend Analysis ➞ | |
 | FWRG First Watch Restaurant Group, Inc. |
| Sector: Services & Goods | |
| SubSector: Restaurants | |
| MarketCap: 1000 Millions | |
| Recent Price: 23.63 Smart Investing & Trading Score: 80 | |
| Day Percent Change: 2.45% Day Change: 0.56 | |
| Week Change: 5.96% Year-to-date Change: 18.6% | |
| FWRG Links: Profile News Message Board | |
| Charts:- Daily , Weekly | |
| Add FWRG to Watchlist: View: Get Complete FWRG Trend Analysis ➞ | |
 | ARRY Array Technologies, Inc. |
| Sector: Technology | |
| SubSector: Solar | |
| MarketCap: 45887 Millions | |
| Recent Price: 11.94 Smart Investing & Trading Score: 83 | |
| Day Percent Change: -2.37% Day Change: -0.29 | |
| Week Change: 5.94% Year-to-date Change: -28.9% | |
| ARRY Links: Profile News Message Board | |
| Charts:- Daily , Weekly | |
| Add ARRY to Watchlist: View: Get Complete ARRY Trend Analysis ➞ | |
 | CARA Cara Therapeutics, Inc. |
| Sector: Health Care | |
| SubSector: Biotechnology | |
| MarketCap: 597.985 Millions | |
| Recent Price: 0.70 Smart Investing & Trading Score: 61 | |
| Day Percent Change: 4.23% Day Change: 0.03 | |
| Week Change: 5.9% Year-to-date Change: -5.8% | |
| CARA Links: Profile News Message Board | |
| Charts:- Daily , Weekly | |
| Add CARA to Watchlist: View: Get Complete CARA Trend Analysis ➞ | |
| Too many stocks? View smallcap stocks filtered by marketcap & sector |
| Marketcap: All SmallCap Stocks (default-no microcap), Large, Mid-Range, Small & MicroCap |
| Sector: Tech, Finance, Energy, Staples, Retail, Industrial, Materials, Utilities & Medical |
|
Best Stocks Today 12Stocks.com |
© 2024 12Stocks.com Terms & Conditions Privacy Contact Us
All Information Provided Only For Education And Not To Be Used For Investing or Trading. See Terms & Conditions


One More Thing ... Get Best Stocks Delivered Daily!
Never Ever Miss A Move With Our Top Ten Stocks Lists
Find Best Stocks In Any Market - Bull or Bear Market
Take A Peek At Our Top Ten Stocks Lists: Daily, Weekly, Year-to-Date & Top Trends
Find Best Stocks In Any Market - Bull or Bear Market
Take A Peek At Our Top Ten Stocks Lists: Daily, Weekly, Year-to-Date & Top Trends
Smallcap Stocks With Best Up Trends [0-bearish to 100-bullish]: B. Riley[100], Central Pacific[100], California Water[100], Cricut [100], Carpenter [100], Haemonetics [100], Sanmina [100], Trustmark [100], Comstock Resources[100], EchoStar [100], Mueller Industries[100]
Best Smallcap Stocks Year-to-Date:
CareMax [490.72%], Janux [338.34%], Viking [270.02%], Alpine Immune[239.52%], Longboard [218%], Super Micro[177%], Arcutis Bio[166.56%], Avidity Biosciences[159.79%], Vera [149.94%], Hippo [128.87%], Stoke [122.15%] Best Smallcap Stocks This Week:
Matterport [168.97%], B. Riley[73.54%], Impinj [33.73%], ProKidney [32.84%], Seres [32.65%], Riot Blockchain[32.64%], Ribbon [25.58%], Cullinan Oncology[22.92%], P.A.M. Transportation[22.85%], NuScale Power[21.44%], Hibbett Sports[21.03%] Best Smallcap Stocks Daily:
Impinj [28.65%], P.A.M. Transportation[17.95%], B. Riley[16.61%], Strategic Education[16.28%], OptiNose [14.56%], JELD-WEN Holding[11.54%], Sonic Automotive[10.86%], Intevac [10.54%], SiTime [8.84%], Noodles & [8.08%], ProKidney [7.75%]