
 Login Sign Up


| |||||
 |  | ||||

| 12Stocks.com Market Intelligence |
Best SmallCap Stocks
|
| In a hurry? Small Cap Stock Lists: Performance Trends Table, Stock Charts
Sort Small Cap stocks: Daily, Weekly, Year-to-Date, Market Cap & Trends. Filter Small Cap stocks list by sector: Show all, Tech, Finance, Energy, Staples, Retail, Industrial, Materials, Utilities and HealthCare Filter Small Cap stocks list by size: All Large Medium Small and MicroCap |
| 12Stocks.com Small Cap Stocks Performances & Trends Daily | |||||||||
|
|  The overall Smart Investing & Trading Score is 44 (0-bearish to 100-bullish) which puts Small Cap index in short term neutral trend. The Smart Investing & Trading Score from previous trading session is 13 and hence an improvement of trend.
| ||||||||
Here are the Smart Investing & Trading Scores of the most requested small cap stocks at 12Stocks.com (click stock name for detailed review):
|


| 12Stocks.com: Investing in Smallcap Index with Stocks | |
|
The following table helps investors and traders sort through current performance and trends (as measured by Smart Investing & Trading Score) of various
stocks in the Smallcap Index. Quick View: Move mouse or cursor over stock symbol (ticker) to view short-term technical chart and over stock name to view long term chart. Click on  to add stock symbol to your watchlist and to add stock symbol to your watchlist and  to view watchlist. Click on any ticker or stock name for detailed market intelligence report for that stock. to view watchlist. Click on any ticker or stock name for detailed market intelligence report for that stock. |
12Stocks.com Performance of Stocks in Smallcap Index
| Ticker | Stock Name | Watchlist | Category | Recent Price | Smart Investing & Trading Score | Change % | Weekly Change% |
| SWIM | Latham Group |   | Industrials | 3.21 | 53 | 1.10% | -6.83% |
| TARS | Tarsus | | Health Care | 33.68 | 31 | -2.21% | -6.88% |
| CRBU | Caribou Biosciences | | Health Care | 3.91 | 10 | -0.26% | -6.90% |
| TRDA | Entrada | | Health Care | 12.05 | 0 | -1.39% | -6.95% |
| VYGR | Voyager | | Health Care | 7.84 | 36 | 1.29% | -7.00% |
| MCRI | Monarch Casino | | Services & Goods | 65.60 | 0 | -5.71% | -7.03% |
| IDYA | IDEAYA Biosciences | | Health Care | 39.02 | 0 | -2.86% | -7.03% |
| MASS | 908 Devices | | Health Care | 5.64 | 17 | 0.89% | -7.08% |
| AMBA | Ambarella | | Technology | 42.91 | 0 | -1.72% | -7.10% |
| RPD | Rapid7 | | Technology | 44.50 | 10 | 1.60% | -7.10% |
| FARO | FARO | | Technology | 18.56 | 15 | 0.87% | -7.11% |
| PRTA | Prothena | | Health Care | 20.65 | 10 | -1.67% | -7.15% |
| DZSI | DASAN Zhone | | Technology | 1.16 | 10 | 0.00% | -7.20% |
| DNUT | Krispy Kreme | | Consumer Staples | 13.73 | 26 | -0.25% | -7.20% |
| NVRO | Nevro | | Health Care | 12.28 | 10 | -0.12% | -7.22% |
| NVAX | Novavax | | Health Care | 3.97 | 33 | 2.06% | -7.24% |
| ARLO | Arlo | | Technology | 10.49 | 36 | -0.38% | -7.25% |
| ARDX | Ardelyx | | Health Care | 6.54 | 0 | -0.08% | -7.29% |
| SAVA | Cassava Sciences | | Health Care | 21.09 | 50 | -0.85% | -7.30% |
| ANAB | AnaptysBio | | Health Care | 21.05 | 12 | -1.96% | -7.31% |
| BTMD | biote | | Health Care | 5.58 | 53 | 1.45% | -7.31% |
| BLFS | BioLife Solutions | | Health Care | 15.29 | 15 | 0.99% | -7.33% |
| PARR | Par Pacific | | Energy | 31.99 | 10 | -0.65% | -7.36% |
| EWCZ | European Wax | | Consumer Staples | 11.11 | 17 | 2.26% | -7.38% |
| INZY | Inozyme Pharma | | Health Care | 4.76 | 25 | 2.37% | -7.39% |
| For chart view version of above stock list: Chart View ➞ 0 - 25 , 25 - 50 , 50 - 75 , 75 - 100 , 100 - 125 , 125 - 150 , 150 - 175 , 175 - 200 , 200 - 225 , 225 - 250 , 250 - 275 , 275 - 300 , 300 - 325 , 325 - 350 , 350 - 375 , 375 - 400 , 400 - 425 , 425 - 450 , 450 - 475 , 475 - 500 , 500 - 525 , 525 - 550 , 550 - 575 , 575 - 600 , 600 - 625 , 625 - 650 , 650 - 675 , 675 - 700 , 700 - 725 , 725 - 750 , 750 - 775 , 775 - 800 , 800 - 825 , 825 - 850 , 850 - 875 , 875 - 900 , 900 - 925 , 925 - 950 , 950 - 975 , 975 - 1000 , 1000 - 1025 , 1025 - 1050 , 1050 - 1075 , 1075 - 1100 , 1100 - 1125 , 1125 - 1150 , 1150 - 1175 , 1175 - 1200 , 1200 - 1225 , 1225 - 1250 , 1250 - 1275 , 1275 - 1300 , 1300 - 1325 , 1325 - 1350 , 1350 - 1375 , 1375 - 1400 , 1400 - 1425 , 1425 - 1450 , 1450 - 1475 , 1475 - 1500 | ||
 | Click To Change The Sort Order: By Market Cap or Company Size Performance: Year-to-date, Week and Day |  |
| Too many stocks? View smallcap stocks filtered by marketcap & sector |
| Marketcap: All SmallCap Stocks (default-no microcap), Large, Mid-Range, Small |
| Smallcap Sector: Tech, Finance, Energy, Staples, Retail, Industrial, Materials, & Medical |
|
Get the most comprehensive stock market coverage daily at 12Stocks.com ➞ Best Stocks Today ➞ Best Stocks Weekly ➞ Best Stocks Year-to-Date ➞ Best Stocks Trends ➞  Best Stocks Today 12Stocks.com Best Nasdaq Stocks ➞ Best S&P 500 Stocks ➞ Best Tech Stocks ➞ Best Biotech Stocks ➞ |
| Detailed Overview of SmallCap Stocks |
| SmallCap Technical Overview, Leaders & Laggards, Top SmallCap ETF Funds & Detailed SmallCap Stocks List, Charts, Trends & More |
| Smallcap: Technical Analysis, Trends & YTD Performance | |
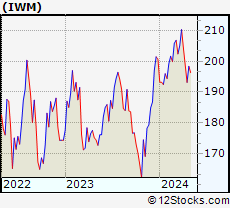
| SmallCap segment as represented by
IWM, an exchange-traded fund [ETF], holds basket of thousands of smallcap stocks from across all major sectors of the US stock market. The smallcap index (contains stocks like Riverbed & Sotheby's) is down by -2.78% and is currently underperforming the overall market by -7.83% year-to-date. Below is a quick view of technical charts and trends: | |
 IWM Weekly Chart |
|
| Long Term Trend: Good | |
| Medium Term Trend: Not Good | |
 IWM Daily Chart |
|
| Short Term Trend: Deteriorating | |
| Overall Trend Score: 44 | |
| YTD Performance: -2.78% | |
| **Trend Scores & Views Are Only For Educational Purposes And Not For Investing | |
| 12Stocks.com: Top Performing Small Cap Index Stocks | ||||||||||||||||||||||||||||||||||||||||||||||||
 The top performing Small Cap Index stocks year to date are
Now, more recently, over last week, the top performing Small Cap Index stocks on the move are


|
||||||||||||||||||||||||||||||||||||||||||||||||
| 12Stocks.com: Investing in Smallcap Index using Exchange Traded Funds | |
|
The following table shows list of key exchange traded funds (ETF) that
help investors track Smallcap index. The following list also includes leveraged ETF funds that track twice or thrice the daily returns of Smallcap indices. Short or inverse ETF funds move in the opposite direction to the index they track and are useful during market pullbacks or during bear markets. Quick View: Move mouse or cursor over ETF symbol (ticker) to view short-term technical chart and over ETF name to view long term chart. Click on ticker or stock name for detailed view. Click on to add stock symbol to your watchlist and to view watchlist. |
12Stocks.com List of ETFs that track Smallcap Index
| Ticker | ETF Name | Watchlist | Recent Price | Smart Investing & Trading Score | Change % | Week % | Year-to-date % |
| IWM | iShares Russell 2000 | | 195.14 | 44 | 1.11 | -1.79 | -2.78% |
| IJR | iShares Core S&P Small-Cap | | 103.30 | 38 | 1.15 | -1.16 | -4.57% |
| IWN | iShares Russell 2000 Value | | 146.73 | 10 | 0.48 | -2.43 | -5.54% |
| IWO | iShares Russell 2000 Growth | | 248.39 | 36 | 0.15 | -2.73 | -1.52% |
| IJS | iShares S&P Small-Cap 600 Value | | 94.21 | 10 | 0.10 | -2.04 | -8.6% |
| XSLV | PowerShares S&P SmallCap Low Volatil ETF | | 41.58 | 18 | 0.39 | -1.21 | -5.82% |
| 12Stocks.com: Charts, Trends, Fundamental Data and Performances of SmallCap Stocks | |
|
We now take in-depth look at all SmallCap stocks including charts, multi-period performances and overall trends (as measured by Smart Investing & Trading Score). One can sort SmallCap stocks (click link to choose) by Daily, Weekly and by Year-to-Date performances. Also, one can sort by size of the company or by market capitalization. |
| Select Your Default Chart Type: | |||||
| |||||
| Click on stock symbol or name for detailed view. Click on to add stock symbol to your watchlist and to view watchlist. Quick View: Move mouse or cursor over "Daily" to quickly view daily technical stock chart and over "Weekly" to view weekly technical stock chart. | |||||

 | SWIM Latham Group, Inc. |
| Sector: Industrials | |
| SubSector: Building Products & Equipment | |
| MarketCap: 388 Millions | |
| Recent Price: 3.21 Smart Investing & Trading Score: 53 | |
| Day Percent Change: 1.10% Day Change: 0.04 | |
| Week Change: -6.83% Year-to-date Change: 21.4% | |
| SWIM Links: Profile News Message Board | |
| Charts:- Daily , Weekly | |
| Add SWIM to Watchlist: View: Get Complete SWIM Trend Analysis ➞ | |
 | TARS Tarsus Pharmaceuticals, Inc. |
| Sector: Health Care | |
| SubSector: Biotechnology | |
| MarketCap: 74487 Millions | |
| Recent Price: 33.68 Smart Investing & Trading Score: 31 | |
| Day Percent Change: -2.21% Day Change: -0.76 | |
| Week Change: -6.88% Year-to-date Change: 66.1% | |
| TARS Links: Profile News Message Board | |
| Charts:- Daily , Weekly | |
| Add TARS to Watchlist: View: Get Complete TARS Trend Analysis ➞ | |
 | CRBU Caribou Biosciences, Inc. |
| Sector: Health Care | |
| SubSector: Biotechnology | |
| MarketCap: 258 Millions | |
| Recent Price: 3.91 Smart Investing & Trading Score: 10 | |
| Day Percent Change: -0.26% Day Change: -0.01 | |
| Week Change: -6.9% Year-to-date Change: -31.5% | |
| CRBU Links: Profile News Message Board | |
| Charts:- Daily , Weekly | |
| Add CRBU to Watchlist: View: Get Complete CRBU Trend Analysis ➞ | |
 | TRDA Entrada Therapeutics, Inc. |
| Sector: Health Care | |
| SubSector: Biotechnology | |
| MarketCap: 481 Millions | |
| Recent Price: 12.05 Smart Investing & Trading Score: 0 | |
| Day Percent Change: -1.39% Day Change: -0.17 | |
| Week Change: -6.95% Year-to-date Change: -26.6% | |
| TRDA Links: Profile News Message Board | |
| Charts:- Daily , Weekly | |
| Add TRDA to Watchlist: View: Get Complete TRDA Trend Analysis ➞ | |
 | VYGR Voyager Therapeutics, Inc. |
| Sector: Health Care | |
| SubSector: Biotechnology | |
| MarketCap: 321.085 Millions | |
| Recent Price: 7.84 Smart Investing & Trading Score: 36 | |
| Day Percent Change: 1.29% Day Change: 0.10 | |
| Week Change: -7% Year-to-date Change: -7.1% | |
| VYGR Links: Profile News Message Board | |
| Charts:- Daily , Weekly | |
| Add VYGR to Watchlist: View: Get Complete VYGR Trend Analysis ➞ | |
 | MCRI Monarch Casino & Resort, Inc. |
| Sector: Services & Goods | |
| SubSector: Resorts & Casinos | |
| MarketCap: 352.894 Millions | |
| Recent Price: 65.60 Smart Investing & Trading Score: 0 | |
| Day Percent Change: -5.71% Day Change: -3.97 | |
| Week Change: -7.03% Year-to-date Change: -5.1% | |
| MCRI Links: Profile News Message Board | |
| Charts:- Daily , Weekly | |
| Add MCRI to Watchlist: View: Get Complete MCRI Trend Analysis ➞ | |
 | IDYA IDEAYA Biosciences, Inc. |
| Sector: Health Care | |
| SubSector: Biotechnology | |
| MarketCap: 89.1785 Millions | |
| Recent Price: 39.02 Smart Investing & Trading Score: 0 | |
| Day Percent Change: -2.86% Day Change: -1.15 | |
| Week Change: -7.03% Year-to-date Change: 9.7% | |
| IDYA Links: Profile News Message Board | |
| Charts:- Daily , Weekly | |
| Add IDYA to Watchlist: View: Get Complete IDYA Trend Analysis ➞ | |
 | MASS 908 Devices Inc. |
| Sector: Health Care | |
| SubSector: Medical Devices | |
| MarketCap: 225 Millions | |
| Recent Price: 5.64 Smart Investing & Trading Score: 17 | |
| Day Percent Change: 0.89% Day Change: 0.05 | |
| Week Change: -7.08% Year-to-date Change: -49.6% | |
| MASS Links: Profile News Message Board | |
| Charts:- Daily , Weekly | |
| Add MASS to Watchlist: View: Get Complete MASS Trend Analysis ➞ | |
 | AMBA Ambarella, Inc. |
| Sector: Technology | |
| SubSector: Semiconductor Equipment & Materials | |
| MarketCap: 1509.38 Millions | |
| Recent Price: 42.91 Smart Investing & Trading Score: 0 | |
| Day Percent Change: -1.72% Day Change: -0.75 | |
| Week Change: -7.1% Year-to-date Change: -30.0% | |
| AMBA Links: Profile News Message Board | |
| Charts:- Daily , Weekly | |
| Add AMBA to Watchlist: View: Get Complete AMBA Trend Analysis ➞ | |
 | RPD Rapid7, Inc. |
| Sector: Technology | |
| SubSector: Application Software | |
| MarketCap: 1981.12 Millions | |
| Recent Price: 44.50 Smart Investing & Trading Score: 10 | |
| Day Percent Change: 1.60% Day Change: 0.70 | |
| Week Change: -7.1% Year-to-date Change: -22.1% | |
| RPD Links: Profile News Message Board | |
| Charts:- Daily , Weekly | |
| Add RPD to Watchlist: View: Get Complete RPD Trend Analysis ➞ | |
 | FARO FARO Technologies, Inc. |
| Sector: Technology | |
| SubSector: Scientific & Technical Instruments | |
| MarketCap: 721.953 Millions | |
| Recent Price: 18.56 Smart Investing & Trading Score: 15 | |
| Day Percent Change: 0.87% Day Change: 0.16 | |
| Week Change: -7.11% Year-to-date Change: -17.6% | |
| FARO Links: Profile News Message Board | |
| Charts:- Daily , Weekly | |
| Add FARO to Watchlist: View: Get Complete FARO Trend Analysis ➞ | |
 | PRTA Prothena Corporation plc |
| Sector: Health Care | |
| SubSector: Biotechnology | |
| MarketCap: 357.985 Millions | |
| Recent Price: 20.65 Smart Investing & Trading Score: 10 | |
| Day Percent Change: -1.67% Day Change: -0.35 | |
| Week Change: -7.15% Year-to-date Change: -43.2% | |
| PRTA Links: Profile News Message Board | |
| Charts:- Daily , Weekly | |
| Add PRTA to Watchlist: View: Get Complete PRTA Trend Analysis ➞ | |
 | DZSI DASAN Zhone Solutions, Inc. |
| Sector: Technology | |
| SubSector: Communication Equipment | |
| MarketCap: 90.0539 Millions | |
| Recent Price: 1.16 Smart Investing & Trading Score: 10 | |
| Day Percent Change: 0.00% Day Change: 0.00 | |
| Week Change: -7.2% Year-to-date Change: -41.1% | |
| DZSI Links: Profile News Message Board | |
| Charts:- Daily , Weekly | |
| Add DZSI to Watchlist: View: Get Complete DZSI Trend Analysis ➞ | |
 | DNUT Krispy Kreme, Inc. |
| Sector: Consumer Staples | |
| SubSector: Grocery Stores | |
| MarketCap: 2480 Millions | |
| Recent Price: 13.73 Smart Investing & Trading Score: 26 | |
| Day Percent Change: -0.25% Day Change: -0.04 | |
| Week Change: -7.2% Year-to-date Change: -9.6% | |
| DNUT Links: Profile News Message Board | |
| Charts:- Daily , Weekly | |
| Add DNUT to Watchlist: View: Get Complete DNUT Trend Analysis ➞ | |
 | NVRO Nevro Corp. |
| Sector: Health Care | |
| SubSector: Medical Appliances & Equipment | |
| MarketCap: 2489.3 Millions | |
| Recent Price: 12.28 Smart Investing & Trading Score: 10 | |
| Day Percent Change: -0.12% Day Change: -0.01 | |
| Week Change: -7.22% Year-to-date Change: -43.0% | |
| NVRO Links: Profile News Message Board | |
| Charts:- Daily , Weekly | |
| Add NVRO to Watchlist: View: Get Complete NVRO Trend Analysis ➞ | |
 | NVAX Novavax, Inc. |
| Sector: Health Care | |
| SubSector: Biotechnology | |
| MarketCap: 376.185 Millions | |
| Recent Price: 3.97 Smart Investing & Trading Score: 33 | |
| Day Percent Change: 2.06% Day Change: 0.08 | |
| Week Change: -7.24% Year-to-date Change: -17.3% | |
| NVAX Links: Profile News Message Board | |
| Charts:- Daily , Weekly | |
| Add NVAX to Watchlist: View: Get Complete NVAX Trend Analysis ➞ | |
 | ARLO Arlo Technologies, Inc. |
| Sector: Technology | |
| SubSector: Security Software & Services | |
| MarketCap: 163.317 Millions | |
| Recent Price: 10.49 Smart Investing & Trading Score: 36 | |
| Day Percent Change: -0.38% Day Change: -0.04 | |
| Week Change: -7.25% Year-to-date Change: 10.2% | |
| ARLO Links: Profile News Message Board | |
| Charts:- Daily , Weekly | |
| Add ARLO to Watchlist: View: Get Complete ARLO Trend Analysis ➞ | |
 | ARDX Ardelyx, Inc. |
| Sector: Health Care | |
| SubSector: Biotechnology | |
| MarketCap: 541.985 Millions | |
| Recent Price: 6.54 Smart Investing & Trading Score: 0 | |
| Day Percent Change: -0.08% Day Change: 0.00 | |
| Week Change: -7.29% Year-to-date Change: 5.6% | |
| ARDX Links: Profile News Message Board | |
| Charts:- Daily , Weekly | |
| Add ARDX to Watchlist: View: Get Complete ARDX Trend Analysis ➞ | |
 | SAVA Cassava Sciences, Inc. |
| Sector: Health Care | |
| SubSector: Biotechnology | |
| MarketCap: 86.6785 Millions | |
| Recent Price: 21.09 Smart Investing & Trading Score: 50 | |
| Day Percent Change: -0.85% Day Change: -0.18 | |
| Week Change: -7.3% Year-to-date Change: -6.3% | |
| SAVA Links: Profile News Message Board | |
| Charts:- Daily , Weekly | |
| Add SAVA to Watchlist: View: Get Complete SAVA Trend Analysis ➞ | |
 | ANAB AnaptysBio, Inc. |
| Sector: Health Care | |
| SubSector: Biotechnology | |
| MarketCap: 405.985 Millions | |
| Recent Price: 21.05 Smart Investing & Trading Score: 12 | |
| Day Percent Change: -1.96% Day Change: -0.42 | |
| Week Change: -7.31% Year-to-date Change: -1.7% | |
| ANAB Links: Profile News Message Board | |
| Charts:- Daily , Weekly | |
| Add ANAB to Watchlist: View: Get Complete ANAB Trend Analysis ➞ | |
 | BTMD biote Corp. |
| Sector: Health Care | |
| SubSector: Medical Care Facilities | |
| MarketCap: 468 Millions | |
| Recent Price: 5.58 Smart Investing & Trading Score: 53 | |
| Day Percent Change: 1.45% Day Change: 0.08 | |
| Week Change: -7.31% Year-to-date Change: 12.5% | |
| BTMD Links: Profile News Message Board | |
| Charts:- Daily , Weekly | |
| Add BTMD to Watchlist: View: Get Complete BTMD Trend Analysis ➞ | |
 | BLFS BioLife Solutions, Inc. |
| Sector: Health Care | |
| SubSector: Medical Instruments & Supplies | |
| MarketCap: 264.36 Millions | |
| Recent Price: 15.29 Smart Investing & Trading Score: 15 | |
| Day Percent Change: 0.99% Day Change: 0.15 | |
| Week Change: -7.33% Year-to-date Change: -5.9% | |
| BLFS Links: Profile News Message Board | |
| Charts:- Daily , Weekly | |
| Add BLFS to Watchlist: View: Get Complete BLFS Trend Analysis ➞ | |
 | PARR Par Pacific Holdings, Inc. |
| Sector: Energy | |
| SubSector: Oil & Gas Refining & Marketing | |
| MarketCap: 443.154 Millions | |
| Recent Price: 31.99 Smart Investing & Trading Score: 10 | |
| Day Percent Change: -0.65% Day Change: -0.21 | |
| Week Change: -7.36% Year-to-date Change: -12.0% | |
| PARR Links: Profile News Message Board | |
| Charts:- Daily , Weekly | |
| Add PARR to Watchlist: View: Get Complete PARR Trend Analysis ➞ | |
 | EWCZ European Wax Center, Inc. |
| Sector: Consumer Staples | |
| SubSector: Household & Personal Products | |
| MarketCap: 1180 Millions | |
| Recent Price: 11.11 Smart Investing & Trading Score: 17 | |
| Day Percent Change: 2.26% Day Change: 0.25 | |
| Week Change: -7.38% Year-to-date Change: -18.0% | |
| EWCZ Links: Profile News Message Board | |
| Charts:- Daily , Weekly | |
| Add EWCZ to Watchlist: View: Get Complete EWCZ Trend Analysis ➞ | |
 | INZY Inozyme Pharma, Inc. |
| Sector: Health Care | |
| SubSector: Biotechnology | |
| MarketCap: 53487 Millions | |
| Recent Price: 4.76 Smart Investing & Trading Score: 25 | |
| Day Percent Change: 2.37% Day Change: 0.11 | |
| Week Change: -7.39% Year-to-date Change: 11.9% | |
| INZY Links: Profile News Message Board | |
| Charts:- Daily , Weekly | |
| Add INZY to Watchlist: View: Get Complete INZY Trend Analysis ➞ | |
| For tabular summary view of above stock list: Summary View ➞ 0 - 25 , 25 - 50 , 50 - 75 , 75 - 100 , 100 - 125 , 125 - 150 , 150 - 175 , 175 - 200 , 200 - 225 , 225 - 250 , 250 - 275 , 275 - 300 , 300 - 325 , 325 - 350 , 350 - 375 , 375 - 400 , 400 - 425 , 425 - 450 , 450 - 475 , 475 - 500 , 500 - 525 , 525 - 550 , 550 - 575 , 575 - 600 , 600 - 625 , 625 - 650 , 650 - 675 , 675 - 700 , 700 - 725 , 725 - 750 , 750 - 775 , 775 - 800 , 800 - 825 , 825 - 850 , 850 - 875 , 875 - 900 , 900 - 925 , 925 - 950 , 950 - 975 , 975 - 1000 , 1000 - 1025 , 1025 - 1050 , 1050 - 1075 , 1075 - 1100 , 1100 - 1125 , 1125 - 1150 , 1150 - 1175 , 1175 - 1200 , 1200 - 1225 , 1225 - 1250 , 1250 - 1275 , 1275 - 1300 , 1300 - 1325 , 1325 - 1350 , 1350 - 1375 , 1375 - 1400 , 1400 - 1425 , 1425 - 1450 , 1450 - 1475 , 1475 - 1500 | ||
| Click To Change The Sort Order: By Market Cap or Company Size Performance: Year-to-date, Week and Day | |
| Select Chart Type: | ||
| Too many stocks? View smallcap stocks filtered by marketcap & sector |
| Marketcap: All SmallCap Stocks (default-no microcap), Large, Mid-Range, Small & MicroCap |
| Sector: Tech, Finance, Energy, Staples, Retail, Industrial, Materials, Utilities & Medical |
|
Best Stocks Today 12Stocks.com |
© 2024 12Stocks.com Terms & Conditions Privacy Contact Us
All Information Provided Only For Education And Not To Be Used For Investing or Trading. See Terms & Conditions


One More Thing ... Get Best Stocks Delivered Daily!
Never Ever Miss A Move With Our Top Ten Stocks Lists
Find Best Stocks In Any Market - Bull or Bear Market
Take A Peek At Our Top Ten Stocks Lists: Daily, Weekly, Year-to-Date & Top Trends
Find Best Stocks In Any Market - Bull or Bear Market
Take A Peek At Our Top Ten Stocks Lists: Daily, Weekly, Year-to-Date & Top Trends
Smallcap Stocks With Best Up Trends [0-bearish to 100-bullish]: Badger Meter[100], Apogee Enterprises[100], Cullinan Oncology[100], Oscar Health[100], Richardson Electronics[100], NextNav [100], Lantheus [100], Envestnet [100], Geron [100], Seneca Foods[100], IMAX [100]
Best Smallcap Stocks Year-to-Date:
Agenus [522.66%], CareMax [417.53%], Janux [348.12%], Viking [251.48%], Super Micro[239.3%], Alpine Immune[238.6%], Longboard [184.12%], Vera [161.3%], Avidity Biosciences[159.18%], Hippo [128.32%], Acrivon [118.61%] Best Smallcap Stocks This Week:
Macatawa Bank[45.05%], 23andMe Holding[33.3%], ProKidney [32%], Snap One[29.73%], Vertex Energy[25.96%], ALX Oncology[22.79%], Vanda [21.84%], Expensify [18.37%], E.W. Scripps[15%], Cullinan Oncology[13.89%], Humacyte [12.67%] Best Smallcap Stocks Daily:
23andMe Holding[65.91%], Vertex Energy[33.78%], Expensify [15.23%], Vuzix [13.73%], Badger Meter[12.03%], E.W. Scripps[11.68%], Zura Bio[10.99%], Vaxxinity [10.05%], Barnes Group[9.70%], eHealth [9.68%], Montrose Environmental[8.91%]