
 Login Sign Up


| |||||
 |  | ||||

| 12Stocks.com Market Intelligence |
Best SmallCap Stocks
|
| In a hurry? Small Cap Stock Lists: Performance Trends Table, Stock Charts
Sort Small Cap stocks: Daily, Weekly, Year-to-Date, Market Cap & Trends. Filter Small Cap stocks list by sector: Show all, Tech, Finance, Energy, Staples, Retail, Industrial, Materials, Utilities and HealthCare Filter Small Cap stocks list by size: All Large Medium Small and MicroCap |
| 12Stocks.com Small Cap Stocks Performances & Trends Daily | |||||||||
|
|  The overall Smart Investing & Trading Score is 63 (0-bearish to 100-bullish) which puts Small Cap index in short term neutral to bullish trend. The Smart Investing & Trading Score from previous trading session is 58 and hence an improvement of trend.
| ||||||||
Here are the Smart Investing & Trading Scores of the most requested small cap stocks at 12Stocks.com (click stock name for detailed review):
|


| 12Stocks.com: Investing in Smallcap Index with Stocks | |
|
The following table helps investors and traders sort through current performance and trends (as measured by Smart Investing & Trading Score) of various
stocks in the Smallcap Index. Quick View: Move mouse or cursor over stock symbol (ticker) to view short-term technical chart and over stock name to view long term chart. Click on  to add stock symbol to your watchlist and to add stock symbol to your watchlist and  to view watchlist. Click on any ticker or stock name for detailed market intelligence report for that stock. to view watchlist. Click on any ticker or stock name for detailed market intelligence report for that stock. |
12Stocks.com Performance of Stocks in Smallcap Index
| Ticker | Stock Name | Watchlist | Category | Recent Price | Smart Investing & Trading Score | Change % | Weekly Change% |
| EQBK | Equity Bancshares |   | Financials | 34.29 | 100 | 4.19% | 5.77% |
| APPN | Appian | | Technology | 36.58 | 53 | 4.16% | 5.75% |
| TLYS | Tilly s | | Services & Goods | 6.08 | 49 | 2.70% | 5.74% |
| CARG | CarGurus | | Services & Goods | 23.48 | 34 | 3.76% | 5.74% |
| ITRI | Itron | | Technology | 94.82 | 90 | 3.67% | 5.73% |
| PAYO | Payoneer Global | | Technology | 5.17 | 100 | 4.66% | 5.73% |
| AIR | AAR | | Industrials | 67.79 | 100 | 2.37% | 5.72% |
| SLG | SL Green | | Financials | 52.41 | 90 | 3.21% | 5.71% |
| MC | Moelis & | | Financials | 54.60 | 62 | 2.59% | 5.71% |
| PRK | Park National | | Financials | 135.31 | 100 | 1.06% | 5.70% |
| MXL | MaxLinear | | Technology | 20.77 | 47 | 4.79% | 5.70% |
| TRDA | Entrada | | Health Care | 12.84 | 42 | -1.98% | 5.68% |
| OCN | Ocwen Financial | | Financials | 24.77 | 49 | 1.31% | 5.63% |
| PNTG | Pennant Group | | Health Care | 21.44 | 68 | 2.83% | 5.62% |
| SASR | Sandy Spring | | Financials | 21.93 | 74 | 5.21% | 5.61% |
| FBNC | First Bancorp | | Financials | 34.12 | 67 | 2.71% | 5.60% |
| AVAV | AeroVironment | | Industrials | 158.42 | 95 | 5.81% | 5.60% |
| PEB | Pebblebrook Hotel | | Financials | 15.45 | 93 | 2.45% | 5.60% |
| SSP | E.W. Scripps | | Services & Goods | 3.79 | 74 | 1.88% | 5.57% |
| MAC | Macerich | | Financials | 16.14 | 95 | 2.87% | 5.56% |
| FCCO | First Community | | Financials | 16.89 | 67 | -0.71% | 5.56% |
| SANM | Sanmina | | Technology | 61.00 | 83 | 3.85% | 5.55% |
| PUBM | PubMatic | | Technology | 22.81 | 68 | 2.89% | 5.55% |
| EVCM | EverCommerce | | Technology | 9.32 | 64 | 2.42% | 5.55% |
| CMRE | Costamare | | Transports | 11.53 | 93 | 3.13% | 5.49% |


| Too many stocks? View smallcap stocks filtered by marketcap & sector |
| Marketcap: All SmallCap Stocks (default-no microcap), Large, Mid-Range, Small |
| Smallcap Sector: Tech, Finance, Energy, Staples, Retail, Industrial, Materials, & Medical |
|
Get the most comprehensive stock market coverage daily at 12Stocks.com ➞ Best Stocks Today ➞ Best Stocks Weekly ➞ Best Stocks Year-to-Date ➞ Best Stocks Trends ➞  Best Stocks Today 12Stocks.com Best Nasdaq Stocks ➞ Best S&P 500 Stocks ➞ Best Tech Stocks ➞ Best Biotech Stocks ➞ |
| Detailed Overview of SmallCap Stocks |
| SmallCap Technical Overview, Leaders & Laggards, Top SmallCap ETF Funds & Detailed SmallCap Stocks List, Charts, Trends & More |
| Smallcap: Technical Analysis, Trends & YTD Performance | |
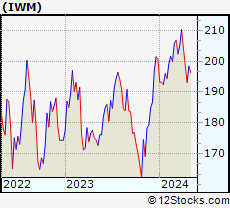
| SmallCap segment as represented by
IWM, an exchange-traded fund [ETF], holds basket of thousands of smallcap stocks from across all major sectors of the US stock market. The smallcap index (contains stocks like Riverbed & Sotheby's) is down by -1.07% and is currently underperforming the overall market by -6.71% year-to-date. Below is a quick view of technical charts and trends: | |
 IWM Weekly Chart |
|
| Long Term Trend: Good | |
| Medium Term Trend: Not Good | |
 IWM Daily Chart |
|
| Short Term Trend: Very Good | |
| Overall Trend Score: 63 | |
| YTD Performance: -1.07% | |
| **Trend Scores & Views Are Only For Educational Purposes And Not For Investing | |
| 12Stocks.com: Top Performing Small Cap Index Stocks | ||||||||||||||||||||||||||||||||||||||||||||||||
 The top performing Small Cap Index stocks year to date are
Now, more recently, over last week, the top performing Small Cap Index stocks on the move are


|
||||||||||||||||||||||||||||||||||||||||||||||||
| 12Stocks.com: Investing in Smallcap Index using Exchange Traded Funds | |
|
The following table shows list of key exchange traded funds (ETF) that
help investors track Smallcap index. The following list also includes leveraged ETF funds that track twice or thrice the daily returns of Smallcap indices. Short or inverse ETF funds move in the opposite direction to the index they track and are useful during market pullbacks or during bear markets. Quick View: Move mouse or cursor over ETF symbol (ticker) to view short-term technical chart and over ETF name to view long term chart. Click on ticker or stock name for detailed view. Click on to add stock symbol to your watchlist and to view watchlist. |
12Stocks.com List of ETFs that track Smallcap Index
| Ticker | ETF Name | Watchlist | Recent Price | Smart Investing & Trading Score | Change % | Week % | Year-to-date % |
| IWM | iShares Russell 2000 | | 198.57 | 63 | 1.67 | 2.81 | -1.07% |
| VTWO | Vanguard Russell 2000 ETF | | 80.53 | 70 | 2.04 | 3.14 | -0.7% |
| IJR | iShares Core S&P Small-Cap | | 105.44 | 75 | 1.91 | 2.16 | -2.59% |
| IJS | iShares S&P Small-Cap 600 Value | | 98.50 | 67 | 2.15 | 3.02 | -4.43% |
| IWN | iShares Russell 2000 Value | | 151.50 | 68 | 1.33 | 2.52 | -2.47% |
| IJT | iShares S&P Small-Cap 600 Growth | | 125.91 | 70 | 2.07 | 3.03 | 0.62% |
| IWO | iShares Russell 2000 Growth | | 252.16 | 58 | 1.71 | 2.8 | -0.02% |
| XSLV | PowerShares S&P SmallCap Low Volatil ETF | | 43.09 | 80 | 1.53 | 2.16 | -2.4% |
| SMLV | SPDR SSGA US Small Cap Low Volatil ETF | | 108.46 | 72 | 0.91 | 2.23 | -3.61% |
| SAA | ProShares Ultra SmallCap600 | | 23.15 | 24 | 3.49 | 6.19 | -7.21% |
| SBB | ProShares Short SmallCap600 | | 16.28 | 40 | -2.05 | -3.33 | 2.2% |
| SDD | ProShares UltraShort SmallCap600 | | 19.31 | 40 | -2.23 | -5.06 | 4.79% |
| 12Stocks.com: Charts, Trends, Fundamental Data and Performances of SmallCap Stocks | |
|
We now take in-depth look at all SmallCap stocks including charts, multi-period performances and overall trends (as measured by Smart Investing & Trading Score). One can sort SmallCap stocks (click link to choose) by Daily, Weekly and by Year-to-Date performances. Also, one can sort by size of the company or by market capitalization. |
| Select Your Default Chart Type: | |||||
| |||||
| Click on stock symbol or name for detailed view. Click on to add stock symbol to your watchlist and to view watchlist. Quick View: Move mouse or cursor over "Daily" to quickly view daily technical stock chart and over "Weekly" to view weekly technical stock chart. | |||||

 | EQBK Equity Bancshares, Inc. |
| Sector: Financials | |
| SubSector: Regional - Midwest Banks | |
| MarketCap: 272.87 Millions | |
| Recent Price: 34.29 Smart Investing & Trading Score: 100 | |
| Day Percent Change: 4.19% Day Change: 1.38 | |
| Week Change: 5.77% Year-to-date Change: 1.2% | |
| EQBK Links: Profile News Message Board | |
| Charts:- Daily , Weekly | |
| Add EQBK to Watchlist: View: Get Complete EQBK Trend Analysis ➞ | |
 | APPN Appian Corporation |
| Sector: Technology | |
| SubSector: Application Software | |
| MarketCap: 2737.92 Millions | |
| Recent Price: 36.58 Smart Investing & Trading Score: 53 | |
| Day Percent Change: 4.16% Day Change: 1.46 | |
| Week Change: 5.75% Year-to-date Change: -2.9% | |
| APPN Links: Profile News Message Board | |
| Charts:- Daily , Weekly | |
| Add APPN to Watchlist: View: Get Complete APPN Trend Analysis ➞ | |
 | TLYS Tilly s, Inc. |
| Sector: Services & Goods | |
| SubSector: Apparel Stores | |
| MarketCap: 127.408 Millions | |
| Recent Price: 6.08 Smart Investing & Trading Score: 49 | |
| Day Percent Change: 2.70% Day Change: 0.16 | |
| Week Change: 5.74% Year-to-date Change: -19.4% | |
| TLYS Links: Profile News Message Board | |
| Charts:- Daily , Weekly | |
| Add TLYS to Watchlist: View: Get Complete TLYS Trend Analysis ➞ | |
 | CARG CarGurus, Inc. |
| Sector: Services & Goods | |
| SubSector: Auto Dealerships | |
| MarketCap: 2099.31 Millions | |
| Recent Price: 23.48 Smart Investing & Trading Score: 34 | |
| Day Percent Change: 3.76% Day Change: 0.85 | |
| Week Change: 5.74% Year-to-date Change: -2.8% | |
| CARG Links: Profile News Message Board | |
| Charts:- Daily , Weekly | |
| Add CARG to Watchlist: View: Get Complete CARG Trend Analysis ➞ | |
 | ITRI Itron, Inc. |
| Sector: Technology | |
| SubSector: Scientific & Technical Instruments | |
| MarketCap: 2222.23 Millions | |
| Recent Price: 94.82 Smart Investing & Trading Score: 90 | |
| Day Percent Change: 3.67% Day Change: 3.36 | |
| Week Change: 5.73% Year-to-date Change: 25.6% | |
| ITRI Links: Profile News Message Board | |
| Charts:- Daily , Weekly | |
| Add ITRI to Watchlist: View: Get Complete ITRI Trend Analysis ➞ | |
 | PAYO Payoneer Global Inc. |
| Sector: Technology | |
| SubSector: Software - Infrastructure | |
| MarketCap: 1710 Millions | |
| Recent Price: 5.17 Smart Investing & Trading Score: 100 | |
| Day Percent Change: 4.66% Day Change: 0.23 | |
| Week Change: 5.73% Year-to-date Change: -2.3% | |
| PAYO Links: Profile News Message Board | |
| Charts:- Daily , Weekly | |
| Add PAYO to Watchlist: View: Get Complete PAYO Trend Analysis ➞ | |
 | AIR AAR Corp. |
| Sector: Industrials | |
| SubSector: Aerospace/Defense Products & Services | |
| MarketCap: 591.701 Millions | |
| Recent Price: 67.79 Smart Investing & Trading Score: 100 | |
| Day Percent Change: 2.37% Day Change: 1.57 | |
| Week Change: 5.72% Year-to-date Change: 8.6% | |
| AIR Links: Profile News Message Board | |
| Charts:- Daily , Weekly | |
| Add AIR to Watchlist: View: Get Complete AIR Trend Analysis ➞ | |
 | SLG SL Green Realty Corp. |
| Sector: Financials | |
| SubSector: REIT - Retail | |
| MarketCap: 4048.14 Millions | |
| Recent Price: 52.41 Smart Investing & Trading Score: 90 | |
| Day Percent Change: 3.21% Day Change: 1.63 | |
| Week Change: 5.71% Year-to-date Change: 16.0% | |
| SLG Links: Profile News Message Board | |
| Charts:- Daily , Weekly | |
| Add SLG to Watchlist: View: Get Complete SLG Trend Analysis ➞ | |
 | MC Moelis & Company |
| Sector: Financials | |
| SubSector: Asset Management | |
| MarketCap: 1675.93 Millions | |
| Recent Price: 54.60 Smart Investing & Trading Score: 62 | |
| Day Percent Change: 2.59% Day Change: 1.38 | |
| Week Change: 5.71% Year-to-date Change: -2.7% | |
| MC Links: Profile News Message Board | |
| Charts:- Daily , Weekly | |
| Add MC to Watchlist: View: Get Complete MC Trend Analysis ➞ | |
 | PRK Park National Corporation |
| Sector: Financials | |
| SubSector: Regional - Midwest Banks | |
| MarketCap: 1416.6 Millions | |
| Recent Price: 135.31 Smart Investing & Trading Score: 100 | |
| Day Percent Change: 1.06% Day Change: 1.42 | |
| Week Change: 5.7% Year-to-date Change: 1.8% | |
| PRK Links: Profile News Message Board | |
| Charts:- Daily , Weekly | |
| Add PRK to Watchlist: View: Get Complete PRK Trend Analysis ➞ | |
 | MXL MaxLinear, Inc. |
| Sector: Technology | |
| SubSector: Semiconductor - Integrated Circuits | |
| MarketCap: 751.31 Millions | |
| Recent Price: 20.77 Smart Investing & Trading Score: 47 | |
| Day Percent Change: 4.79% Day Change: 0.95 | |
| Week Change: 5.7% Year-to-date Change: -12.6% | |
| MXL Links: Profile News Message Board | |
| Charts:- Daily , Weekly | |
| Add MXL to Watchlist: View: Get Complete MXL Trend Analysis ➞ | |
 | TRDA Entrada Therapeutics, Inc. |
| Sector: Health Care | |
| SubSector: Biotechnology | |
| MarketCap: 481 Millions | |
| Recent Price: 12.84 Smart Investing & Trading Score: 42 | |
| Day Percent Change: -1.98% Day Change: -0.26 | |
| Week Change: 5.68% Year-to-date Change: -21.8% | |
| TRDA Links: Profile News Message Board | |
| Charts:- Daily , Weekly | |
| Add TRDA to Watchlist: View: Get Complete TRDA Trend Analysis ➞ | |
 | OCN Ocwen Financial Corporation |
| Sector: Financials | |
| SubSector: Mortgage Investment | |
| MarketCap: 73.7739 Millions | |
| Recent Price: 24.77 Smart Investing & Trading Score: 49 | |
| Day Percent Change: 1.31% Day Change: 0.32 | |
| Week Change: 5.63% Year-to-date Change: -19.5% | |
| OCN Links: Profile News Message Board | |
| Charts:- Daily , Weekly | |
| Add OCN to Watchlist: View: Get Complete OCN Trend Analysis ➞ | |
 | PNTG The Pennant Group, Inc. |
| Sector: Health Care | |
| SubSector: Long-Term Care Facilities | |
| MarketCap: 451.786 Millions | |
| Recent Price: 21.44 Smart Investing & Trading Score: 68 | |
| Day Percent Change: 2.83% Day Change: 0.59 | |
| Week Change: 5.62% Year-to-date Change: 54.0% | |
| PNTG Links: Profile News Message Board | |
| Charts:- Daily , Weekly | |
| Add PNTG to Watchlist: View: Get Complete PNTG Trend Analysis ➞ | |
 | SASR Sandy Spring Bancorp, Inc. |
| Sector: Financials | |
| SubSector: Regional - Mid-Atlantic Banks | |
| MarketCap: 764.659 Millions | |
| Recent Price: 21.93 Smart Investing & Trading Score: 74 | |
| Day Percent Change: 5.21% Day Change: 1.09 | |
| Week Change: 5.61% Year-to-date Change: -19.5% | |
| SASR Links: Profile News Message Board | |
| Charts:- Daily , Weekly | |
| Add SASR to Watchlist: View: Get Complete SASR Trend Analysis ➞ | |
 | FBNC First Bancorp |
| Sector: Financials | |
| SubSector: Regional - Mid-Atlantic Banks | |
| MarketCap: 664.959 Millions | |
| Recent Price: 34.12 Smart Investing & Trading Score: 67 | |
| Day Percent Change: 2.71% Day Change: 0.90 | |
| Week Change: 5.6% Year-to-date Change: -7.8% | |
| FBNC Links: Profile News Message Board | |
| Charts:- Daily , Weekly | |
| Add FBNC to Watchlist: View: Get Complete FBNC Trend Analysis ➞ | |
 | AVAV AeroVironment, Inc. |
| Sector: Industrials | |
| SubSector: Aerospace/Defense Products & Services | |
| MarketCap: 1502.41 Millions | |
| Recent Price: 158.42 Smart Investing & Trading Score: 95 | |
| Day Percent Change: 5.81% Day Change: 8.70 | |
| Week Change: 5.6% Year-to-date Change: 25.7% | |
| AVAV Links: Profile News Message Board | |
| Charts:- Daily , Weekly | |
| Add AVAV to Watchlist: View: Get Complete AVAV Trend Analysis ➞ | |
 | PEB Pebblebrook Hotel Trust |
| Sector: Financials | |
| SubSector: REIT - Hotel/Motel | |
| MarketCap: 1472.84 Millions | |
| Recent Price: 15.45 Smart Investing & Trading Score: 93 | |
| Day Percent Change: 2.45% Day Change: 0.37 | |
| Week Change: 5.6% Year-to-date Change: -3.3% | |
| PEB Links: Profile News Message Board | |
| Charts:- Daily , Weekly | |
| Add PEB to Watchlist: View: Get Complete PEB Trend Analysis ➞ | |
 | SSP The E.W. Scripps Company |
| Sector: Services & Goods | |
| SubSector: Broadcasting - TV | |
| MarketCap: 766.163 Millions | |
| Recent Price: 3.79 Smart Investing & Trading Score: 74 | |
| Day Percent Change: 1.88% Day Change: 0.07 | |
| Week Change: 5.57% Year-to-date Change: -52.6% | |
| SSP Links: Profile News Message Board | |
| Charts:- Daily , Weekly | |
| Add SSP to Watchlist: View: Get Complete SSP Trend Analysis ➞ | |
 | MAC The Macerich Company |
| Sector: Financials | |
| SubSector: REIT - Retail | |
| MarketCap: 1172.54 Millions | |
| Recent Price: 16.14 Smart Investing & Trading Score: 95 | |
| Day Percent Change: 2.87% Day Change: 0.45 | |
| Week Change: 5.56% Year-to-date Change: 4.6% | |
| MAC Links: Profile News Message Board | |
| Charts:- Daily , Weekly | |
| Add MAC to Watchlist: View: Get Complete MAC Trend Analysis ➞ | |
 | FCCO First Community Corporation |
| Sector: Financials | |
| SubSector: Regional - Southwest Banks | |
| MarketCap: 123.865 Millions | |
| Recent Price: 16.89 Smart Investing & Trading Score: 67 | |
| Day Percent Change: -0.71% Day Change: -0.12 | |
| Week Change: 5.56% Year-to-date Change: -21.6% | |
| FCCO Links: Profile News Message Board | |
| Charts:- Daily , Weekly | |
| Add FCCO to Watchlist: View: Get Complete FCCO Trend Analysis ➞ | |
 | SANM Sanmina Corporation |
| Sector: Technology | |
| SubSector: Diversified Electronics | |
| MarketCap: 1790.36 Millions | |
| Recent Price: 61.00 Smart Investing & Trading Score: 83 | |
| Day Percent Change: 3.85% Day Change: 2.26 | |
| Week Change: 5.55% Year-to-date Change: 18.8% | |
| SANM Links: Profile News Message Board | |
| Charts:- Daily , Weekly | |
| Add SANM to Watchlist: View: Get Complete SANM Trend Analysis ➞ | |
 | PUBM PubMatic, Inc. |
| Sector: Technology | |
| SubSector: Software Application | |
| MarketCap: 56787 Millions | |
| Recent Price: 22.81 Smart Investing & Trading Score: 68 | |
| Day Percent Change: 2.89% Day Change: 0.64 | |
| Week Change: 5.55% Year-to-date Change: 39.9% | |
| PUBM Links: Profile News Message Board | |
| Charts:- Daily , Weekly | |
| Add PUBM to Watchlist: View: Get Complete PUBM Trend Analysis ➞ | |
 | EVCM EverCommerce Inc. |
| Sector: Technology | |
| SubSector: Software - Infrastructure | |
| MarketCap: 2210 Millions | |
| Recent Price: 9.32 Smart Investing & Trading Score: 64 | |
| Day Percent Change: 2.42% Day Change: 0.22 | |
| Week Change: 5.55% Year-to-date Change: -16.2% | |
| EVCM Links: Profile News Message Board | |
| Charts:- Daily , Weekly | |
| Add EVCM to Watchlist: View: Get Complete EVCM Trend Analysis ➞ | |
 | CMRE Costamare Inc. |
| Sector: Transports | |
| SubSector: Shipping | |
| MarketCap: 492.214 Millions | |
| Recent Price: 11.53 Smart Investing & Trading Score: 93 | |
| Day Percent Change: 3.13% Day Change: 0.35 | |
| Week Change: 5.49% Year-to-date Change: 10.8% | |
| CMRE Links: Profile News Message Board | |
| Charts:- Daily , Weekly | |
| Add CMRE to Watchlist: View: Get Complete CMRE Trend Analysis ➞ | |
| Too many stocks? View smallcap stocks filtered by marketcap & sector |
| Marketcap: All SmallCap Stocks (default-no microcap), Large, Mid-Range, Small & MicroCap |
| Sector: Tech, Finance, Energy, Staples, Retail, Industrial, Materials, Utilities & Medical |
|
Best Stocks Today 12Stocks.com |
© 2024 12Stocks.com Terms & Conditions Privacy Contact Us
All Information Provided Only For Education And Not To Be Used For Investing or Trading. See Terms & Conditions


One More Thing ... Get Best Stocks Delivered Daily!
Never Ever Miss A Move With Our Top Ten Stocks Lists
Find Best Stocks In Any Market - Bull or Bear Market
Take A Peek At Our Top Ten Stocks Lists: Daily, Weekly, Year-to-Date & Top Trends
Find Best Stocks In Any Market - Bull or Bear Market
Take A Peek At Our Top Ten Stocks Lists: Daily, Weekly, Year-to-Date & Top Trends
Smallcap Stocks With Best Up Trends [0-bearish to 100-bullish]: Hibbett Sports[100], AZZ [100], Day One[100], BioLife Solutions[100], Oscar Health[100], Mueller Industries[100], Gannett Co[100], Dillard s[100], Riot Blockchain[100], Agios [100], Brookdale Senior[100]
Best Smallcap Stocks Year-to-Date:
Janux [364.03%], Viking [258.89%], Alpine Immune[238.94%], Longboard [231.75%], Avidity Biosciences[177.88%], Arcutis Bio[170.43%], Super Micro[168.16%], Vera [154.91%], Hippo [134.14%], Y-mAbs [125.37%], Stoke [113.69%] Best Smallcap Stocks This Week:
Matterport [164.37%], Seres [36.26%], Riot Blockchain[29.74%], Cipher Mining[25%], ProKidney [24.75%], Braemar Hotels[21.3%], Akoustis [21.27%], Hibbett Sports[21.1%], Assertio [19.02%], Generation Bio[18.05%], BigBear.ai [17.93%] Best Smallcap Stocks Daily:
Virgin Galactic[22.38%], Seres [22.14%], Hibbett Sports[18.84%], Marathon Patent[18.12%], Generation Bio[16.37%], IGM Biosciences[14.52%], Braemar Hotels[12.96%], SES AI[12.17%], NuScale Power[11.16%], FuelCell Energy[10.86%], Cutera [10.82%]