
 Login Sign Up


| |||||
 |  | ||||

| 12Stocks.com Market Intelligence |
Best SmallCap Stocks
|
| In a hurry? Small Cap Stock Lists: Performance Trends Table, Stock Charts
Sort Small Cap stocks: Daily, Weekly, Year-to-Date, Market Cap & Trends. Filter Small Cap stocks list by sector: Show all, Tech, Finance, Energy, Staples, Retail, Industrial, Materials, Utilities and HealthCare Filter Small Cap stocks list by size: All Large Medium Small and MicroCap |
| 12Stocks.com Small Cap Stocks Performances & Trends Daily | |||||||||
|
|  The overall Smart Investing & Trading Score is 23 (0-bearish to 100-bullish) which puts Small Cap index in short term bearish to neutral trend. The Smart Investing & Trading Score from previous trading session is 13 and hence an improvement of trend.
| ||||||||
Here are the Smart Investing & Trading Scores of the most requested small cap stocks at 12Stocks.com (click stock name for detailed review):
|


| 12Stocks.com: Investing in Smallcap Index with Stocks | |
|
The following table helps investors and traders sort through current performance and trends (as measured by Smart Investing & Trading Score) of various
stocks in the Smallcap Index. Quick View: Move mouse or cursor over stock symbol (ticker) to view short-term technical chart and over stock name to view long term chart. Click on  to add stock symbol to your watchlist and to add stock symbol to your watchlist and  to view watchlist. Click on any ticker or stock name for detailed market intelligence report for that stock. to view watchlist. Click on any ticker or stock name for detailed market intelligence report for that stock. |
12Stocks.com Performance of Stocks in Smallcap Index
| Ticker | Stock Name | Watchlist | Category | Recent Price | Smart Investing & Trading Score | Change % | Weekly Change% |
| ALHC | Alignment Healthcare |   | Health Care | 5.11 | 64 | 3.34% | 8.72% |
| JRVR | James River | | Financials | 9.15 | 37 | 4.93% | 8.16% |
| APPS | Digital Turbine | | Technology | 2.02 | 37 | 8.60% | 8.02% |
| ESCA | Escalade | | Consumer Staples | 13.93 | 57 | -5.11% | 7.90% |
| JBLU | JetBlue Airways | | Transports | 7.28 | 68 | 6.52% | 7.78% |
| OM | Outset Medical | | Health Care | 2.21 | 47 | 2.08% | 7.56% |
| CENX | Century Aluminum | | Materials | 17.70 | 83 | 1.11% | 7.43% |
| CVGW | Calavo Growers | | Consumer Staples | 26.24 | 60 | 0.81% | 7.36% |
| SMCI | Super Micro | | Technology | 964.50 | 68 | 0.46% | 7.35% |
| DCGO | DocGo | | Health Care | 3.50 | 42 | 4.17% | 7.21% |
| NOTE | FiscalNote | | Technology | 1.33 | 27 | 8.61% | 6.85% |
| ULCC | Frontier Group | | Industrials | 7.17 | 68 | 3.99% | 6.62% |
| GOCO | GoHealth | | Financials | 10.15 | 27 | 2.42% | 6.51% |
| TBBK | Bancorp | | Financials | 33.49 | 49 | 1.98% | 6.39% |
| APOG | Apogee Enterprises | | Industrials | 60.59 | 40 | 8.36% | 6.33% |
| GDOT | Green Dot | | Financials | 8.51 | 42 | 3.59% | 6.31% |
| VGAS | Verde Clean | | Utilities | 4.94 | 90 | 2.49% | 6.01% |
| UHG | United Homes | | Services & Goods | 6.36 | 42 | 0.79% | 5.82% |
| SNCY | Sun Country | | Industrials | 15.09 | 78 | 3.57% | 5.82% |
| IMAX | IMAX | | Services & Goods | 17.39 | 100 | 1.85% | 5.81% |
| PRCT | PROCEPT BioRobotics | | Health Care | 53.61 | 83 | 3.51% | 5.72% |
| AIR | AAR | | Industrials | 64.23 | 83 | 3.81% | 5.66% |
| MWA | Mueller Water | | Industrials | 15.99 | 75 | 4.27% | 5.44% |
| NUS | Nu Skin | | Consumer Staples | 12.69 | 52 | 2.67% | 5.31% |
| GCBC | Greene County | | Financials | 27.95 | 68 | 2.53% | 5.19% |
| For chart view version of above stock list: Chart View ➞ 0 - 25 , 25 - 50 , 50 - 75 , 75 - 100 , 100 - 125 , 125 - 150 , 150 - 175 , 175 - 200 , 200 - 225 , 225 - 250 , 250 - 275 , 275 - 300 , 300 - 325 , 325 - 350 , 350 - 375 , 375 - 400 , 400 - 425 , 425 - 450 , 450 - 475 , 475 - 500 , 500 - 525 , 525 - 550 , 550 - 575 , 575 - 600 , 600 - 625 , 625 - 650 , 650 - 675 , 675 - 700 , 700 - 725 , 725 - 750 , 750 - 775 , 775 - 800 , 800 - 825 , 825 - 850 , 850 - 875 , 875 - 900 , 900 - 925 , 925 - 950 , 950 - 975 , 975 - 1000 , 1000 - 1025 , 1025 - 1050 , 1050 - 1075 , 1075 - 1100 , 1100 - 1125 , 1125 - 1150 , 1150 - 1175 , 1175 - 1200 , 1200 - 1225 , 1225 - 1250 , 1250 - 1275 , 1275 - 1300 , 1300 - 1325 , 1325 - 1350 , 1350 - 1375 , 1375 - 1400 , 1400 - 1425 , 1425 - 1450 , 1450 - 1475 , 1475 - 1500 | ||
 | Click To Change The Sort Order: By Market Cap or Company Size Performance: Year-to-date, Week and Day |  |
| Too many stocks? View smallcap stocks filtered by marketcap & sector |
| Marketcap: All SmallCap Stocks (default-no microcap), Large, Mid-Range, Small |
| Smallcap Sector: Tech, Finance, Energy, Staples, Retail, Industrial, Materials, & Medical |
|
Get the most comprehensive stock market coverage daily at 12Stocks.com ➞ Best Stocks Today ➞ Best Stocks Weekly ➞ Best Stocks Year-to-Date ➞ Best Stocks Trends ➞  Best Stocks Today 12Stocks.com Best Nasdaq Stocks ➞ Best S&P 500 Stocks ➞ Best Tech Stocks ➞ Best Biotech Stocks ➞ |
| Detailed Overview of SmallCap Stocks |
| SmallCap Technical Overview, Leaders & Laggards, Top SmallCap ETF Funds & Detailed SmallCap Stocks List, Charts, Trends & More |
| Smallcap: Technical Analysis, Trends & YTD Performance | |
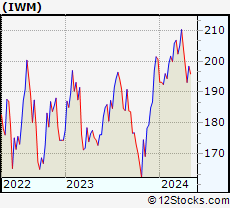
| SmallCap segment as represented by
IWM, an exchange-traded fund [ETF], holds basket of thousands of smallcap stocks from across all major sectors of the US stock market. The smallcap index (contains stocks like Riverbed & Sotheby's) is down by -2.78% and is currently underperforming the overall market by -7.83% year-to-date. Below is a quick view of technical charts and trends: | |
 IWM Weekly Chart |
|
| Long Term Trend: Good | |
| Medium Term Trend: Not Good | |
 IWM Daily Chart |
|
| Short Term Trend: Deteriorating | |
| Overall Trend Score: 23 | |
| YTD Performance: -2.78% | |
| **Trend Scores & Views Are Only For Educational Purposes And Not For Investing | |
| 12Stocks.com: Top Performing Small Cap Index Stocks | ||||||||||||||||||||||||||||||||||||||||||||||||
 The top performing Small Cap Index stocks year to date are
Now, more recently, over last week, the top performing Small Cap Index stocks on the move are


|
||||||||||||||||||||||||||||||||||||||||||||||||
| 12Stocks.com: Investing in Smallcap Index using Exchange Traded Funds | |
|
The following table shows list of key exchange traded funds (ETF) that
help investors track Smallcap index. The following list also includes leveraged ETF funds that track twice or thrice the daily returns of Smallcap indices. Short or inverse ETF funds move in the opposite direction to the index they track and are useful during market pullbacks or during bear markets. Quick View: Move mouse or cursor over ETF symbol (ticker) to view short-term technical chart and over ETF name to view long term chart. Click on ticker or stock name for detailed view. Click on to add stock symbol to your watchlist and to view watchlist. |
12Stocks.com List of ETFs that track Smallcap Index
| Ticker | ETF Name | Watchlist | Recent Price | Smart Investing & Trading Score | Change % | Week % | Year-to-date % |
| IWM | iShares Russell 2000 | | 195.14 | 23 | 1.11 | -1.79 | -2.78% |
| IJR | iShares Core S&P Small-Cap | | 103.30 | 7 | 1.15 | -1.16 | -4.57% |
| IWN | iShares Russell 2000 Value | | 146.73 | 0 | 0.48 | -2.43 | -5.54% |
| IWO | iShares Russell 2000 Growth | | 248.39 | 26 | 0.15 | -2.73 | -1.52% |
| IJS | iShares S&P Small-Cap 600 Value | | 94.21 | 0 | 0.10 | -2.04 | -8.6% |
| XSLV | PowerShares S&P SmallCap Low Volatil ETF | | 41.58 | 0 | 0.39 | -1.21 | -5.82% |
| 12Stocks.com: Charts, Trends, Fundamental Data and Performances of SmallCap Stocks | |
|
We now take in-depth look at all SmallCap stocks including charts, multi-period performances and overall trends (as measured by Smart Investing & Trading Score). One can sort SmallCap stocks (click link to choose) by Daily, Weekly and by Year-to-Date performances. Also, one can sort by size of the company or by market capitalization. |
| Select Your Default Chart Type: | |||||
| |||||
| Click on stock symbol or name for detailed view. Click on to add stock symbol to your watchlist and to view watchlist. Quick View: Move mouse or cursor over "Daily" to quickly view daily technical stock chart and over "Weekly" to view weekly technical stock chart. | |||||

 | ALHC Alignment Healthcare, Inc. |
| Sector: Health Care | |
| SubSector: Healthcare Plans | |
| MarketCap: 1100 Millions | |
| Recent Price: 5.11 Smart Investing & Trading Score: 64 | |
| Day Percent Change: 3.34% Day Change: 0.17 | |
| Week Change: 8.72% Year-to-date Change: -42.3% | |
| ALHC Links: Profile News Message Board | |
| Charts:- Daily , Weekly | |
| Add ALHC to Watchlist: View: Get Complete ALHC Trend Analysis ➞ | |
 | JRVR James River Group Holdings, Ltd. |
| Sector: Financials | |
| SubSector: Property & Casualty Insurance | |
| MarketCap: 978.312 Millions | |
| Recent Price: 9.15 Smart Investing & Trading Score: 37 | |
| Day Percent Change: 4.93% Day Change: 0.43 | |
| Week Change: 8.16% Year-to-date Change: -1.0% | |
| JRVR Links: Profile News Message Board | |
| Charts:- Daily , Weekly | |
| Add JRVR to Watchlist: View: Get Complete JRVR Trend Analysis ➞ | |
 | APPS Digital Turbine, Inc. |
| Sector: Technology | |
| SubSector: Application Software | |
| MarketCap: 437.262 Millions | |
| Recent Price: 2.02 Smart Investing & Trading Score: 37 | |
| Day Percent Change: 8.60% Day Change: 0.16 | |
| Week Change: 8.02% Year-to-date Change: -70.6% | |
| APPS Links: Profile News Message Board | |
| Charts:- Daily , Weekly | |
| Add APPS to Watchlist: View: Get Complete APPS Trend Analysis ➞ | |
 | ESCA Escalade, Incorporated |
| Sector: Consumer Staples | |
| SubSector: Sporting Goods | |
| MarketCap: 87.8144 Millions | |
| Recent Price: 13.93 Smart Investing & Trading Score: 57 | |
| Day Percent Change: -5.11% Day Change: -0.75 | |
| Week Change: 7.9% Year-to-date Change: -30.7% | |
| ESCA Links: Profile News Message Board | |
| Charts:- Daily , Weekly | |
| Add ESCA to Watchlist: View: Get Complete ESCA Trend Analysis ➞ | |
 | JBLU JetBlue Airways Corporation |
| Sector: Transports | |
| SubSector: Regional Airlines | |
| MarketCap: 2383.1 Millions | |
| Recent Price: 7.28 Smart Investing & Trading Score: 68 | |
| Day Percent Change: 6.52% Day Change: 0.45 | |
| Week Change: 7.78% Year-to-date Change: 31.1% | |
| JBLU Links: Profile News Message Board | |
| Charts:- Daily , Weekly | |
| Add JBLU to Watchlist: View: Get Complete JBLU Trend Analysis ➞ | |
 | OM Outset Medical, Inc. |
| Sector: Health Care | |
| SubSector: Medical Devices | |
| MarketCap: 21787 Millions | |
| Recent Price: 2.21 Smart Investing & Trading Score: 47 | |
| Day Percent Change: 2.08% Day Change: 0.04 | |
| Week Change: 7.56% Year-to-date Change: -59.2% | |
| OM Links: Profile News Message Board | |
| Charts:- Daily , Weekly | |
| Add OM to Watchlist: View: Get Complete OM Trend Analysis ➞ | |
 | CENX Century Aluminum Company |
| Sector: Materials | |
| SubSector: Aluminum | |
| MarketCap: 266.408 Millions | |
| Recent Price: 17.70 Smart Investing & Trading Score: 83 | |
| Day Percent Change: 1.11% Day Change: 0.19 | |
| Week Change: 7.43% Year-to-date Change: 45.8% | |
| CENX Links: Profile News Message Board | |
| Charts:- Daily , Weekly | |
| Add CENX to Watchlist: View: Get Complete CENX Trend Analysis ➞ | |
 | CVGW Calavo Growers, Inc. |
| Sector: Consumer Staples | |
| SubSector: Farm Products | |
| MarketCap: 935.287 Millions | |
| Recent Price: 26.24 Smart Investing & Trading Score: 60 | |
| Day Percent Change: 0.81% Day Change: 0.21 | |
| Week Change: 7.36% Year-to-date Change: -10.8% | |
| CVGW Links: Profile News Message Board | |
| Charts:- Daily , Weekly | |
| Add CVGW to Watchlist: View: Get Complete CVGW Trend Analysis ➞ | |
 | SMCI Super Micro Computer, Inc. |
| Sector: Technology | |
| SubSector: Networking & Communication Devices | |
| MarketCap: 1200.02 Millions | |
| Recent Price: 964.50 Smart Investing & Trading Score: 68 | |
| Day Percent Change: 0.46% Day Change: 4.42 | |
| Week Change: 7.35% Year-to-date Change: 239.3% | |
| SMCI Links: Profile News Message Board | |
| Charts:- Daily , Weekly | |
| Add SMCI to Watchlist: View: Get Complete SMCI Trend Analysis ➞ | |
 | DCGO DocGo Inc. |
| Sector: Health Care | |
| SubSector: Medical Care Facilities | |
| MarketCap: 972 Millions | |
| Recent Price: 3.50 Smart Investing & Trading Score: 42 | |
| Day Percent Change: 4.17% Day Change: 0.14 | |
| Week Change: 7.21% Year-to-date Change: -37.5% | |
| DCGO Links: Profile News Message Board | |
| Charts:- Daily , Weekly | |
| Add DCGO to Watchlist: View: Get Complete DCGO Trend Analysis ➞ | |
 | NOTE FiscalNote Holdings, Inc. |
| Sector: Technology | |
| SubSector: Information Technology Services | |
| MarketCap: 493 Millions | |
| Recent Price: 1.33 Smart Investing & Trading Score: 27 | |
| Day Percent Change: 8.61% Day Change: 0.10 | |
| Week Change: 6.85% Year-to-date Change: 13.3% | |
| NOTE Links: Profile News Message Board | |
| Charts:- Daily , Weekly | |
| Add NOTE to Watchlist: View: Get Complete NOTE Trend Analysis ➞ | |
 | ULCC Frontier Group Holdings, Inc. |
| Sector: Industrials | |
| SubSector: Airlines | |
| MarketCap: 2160 Millions | |
| Recent Price: 7.17 Smart Investing & Trading Score: 68 | |
| Day Percent Change: 3.99% Day Change: 0.28 | |
| Week Change: 6.62% Year-to-date Change: 32.0% | |
| ULCC Links: Profile News Message Board | |
| Charts:- Daily , Weekly | |
| Add ULCC to Watchlist: View: Get Complete ULCC Trend Analysis ➞ | |
 | GOCO GoHealth, Inc. |
| Sector: Financials | |
| SubSector: Insurance Brokers | |
| MarketCap: 44157 Millions | |
| Recent Price: 10.15 Smart Investing & Trading Score: 27 | |
| Day Percent Change: 2.42% Day Change: 0.24 | |
| Week Change: 6.51% Year-to-date Change: -22.7% | |
| GOCO Links: Profile News Message Board | |
| Charts:- Daily , Weekly | |
| Add GOCO to Watchlist: View: Get Complete GOCO Trend Analysis ➞ | |
 | TBBK The Bancorp, Inc. |
| Sector: Financials | |
| SubSector: Regional - Mid-Atlantic Banks | |
| MarketCap: 267.859 Millions | |
| Recent Price: 33.49 Smart Investing & Trading Score: 49 | |
| Day Percent Change: 1.98% Day Change: 0.65 | |
| Week Change: 6.39% Year-to-date Change: -13.2% | |
| TBBK Links: Profile News Message Board | |
| Charts:- Daily , Weekly | |
| Add TBBK to Watchlist: View: Get Complete TBBK Trend Analysis ➞ | |
 | APOG Apogee Enterprises, Inc. |
| Sector: Industrials | |
| SubSector: General Building Materials | |
| MarketCap: 510.653 Millions | |
| Recent Price: 60.59 Smart Investing & Trading Score: 40 | |
| Day Percent Change: 8.36% Day Change: 4.67 | |
| Week Change: 6.33% Year-to-date Change: 13.5% | |
| APOG Links: Profile News Message Board | |
| Charts:- Daily , Weekly | |
| Add APOG to Watchlist: View: Get Complete APOG Trend Analysis ➞ | |
 | GDOT Green Dot Corporation |
| Sector: Financials | |
| SubSector: Credit Services | |
| MarketCap: 1320.08 Millions | |
| Recent Price: 8.51 Smart Investing & Trading Score: 42 | |
| Day Percent Change: 3.59% Day Change: 0.29 | |
| Week Change: 6.31% Year-to-date Change: -14.1% | |
| GDOT Links: Profile News Message Board | |
| Charts:- Daily , Weekly | |
| Add GDOT to Watchlist: View: Get Complete GDOT Trend Analysis ➞ | |
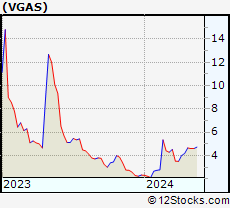 | VGAS Verde Clean Fuels, Inc. |
| Sector: Utilities | |
| SubSector: Utilities - Renewable | |
| MarketCap: 204 Millions | |
| Recent Price: 4.94 Smart Investing & Trading Score: 90 | |
| Day Percent Change: 2.49% Day Change: 0.12 | |
| Week Change: 6.01% Year-to-date Change: 112.0% | |
| VGAS Links: Profile News Message Board | |
| Charts:- Daily , Weekly | |
| Add VGAS to Watchlist: View: Get Complete VGAS Trend Analysis ➞ | |
 | UHG United Homes Group, Inc. |
| Sector: Services & Goods | |
| SubSector: Residential Construction | |
| MarketCap: 566 Millions | |
| Recent Price: 6.36 Smart Investing & Trading Score: 42 | |
| Day Percent Change: 0.79% Day Change: 0.05 | |
| Week Change: 5.82% Year-to-date Change: -24.2% | |
| UHG Links: Profile News Message Board | |
| Charts:- Daily , Weekly | |
| Add UHG to Watchlist: View: Get Complete UHG Trend Analysis ➞ | |
 | SNCY Sun Country Airlines Holdings, Inc. |
| Sector: Industrials | |
| SubSector: Airlines | |
| MarketCap: 1230 Millions | |
| Recent Price: 15.09 Smart Investing & Trading Score: 78 | |
| Day Percent Change: 3.57% Day Change: 0.52 | |
| Week Change: 5.82% Year-to-date Change: -4.6% | |
| SNCY Links: Profile News Message Board | |
| Charts:- Daily , Weekly | |
| Add SNCY to Watchlist: View: Get Complete SNCY Trend Analysis ➞ | |
 | IMAX IMAX Corporation |
| Sector: Services & Goods | |
| SubSector: Entertainment - Diversified | |
| MarketCap: 874.237 Millions | |
| Recent Price: 17.39 Smart Investing & Trading Score: 100 | |
| Day Percent Change: 1.85% Day Change: 0.32 | |
| Week Change: 5.81% Year-to-date Change: 15.8% | |
| IMAX Links: Profile News Message Board | |
| Charts:- Daily , Weekly | |
| Add IMAX to Watchlist: View: Get Complete IMAX Trend Analysis ➞ | |
 | PRCT PROCEPT BioRobotics Corporation |
| Sector: Health Care | |
| SubSector: Medical Devices | |
| MarketCap: 1600 Millions | |
| Recent Price: 53.61 Smart Investing & Trading Score: 83 | |
| Day Percent Change: 3.51% Day Change: 1.82 | |
| Week Change: 5.72% Year-to-date Change: 26.6% | |
| PRCT Links: Profile News Message Board | |
| Charts:- Daily , Weekly | |
| Add PRCT to Watchlist: View: Get Complete PRCT Trend Analysis ➞ | |
 | AIR AAR Corp. |
| Sector: Industrials | |
| SubSector: Aerospace/Defense Products & Services | |
| MarketCap: 591.701 Millions | |
| Recent Price: 64.23 Smart Investing & Trading Score: 83 | |
| Day Percent Change: 3.81% Day Change: 2.36 | |
| Week Change: 5.66% Year-to-date Change: 2.9% | |
| AIR Links: Profile News Message Board | |
| Charts:- Daily , Weekly | |
| Add AIR to Watchlist: View: Get Complete AIR Trend Analysis ➞ | |
 | MWA Mueller Water Products, Inc. |
| Sector: Industrials | |
| SubSector: Industrial Equipment & Components | |
| MarketCap: 1321.09 Millions | |
| Recent Price: 15.99 Smart Investing & Trading Score: 75 | |
| Day Percent Change: 4.27% Day Change: 0.65 | |
| Week Change: 5.44% Year-to-date Change: 11.1% | |
| MWA Links: Profile News Message Board | |
| Charts:- Daily , Weekly | |
| Add MWA to Watchlist: View: Get Complete MWA Trend Analysis ➞ | |
 | NUS Nu Skin Enterprises, Inc. |
| Sector: Consumer Staples | |
| SubSector: Personal Products | |
| MarketCap: 1230.85 Millions | |
| Recent Price: 12.69 Smart Investing & Trading Score: 52 | |
| Day Percent Change: 2.67% Day Change: 0.33 | |
| Week Change: 5.31% Year-to-date Change: -34.7% | |
| NUS Links: Profile News Message Board | |
| Charts:- Daily , Weekly | |
| Add NUS to Watchlist: View: Get Complete NUS Trend Analysis ➞ | |
 | GCBC Greene County Bancorp, Inc. |
| Sector: Financials | |
| SubSector: Savings & Loans | |
| MarketCap: 314.83 Millions | |
| Recent Price: 27.95 Smart Investing & Trading Score: 68 | |
| Day Percent Change: 2.53% Day Change: 0.69 | |
| Week Change: 5.19% Year-to-date Change: -0.9% | |
| GCBC Links: Profile News Message Board | |
| Charts:- Daily , Weekly | |
| Add GCBC to Watchlist: View: Get Complete GCBC Trend Analysis ➞ | |
| For tabular summary view of above stock list: Summary View ➞ 0 - 25 , 25 - 50 , 50 - 75 , 75 - 100 , 100 - 125 , 125 - 150 , 150 - 175 , 175 - 200 , 200 - 225 , 225 - 250 , 250 - 275 , 275 - 300 , 300 - 325 , 325 - 350 , 350 - 375 , 375 - 400 , 400 - 425 , 425 - 450 , 450 - 475 , 475 - 500 , 500 - 525 , 525 - 550 , 550 - 575 , 575 - 600 , 600 - 625 , 625 - 650 , 650 - 675 , 675 - 700 , 700 - 725 , 725 - 750 , 750 - 775 , 775 - 800 , 800 - 825 , 825 - 850 , 850 - 875 , 875 - 900 , 900 - 925 , 925 - 950 , 950 - 975 , 975 - 1000 , 1000 - 1025 , 1025 - 1050 , 1050 - 1075 , 1075 - 1100 , 1100 - 1125 , 1125 - 1150 , 1150 - 1175 , 1175 - 1200 , 1200 - 1225 , 1225 - 1250 , 1250 - 1275 , 1275 - 1300 , 1300 - 1325 , 1325 - 1350 , 1350 - 1375 , 1375 - 1400 , 1400 - 1425 , 1425 - 1450 , 1450 - 1475 , 1475 - 1500 | ||
| Click To Change The Sort Order: By Market Cap or Company Size Performance: Year-to-date, Week and Day | |
| Select Chart Type: | ||
| Too many stocks? View smallcap stocks filtered by marketcap & sector |
| Marketcap: All SmallCap Stocks (default-no microcap), Large, Mid-Range, Small & MicroCap |
| Sector: Tech, Finance, Energy, Staples, Retail, Industrial, Materials, Utilities & Medical |
|
Best Stocks Today 12Stocks.com |
© 2024 12Stocks.com Terms & Conditions Privacy Contact Us
All Information Provided Only For Education And Not To Be Used For Investing or Trading. See Terms & Conditions


One More Thing ... Get Best Stocks Delivered Daily!
Never Ever Miss A Move With Our Top Ten Stocks Lists
Find Best Stocks In Any Market - Bull or Bear Market
Take A Peek At Our Top Ten Stocks Lists: Daily, Weekly, Year-to-Date & Top Trends
Find Best Stocks In Any Market - Bull or Bear Market
Take A Peek At Our Top Ten Stocks Lists: Daily, Weekly, Year-to-Date & Top Trends
Smallcap Stocks With Best Up Trends [0-bearish to 100-bullish]: Oscar Health[100], Envestnet [100], IMAX [100], PrimeEnergy Resources[100], ALX Oncology[100], Vanda [100], Macatawa Bank[93], Encore Wire[93], Snap One[93], Willis Lease[93], Intra-Cellular Therapies[93]
Best Smallcap Stocks Year-to-Date:
Agenus [522.66%], CareMax [417.53%], Janux [348.12%], Viking [251.48%], Super Micro[239.3%], Alpine Immune[238.6%], Longboard [184.12%], Vera [161.3%], Avidity Biosciences[159.18%], Hippo [128.32%], Acrivon [118.61%] Best Smallcap Stocks This Week:
Macatawa Bank[45.05%], 23andMe Holding[33.3%], ProKidney [32%], Snap One[29.73%], Vertex Energy[25.96%], ALX Oncology[22.79%], Vanda [21.84%], Expensify [18.37%], E.W. Scripps[15%], Cullinan Oncology[13.89%], Humacyte [12.67%] Best Smallcap Stocks Daily:
23andMe Holding[65.91%], Vertex Energy[33.78%], Expensify [15.23%], Vuzix [13.73%], Badger Meter[12.03%], E.W. Scripps[11.68%], Zura Bio[10.99%], Vaxxinity [10.05%], Barnes Group[9.70%], eHealth [9.68%], Montrose Environmental[8.91%]