
 Login Sign Up


| |||||
 |  | ||||

| 12Stocks.com Market Intelligence |
Best SmallCap Stocks
|
| In a hurry? Small Cap Stock Lists: Performance Trends Table, Stock Charts
Sort Small Cap stocks: Daily, Weekly, Year-to-Date, Market Cap & Trends. Filter Small Cap stocks list by sector: Show all, Tech, Finance, Energy, Staples, Retail, Industrial, Materials, Utilities and HealthCare Filter Small Cap stocks list by size: All Large Medium Small and MicroCap |
| 12Stocks.com Small Cap Stocks Performances & Trends Daily | |||||||||
|
|  The overall Smart Investing & Trading Score is 90 (0-bearish to 100-bullish) which puts Small Cap index in short term bullish trend. The Smart Investing & Trading Score from previous trading session is 80 and hence an improvement of trend.
| ||||||||
Here are the Smart Investing & Trading Scores of the most requested small cap stocks at 12Stocks.com (click stock name for detailed review):
|


| 12Stocks.com: Investing in Smallcap Index with Stocks | |
|
The following table helps investors and traders sort through current performance and trends (as measured by Smart Investing & Trading Score) of various
stocks in the Smallcap Index. Quick View: Move mouse or cursor over stock symbol (ticker) to view short-term technical chart and over stock name to view long term chart. Click on  to add stock symbol to your watchlist and to add stock symbol to your watchlist and  to view watchlist. Click on any ticker or stock name for detailed market intelligence report for that stock. to view watchlist. Click on any ticker or stock name for detailed market intelligence report for that stock. |
12Stocks.com Performance of Stocks in Smallcap Index
| Ticker | Stock Name | Watchlist | Category | Recent Price | Smart Investing & Trading Score | Change % | YTD Change% |
| ALVR | AlloVir |   | Health Care | 11.47 | 100 | 16.92 | 10.82% |
| CARA | Cara | | Health Care | 18.25 | 100 | 14.34 | 13.49% |
| TYRA | Tyra Biosciences | | Health Care | 12.15 | 71 | 14.26 | -15.83% |
| ZURA | Zura Bio | | Health Care | 1.90 | 51 | 13.71 | -20.40% |
| ASRT | Assertio | | Health Care | 0.95 | 100 | 12.69 | 11.34% |
| FCEL | Fuelcell Energy | | Industrials | 7.65 | 100 | 12.67 | -26.23% |
| RILY | B. Riley | | Financials | 7.53 | 100 | 11.56 | 65.13% |
| BAND | Bandwidth | | Technology | 18.29 | 100 | 10.71 | 9.46% |
| WALD | Waldencast | | Consumer Staples | 1.97 | 80 | 10.67 | -47.33% |
| SCLX | Scilex Holding | | Health Care | 24.96 | 50 | 10.64 | 63.56% |
| PTSI | P.A.M. Transportation | | Transports | 21.80 | 100 | 10.55 | 0.00% |
| TRDA | Entrada | | Health Care | 5.09 | 25 | 10.55 | -66.05% |
| VERI | Veritone | | Technology | 4.10 | 100 | 9.92 | 28.13% |
| PSN | Parsons Corp | | Technology | 82.88 | 100 | 9.89 | -8.43% |
| NVTS | Navitas Semiconductor | | Technology | 6.46 | 80 | 9.68 | 85.10% |
| ACMR | ACM Research | | Technology | 33.76 | 100 | 9.11 | 116.83% |
| BHVN | Biohaven | | Health Care | 14.70 | 70 | 8.97 | -60.57% |
| ARCH | Arch Coal | | Materials | 10.35 | 80 | 8.72 | 8.15% |
| BE | Bloom Energy | | Industrials | 79.67 | 100 | 8.71 | 240.91% |
| OMI | Owens & Minor | | Health Care | 5.39 | 70 | 8.67 | -58.05% |
| GEVO | Gevo | | Materials | 2.05 | 100 | 8.47 | -11.64% |
| FEAM | 5E Advanced | | Materials | 3.99 | 54 | 8.29 | -68.95% |
| FTCI | FTC Solar | | Technology | 6.84 | 80 | 7.89 | 20.00% |
| SMMF | Summit Financial | | Financials | 7.05 | 30 | 7.80 | 0.00% |
| CCO | Clear Channel | | Technology | 1.39 | 100 | 7.75 | -0.71% |


| Too many stocks? View smallcap stocks filtered by marketcap & sector |
| Marketcap: All SmallCap Stocks (default-no microcap), Large, Mid-Range, Small |
| Smallcap Sector: Tech, Finance, Energy, Staples, Retail, Industrial, Materials, & Medical |
|
Get the most comprehensive stock market coverage daily at 12Stocks.com ➞ Best Stocks Today ➞ Best Stocks Weekly ➞ Best Stocks Year-to-Date ➞ Best Stocks Trends ➞  Best Stocks Today 12Stocks.com Best Nasdaq Stocks ➞ Best S&P 500 Stocks ➞ Best Tech Stocks ➞ Best Biotech Stocks ➞ |
| Detailed Overview of SmallCap Stocks |
| SmallCap Technical Overview, Leaders & Laggards, Top SmallCap ETF Funds & Detailed SmallCap Stocks List, Charts, Trends & More |
| Smallcap: Technical Analysis, Trends & YTD Performance | |
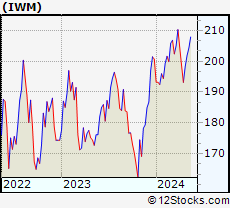
| SmallCap segment as represented by
IWM, an exchange-traded fund [ETF], holds basket of thousands of smallcap stocks from across all major sectors of the US stock market. The smallcap index (contains stocks like Riverbed & Sotheby's) is up by 9.61388% and is currently underperforming the overall market by -3.97482% year-to-date. Below is a quick view of technical charts and trends: | |
 IWM Weekly Chart |
|
| Long Term Trend: Very Good | |
| Medium Term Trend: Good | |
 IWM Daily Chart |
|
| Short Term Trend: Very Good | |
| Overall Trend Score: 90 | |
| YTD Performance: 9.61388% | |
| **Trend Scores & Views Are Only For Educational Purposes And Not For Investing | |
| 12Stocks.com: Top Performing Small Cap Index Stocks | ||||||||||||||||||||||||||||||||||||||||||||||||
 The top performing Small Cap Index stocks year to date are
Now, more recently, over last week, the top performing Small Cap Index stocks on the move are


|
||||||||||||||||||||||||||||||||||||||||||||||||
| 12Stocks.com: Investing in Smallcap Index using Exchange Traded Funds | |
|
The following table shows list of key exchange traded funds (ETF) that
help investors track Smallcap index. The following list also includes leveraged ETF funds that track twice or thrice the daily returns of Smallcap indices. Short or inverse ETF funds move in the opposite direction to the index they track and are useful during market pullbacks or during bear markets. Quick View: Move mouse or cursor over ETF symbol (ticker) to view short-term technical chart and over ETF name to view long term chart. Click on ticker or stock name for detailed view. Click on to add stock symbol to your watchlist and to view watchlist. |
12Stocks.com List of ETFs that track Smallcap Index
| Ticker | ETF Name | Watchlist | Recent Price | Smart Investing & Trading Score | Change % | Week % | Year-to-date % |
| IWM | iShares Russell 2000 ETF | | 241.19 | 90 | 0.962786 | 2.01328 | 9.61388% |
| IJR | iShares Core S&P Small-Cap ETF | | 117.95 | 30 | -0.025428 | 0.0339242 | 3.2819% |
| VTWO | Vanguard Russell 2000 Index ETF | | 96.93 | 80 | 0.248216 | 1.16898 | 9.0639% |
| IWN | iShares Russell 2000 Value ETF | | 175.07 | 50 | 0.0457169 | 0.206056 | 7.63206% |
| IWO | iShares Russell 2000 Growth ETF | | 315.01 | 80 | 0.283331 | 1.34805 | 9.36063% |
| IJS | iShares S&P Small-Cap 600 Value ETF | | 109.96 | 50 | 0.0728067 | 0.10925 | 2.50291% |
| IJT | iShares S&P Small-Cap 600 Growth ETF | | 140.39 | 30 | -0.0356024 | 0.0641483 | 3.99182% |
| XSLV | Invesco S&P SmallCap Low Volatility ETF | | 46.84 | 30 | 0.0168688 | -1.11885 | 0.602455% |
| SAA | ProShares Ultra SmallCap600 2x Shares | | 25.41 | 50 | -0.0220337 | 0.913423 | -1.51659% |
| SBB | ProShares Short SmallCap600 -1x Shares | | 14.05 | 50 | 0.0698006 | -0.473202 | -2.76282% |
| SMLV | SPDR SSGA US Small Cap Low Volatility Index ETF | | 132.22 | 70 | 0.731373 | 0.254769 | 6.04408% |
| SDD | ProShares UltraShort SmallCap600 -2x Shares | | 13.45 | 50 | 0.114649 | 0.694122 | -11.0908% |
| 12Stocks.com: Charts, Trends, Fundamental Data and Performances of SmallCap Stocks | |
|
We now take in-depth look at all SmallCap stocks including charts, multi-period performances and overall trends (as measured by Smart Investing & Trading Score). One can sort SmallCap stocks (click link to choose) by Daily, Weekly and by Year-to-Date performances. Also, one can sort by size of the company or by market capitalization. |
| Select Your Default Chart Type: | |||||
| |||||
| Click on stock symbol or name for detailed view. Click on to add stock symbol to your watchlist and to view watchlist. Quick View: Move mouse or cursor over "Daily" to quickly view daily technical stock chart and over "Weekly" to view weekly technical stock chart. | |||||

 | ALVR AlloVir, Inc. |
| Sector: Health Care | |
| SubSector: Biotechnology | |
| MarketCap: 25787 Millions | |
| Recent Price: 11.47 Smart Investing & Trading Score: 100 | |
| Day Percent Change: 16.9215% Day Change: -9999 | |
| Week Change: 20.8641% Year-to-date Change: 10.8% | |
| ALVR Links: Profile News Message Board | |
| Charts:- Daily , Weekly | |
| Add ALVR to Watchlist: View: Get Complete ALVR Trend Analysis ➞ | |
 | CARA Cara Therapeutics, Inc. |
| Sector: Health Care | |
| SubSector: Biotechnology | |
| MarketCap: 597.985 Millions | |
| Recent Price: 18.25 Smart Investing & Trading Score: 100 | |
| Day Percent Change: 14.3396% Day Change: -9999 | |
| Week Change: 25.4199% Year-to-date Change: 13.5% | |
| CARA Links: Profile News Message Board | |
| Charts:- Daily , Weekly | |
| Add CARA to Watchlist: View: Get Complete CARA Trend Analysis ➞ | |
 | TYRA Tyra Biosciences Inc |
| Sector: Health Care | |
| SubSector: Biotechnology | |
| MarketCap: 674.21 Millions | |
| Recent Price: 12.15 Smart Investing & Trading Score: 71 | |
| Day Percent Change: 14.26% Day Change: 1.46 | |
| Week Change: 9.35% Year-to-date Change: -15.8% | |
| TYRA Links: Profile News Message Board | |
| Charts:- Daily , Weekly | |
| Add TYRA to Watchlist: View: Get Complete TYRA Trend Analysis ➞ | |
 | ZURA Zura Bio Ltd |
| Sector: Health Care | |
| SubSector: Biotechnology | |
| MarketCap: 143.04 Millions | |
| Recent Price: 1.90 Smart Investing & Trading Score: 51 | |
| Day Percent Change: 13.71% Day Change: 0.24 | |
| Week Change: 15.7% Year-to-date Change: -20.4% | |
| ZURA Links: Profile News Message Board | |
| Charts:- Daily , Weekly | |
| Add ZURA to Watchlist: View: Get Complete ZURA Trend Analysis ➞ | |
 | ASRT Assertio Holdings Inc |
| Sector: Health Care | |
| SubSector: Drug Manufacturers - Specialty & Generic | |
| MarketCap: 76.78 Millions | |
| Recent Price: 0.95 Smart Investing & Trading Score: 100 | |
| Day Percent Change: 12.692% Day Change: -0.01 | |
| Week Change: 18.4606% Year-to-date Change: 11.3% | |
| ASRT Links: Profile News Message Board | |
| Charts:- Daily , Weekly | |
| Add ASRT to Watchlist: View: Get Complete ASRT Trend Analysis ➞ | |
 | FCEL Fuelcell Energy Inc |
| Sector: Industrials | |
| SubSector: Electrical Equipment & Parts | |
| MarketCap: 92.3 Millions | |
| Recent Price: 7.65 Smart Investing & Trading Score: 100 | |
| Day Percent Change: 12.6657% Day Change: 0.05 | |
| Week Change: 47.6834% Year-to-date Change: -26.2% | |
| FCEL Links: Profile News Message Board | |
| Charts:- Daily , Weekly | |
| Add FCEL to Watchlist: View: Get Complete FCEL Trend Analysis ➞ | |
 | RILY B. Riley Financial Inc |
| Sector: Financials | |
| SubSector: Financial Conglomerates | |
| MarketCap: 151.72 Millions | |
| Recent Price: 7.53 Smart Investing & Trading Score: 100 | |
| Day Percent Change: 11.5556% Day Change: -0.38 | |
| Week Change: 41.9416% Year-to-date Change: 65.1% | |
| RILY Links: Profile News Message Board | |
| Charts:- Daily , Weekly | |
| Add RILY to Watchlist: View: Get Complete RILY Trend Analysis ➞ | |
 | BAND Bandwidth Inc |
| Sector: Technology | |
| SubSector: Software - Infrastructure | |
| MarketCap: 472.61 Millions | |
| Recent Price: 18.29 Smart Investing & Trading Score: 100 | |
| Day Percent Change: 10.7143% Day Change: 0.07 | |
| Week Change: 17.3188% Year-to-date Change: 9.5% | |
| BAND Links: Profile News Message Board | |
| Charts:- Daily , Weekly | |
| Add BAND to Watchlist: View: Get Complete BAND Trend Analysis ➞ | |
 | WALD Waldencast plc |
| Sector: Consumer Staples | |
| SubSector: Household & Personal Products | |
| MarketCap: 218.44 Millions | |
| Recent Price: 1.97 Smart Investing & Trading Score: 80 | |
| Day Percent Change: 10.6742% Day Change: -0.05 | |
| Week Change: 6.48649% Year-to-date Change: -47.3% | |
| WALD Links: Profile News Message Board | |
| Charts:- Daily , Weekly | |
| Add WALD to Watchlist: View: Get Complete WALD Trend Analysis ➞ | |
 | SCLX Scilex Holding Company |
| Sector: Health Care | |
| SubSector: Drug Manufacturers - General | |
| MarketCap: 158.59 Millions | |
| Recent Price: 24.96 Smart Investing & Trading Score: 50 | |
| Day Percent Change: 10.6383% Day Change: -0.43 | |
| Week Change: -0.676482% Year-to-date Change: 63.6% | |
| SCLX Links: Profile News Message Board | |
| Charts:- Daily , Weekly | |
| Add SCLX to Watchlist: View: Get Complete SCLX Trend Analysis ➞ | |
 | PTSI P.A.M. Transportation Services, Inc. |
| Sector: Transports | |
| SubSector: Trucking | |
| MarketCap: 136.915 Millions | |
| Recent Price: 21.80 Smart Investing & Trading Score: 100 | |
| Day Percent Change: 10.5477% Day Change: -9999 | |
| Week Change: 33.0079% Year-to-date Change: 0.0% | |
| PTSI Links: Profile News Message Board | |
| Charts:- Daily , Weekly | |
| Add PTSI to Watchlist: View: Get Complete PTSI Trend Analysis ➞ | |
 | TRDA Entrada Therapeutics Inc |
| Sector: Health Care | |
| SubSector: Biotechnology | |
| MarketCap: 201.22 Millions | |
| Recent Price: 5.09 Smart Investing & Trading Score: 25 | |
| Day Percent Change: 10.55% Day Change: 0.56 | |
| Week Change: 11.81% Year-to-date Change: -66.1% | |
| TRDA Links: Profile News Message Board | |
| Charts:- Daily , Weekly | |
| Add TRDA to Watchlist: View: Get Complete TRDA Trend Analysis ➞ | |
 | VERI Veritone Inc |
| Sector: Technology | |
| SubSector: Software - Infrastructure | |
| MarketCap: 147.02 Millions | |
| Recent Price: 4.10 Smart Investing & Trading Score: 100 | |
| Day Percent Change: 9.91957% Day Change: -0.01 | |
| Week Change: 6.77083% Year-to-date Change: 28.1% | |
| VERI Links: Profile News Message Board | |
| Charts:- Daily , Weekly | |
| Add VERI to Watchlist: View: Get Complete VERI Trend Analysis ➞ | |
 | PSN Parsons Corp |
| Sector: Technology | |
| SubSector: Information Technology Services | |
| MarketCap: 8078.95 Millions | |
| Recent Price: 82.88 Smart Investing & Trading Score: 100 | |
| Day Percent Change: 9.89128% Day Change: 0.7 | |
| Week Change: 11.2483% Year-to-date Change: -8.4% | |
| PSN Links: Profile News Message Board | |
| Charts:- Daily , Weekly | |
| Add PSN to Watchlist: View: Get Complete PSN Trend Analysis ➞ | |
 | NVTS Navitas Semiconductor Corp |
| Sector: Technology | |
| SubSector: Semiconductors | |
| MarketCap: 1193.4 Millions | |
| Recent Price: 6.46 Smart Investing & Trading Score: 80 | |
| Day Percent Change: 9.67742% Day Change: -0.04 | |
| Week Change: 12.1528% Year-to-date Change: 85.1% | |
| NVTS Links: Profile News Message Board | |
| Charts:- Daily , Weekly | |
| Add NVTS to Watchlist: View: Get Complete NVTS Trend Analysis ➞ | |
 | ACMR ACM Research Inc |
| Sector: Technology | |
| SubSector: Semiconductor Equipment & Materials | |
| MarketCap: 1759.2 Millions | |
| Recent Price: 33.76 Smart Investing & Trading Score: 100 | |
| Day Percent Change: 9.11442% Day Change: 0.45 | |
| Week Change: 20.9602% Year-to-date Change: 116.8% | |
| ACMR Links: Profile News Message Board | |
| Charts:- Daily , Weekly | |
| Add ACMR to Watchlist: View: Get Complete ACMR Trend Analysis ➞ | |
 | BHVN Biohaven Ltd |
| Sector: Health Care | |
| SubSector: Biotechnology | |
| MarketCap: 1678.9 Millions | |
| Recent Price: 14.70 Smart Investing & Trading Score: 70 | |
| Day Percent Change: 8.96961% Day Change: -0.02 | |
| Week Change: 1.51934% Year-to-date Change: -60.6% | |
| BHVN Links: Profile News Message Board | |
| Charts:- Daily , Weekly | |
| Add BHVN to Watchlist: View: Get Complete BHVN Trend Analysis ➞ | |
 | ARCH Arch Coal, Inc. |
| Sector: Materials | |
| SubSector: Industrial Metals & Minerals | |
| MarketCap: 547.21 Millions | |
| Recent Price: 10.35 Smart Investing & Trading Score: 80 | |
| Day Percent Change: 8.71849% Day Change: -9999 | |
| Week Change: 13.1148% Year-to-date Change: 8.2% | |
| ARCH Links: Profile News Message Board | |
| Charts:- Daily , Weekly | |
| Add ARCH to Watchlist: View: Get Complete ARCH Trend Analysis ➞ | |
 | BE Bloom Energy Corp |
| Sector: Industrials | |
| SubSector: Electrical Equipment & Parts | |
| MarketCap: 13354.3 Millions | |
| Recent Price: 79.67 Smart Investing & Trading Score: 100 | |
| Day Percent Change: 8.70514% Day Change: 0.32 | |
| Week Change: 44.8545% Year-to-date Change: 240.9% | |
| BE Links: Profile News Message Board | |
| Charts:- Daily , Weekly | |
| Add BE to Watchlist: View: Get Complete BE Trend Analysis ➞ | |
 | OMI Owens & Minor, Inc |
| Sector: Health Care | |
| SubSector: Medical Distribution | |
| MarketCap: 434.11 Millions | |
| Recent Price: 5.39 Smart Investing & Trading Score: 70 | |
| Day Percent Change: 8.66935% Day Change: -0.26 | |
| Week Change: -2.53165% Year-to-date Change: -58.1% | |
| OMI Links: Profile News Message Board | |
| Charts:- Daily , Weekly | |
| Add OMI to Watchlist: View: Get Complete OMI Trend Analysis ➞ | |
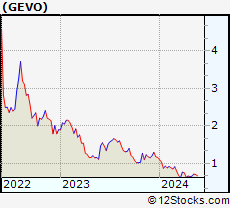 | GEVO Gevo Inc |
| Sector: Materials | |
| SubSector: Specialty Chemicals | |
| MarketCap: 403.87 Millions | |
| Recent Price: 2.05 Smart Investing & Trading Score: 100 | |
| Day Percent Change: 8.46561% Day Change: -0.01 | |
| Week Change: 27.3292% Year-to-date Change: -11.6% | |
| GEVO Links: Profile News Message Board | |
| Charts:- Daily , Weekly | |
| Add GEVO to Watchlist: View: Get Complete GEVO Trend Analysis ➞ | |
 | FEAM 5E Advanced Materials Inc |
| Sector: Materials | |
| SubSector: Specialty Chemicals | |
| MarketCap: 77.2 Millions | |
| Recent Price: 3.99 Smart Investing & Trading Score: 54 | |
| Day Percent Change: 8.29% Day Change: 0.35 | |
| Week Change: -3.59% Year-to-date Change: -69.0% | |
| FEAM Links: Profile News Message Board | |
| Charts:- Daily , Weekly | |
| Add FEAM to Watchlist: View: Get Complete FEAM Trend Analysis ➞ | |
 | FTCI FTC Solar Inc |
| Sector: Technology | |
| SubSector: Solar | |
| MarketCap: 93.41 Millions | |
| Recent Price: 6.84 Smart Investing & Trading Score: 80 | |
| Day Percent Change: 7.88644% Day Change: 0.68 | |
| Week Change: 6.21118% Year-to-date Change: 20.0% | |
| FTCI Links: Profile News Message Board | |
| Charts:- Daily , Weekly | |
| Add FTCI to Watchlist: View: Get Complete FTCI Trend Analysis ➞ | |
 | SMMF Summit Financial Group, Inc. |
| Sector: Financials | |
| SubSector: Regional - Mid-Atlantic Banks | |
| MarketCap: 228.959 Millions | |
| Recent Price: 7.05 Smart Investing & Trading Score: 30 | |
| Day Percent Change: 7.79817% Day Change: -9999 | |
| Week Change: -73.2549% Year-to-date Change: 0.0% | |
| SMMF Links: Profile News Message Board | |
| Charts:- Daily , Weekly | |
| Add SMMF to Watchlist: View: Get Complete SMMF Trend Analysis ➞ | |
 | CCO Clear Channel Outdoor Holdings Inc |
| Sector: Technology | |
| SubSector: Advertising Agencies | |
| MarketCap: 656.06 Millions | |
| Recent Price: 1.39 Smart Investing & Trading Score: 100 | |
| Day Percent Change: 7.75194% Day Change: -0.01 | |
| Week Change: 3.73134% Year-to-date Change: -0.7% | |
| CCO Links: Profile News Message Board | |
| Charts:- Daily , Weekly | |
| Add CCO to Watchlist: View: Get Complete CCO Trend Analysis ➞ | |
| Too many stocks? View smallcap stocks filtered by marketcap & sector |
| Marketcap: All SmallCap Stocks (default-no microcap), Large, Mid-Range, Small & MicroCap |
| Sector: Tech, Finance, Energy, Staples, Retail, Industrial, Materials, Utilities & Medical |
|
Best Stocks Today 12Stocks.com |
© 2025 12Stocks.com Terms & Conditions Privacy Contact Us
All Information Provided Only For Education And Not To Be Used For Investing or Trading. See Terms & Conditions


One More Thing ... Get Best Stocks Delivered Daily!
Never Ever Miss A Move With Our Top Ten Stocks Lists
Find Best Stocks In Any Market - Bull or Bear Market
Take A Peek At Our Top Ten Stocks Lists: Daily, Weekly, Year-to-Date & Top Trends
Find Best Stocks In Any Market - Bull or Bear Market
Take A Peek At Our Top Ten Stocks Lists: Daily, Weekly, Year-to-Date & Top Trends
Smallcap Stocks With Best Up Trends [0-bearish to 100-bullish]: AlloVir [100], Cara [100], Assertio [100], Fuelcell Energy[100], B. Riley[100], Bandwidth [100], P.A.M. Transportation[100], Veritone [100], Parsons Corp[100], ACM Research[100], Bloom Energy[100]
Best Smallcap Stocks Year-to-Date:
FiscalNote [323.077%], Celcuity [315.842%], Immuneering Corp[265.158%], Precigen [253.704%], OptimizeRx Corp[241.267%], Bloom Energy[240.907%], CommScope Holding[215.891%], EchoStar Corp[215.648%], Centrus Energy[210.804%], 908 Devices[198.174%], Digital Turbine[194.886%] Best Smallcap Stocks This Week:
Textainer Group[258.475%], United Community[163.439%], Lakeland Bancorp[147.684%], Office Properties[146.649%], Dominion Midstream[118.502%], PDL BioPharma[112.645%], GTx [108.706%], Overseas Shipholding[77.0318%], PGT Innovations[65.2536%], Vimeo [60.9148%], Babcock & Wilcox Enterprises[53.2338%] Best Smallcap Stocks Daily:
AlloVir [16.9215%], Cara [14.3396%], Tyra Biosciences[14.26%], Zura Bio[13.71%], Assertio [12.692%], Fuelcell Energy[12.6657%], B. Riley[11.5556%], Bandwidth [10.7143%], Waldencast [10.6742%], Scilex Holding[10.6383%], P.A.M. Transportation[10.5477%]