
 Login Sign Up


| |||||
 |  | ||||

| 12Stocks.com Market Intelligence |
Best S&P 500 Stocks
|
On this page, you will find the most comprehensive analysis of S&P 500 stocks and ETFs - from latest trends to performances to charts ➞. First, here are the year-to-date (YTD) performances of the most requested S&P 500 stocks at 12Stocks.com (click stock for review):
| Intel Corp 84% | ||
| Caterpillar Inc 38% | ||
| Goldman Sachs 37% | ||
| NVIDIA Corp 37% | ||
| Johnson & Johnson 31% | ||
| JPMorgan Chase 30% | ||
| Google Inc 30% | ||
| Boeing Co 27% | ||
| Microsoft 24% | ||
| Gilead 22% | ||
| Walmart Inc 13% | ||
| Chevron Corp 7% | ||
| Apple Inc 6% | ||
| McDonald's Corp 4% | ||
| Amazon.com Inc 1% | ||
| Starbucks Corp -5% | ||
| Merck & Co Inc -8% | ||
| Quick: S&P 500 Stocks Lists: Performances & Trends, S&P 500 Stock Charts
Sort S&P 500 stocks: Daily, Weekly, Year-to-Date, Market Cap & Trends. Filter S&P 500 stocks list by sector: Show all, Tech, Finance, Energy, Staples, Retail, Industrial, Materials, Utilities and HealthCare |
| 12Stocks.com S&P 500 Stocks Performances & Trends Daily Report | |||||||||
|
| 
The overall Smart Investing & Trading Score is 90 (0-bearish to 100-bullish) which puts S&P 500 index in short term bullish trend. The Smart Investing & Trading Score from previous trading session is 80 and an improvement of trend continues. | ||||||||
Here are the Smart Investing & Trading Scores of the most requested S&P 500 stocks at 12Stocks.com (click stock name for detailed review):
|


| 12Stocks.com: Top Performing S&P 500 Index Stocks | ||||||||||||||||||||||||||||||||||||||||||||||||
 The top performing S&P 500 Index stocks year to date are
Now, more recently, over last week, the top performing S&P 500 Index stocks on the move are


|
||||||||||||||||||||||||||||||||||||||||||||||||
| 12Stocks.com: Investing in S&P 500 Index with Stocks | |
|
The following table helps investors and traders sort through current performance and trends (as measured by Smart Investing & Trading Score) of various
stocks in the S&P 500 Index. Quick View: Move mouse or cursor over stock symbol (ticker) to view short-term technical chart and over stock name to view long term chart. Click on  to add stock symbol to your watchlist and to add stock symbol to your watchlist and  to view watchlist. Click on any ticker or stock name for detailed market intelligence report for that stock. to view watchlist. Click on any ticker or stock name for detailed market intelligence report for that stock. |
12Stocks.com Performance of Stocks in S&P 500 Index
| Ticker | Stock Name | Watchlist | Category | Recent Price | Smart Investing & Trading Score | Change % | YTD Change% |
| NVDA | NVIDIA Corp |   | Technology | 188.94 | 100 | 0.91% | 36.63% |
| MSFT | Microsoft | | Technology | 515.74 | 60 | -0.76% | 23.69% |
| AAPL | Apple Inc | | Technology | 257.13 | 70 | 0.66% | 5.82% |
| GOOG | Google Inc | | Technology | 246.43 | 80 | 0.36% | 29.57% |
| GOOGL | Google Inc | | Technology | 245.74 | 80 | 0.34% | 30.03% |
| META | Meta Platforms | | Technology | 727.06 | 30 | 1.36% | 21.53% |
| AVGO | Broadcom Inc | | Technology | 338.18 | 70 | 1.44% | 46.57% |
| ORCL | Oracle Corp | | Technology | 288.78 | 60 | -0.08% | 75.38% |
| NFLX | Netflix Inc | | Technology | 1162.30 | 10 | -0.73% | 31.08% |
| TMUS | T-Mobile US | | Technology | 230.14 | 0 | -1.34% | 5.57% |
| CSCO | Cisco Systems | | Technology | 68.31 | 70 | -0.64% | 17.85% |
| AMD | Advanced Micro | | Technology | 169.73 | 90 | 3.49% | 40.70% |
| CRM | Salesforce Inc | | Technology | 238.88 | 10 | 1.35% | -27.53% |
| IBM | Business | | Technology | 286.72 | 90 | 0.08% | 33.00% |
| DIS | Walt Disney | | Technology | 112.14 | 0 | -0.72% | 1.62% |
| T | AT&T Inc | | Technology | 27.01 | 0 | -1.96% | 22.33% |
| NOW | ServiceNow Inc | | Technology | 910.10 | 10 | -0.26% | -13.68% |
| UBER | Uber Technologies | | Technology | 96.80 | 30 | 0.20% | 53.24% |
| INTU | Intuit Inc | | Technology | 681.86 | 20 | 0.35% | 10.01% |
| VZ | Verizon | | Technology | 43.40 | 40 | -0.98% | 13.47% |
| ANET | Arista Networks | | Technology | 144.46 | 60 | -3.22% | 29.22% |
| QCOM | Qualcomm Inc | | Technology | 168.84 | 90 | 1.41% | 11.15% |
| TXN | Texas Instruments | | Technology | 182.30 | 30 | 1.06% | -0.21% |
| ACN | Accenture | | Technology | 244.34 | 40 | 0.26% | -28.95% |
| ADBE | Adobe Inc | | Technology | 351.55 | 50 | 2.28% | -20.28% |
| For chart view version of above stock list: Chart View ➞ 0 - 25 , 25 - 50 , 50 - 75 , 75 - 100 | ||
 | Click To Change The Sort Order: By Market Cap or Company Size Performance: Year-to-date, Week and Day |  |
|
Get the most comprehensive stock market coverage daily at 12Stocks.com ➞ Best Stocks Today ➞ Best Stocks Weekly ➞ Best Stocks Year-to-Date ➞ Best Stocks Trends ➞  Best Stocks Today 12Stocks.com Best Nasdaq Stocks ➞ Best S&P 500 Stocks ➞ Best Tech Stocks ➞ Best Biotech Stocks ➞ |
| Detailed Overview of S&P 500 Stocks |
| S&P 500 Technical Overview, Leaders & Laggards, Top S&P 500 ETF Funds & Detailed S&P 500 Stocks List, Charts, Trends & More |
| S&P 500: Technical Analysis, Trends & YTD Performance | |
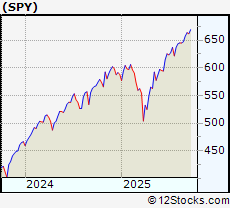
| S&P 500 index as represented by
SPY, an exchange-traded fund [ETF], holds basket of five hundred (mostly largecap) stocks from across all major sectors of the US stock market. The S&P 500 index (contains stocks like Apple and Exxon) is up by 15.1527% and is currently outperforming the overall market by 0.3948% year-to-date. Below is a quick view of technical charts and trends: | |
 SPY Weekly Chart |
|
| Long Term Trend: Very Good | |
| Medium Term Trend: Good | |
 SPY Daily Chart |
|
| Short Term Trend: Very Good | |
| Overall Trend Score: 90 | |
| YTD Performance: 15.1527% | |
| **Trend Scores & Views Are Only For Educational Purposes And Not For Investing | |
| 12Stocks.com: Investing in S&P 500 Index using Exchange Traded Funds | |
|
The following table shows list of key exchange traded funds (ETF) that
help investors track S&P 500 index. The following list also includes leveraged ETF funds that track twice or thrice the daily returns of S&P 500 indices. Short or inverse ETF funds move in the opposite direction to the index they track and are useful during market pullbacks or during bear markets. Quick View: Move mouse or cursor over ETF symbol (ticker) to view short-term technical chart and over ETF name to view long term chart. Click on ticker or stock name for detailed view. Click on to add stock symbol to your watchlist and to view watchlist. |
12Stocks.com List of ETFs that track S&P 500 Index
| Ticker | ETF Name | Watchlist | Recent Price | Smart Investing & Trading Score | Change % | Week % | Year-to-date % |
| SPY | SPDR S&P 500 ETF Trust | | 669.22 | 90 | 0.115192 | 1.22826 | 15.1527% |
| IVV | iShares Core S&P 500 ETF | | 672.50 | 90 | 0.0982377 | 1.24048 | 15.1922% |
| VOO | Vanguard S&P 500 ETF | | 615.25 | 90 | 0.107389 | 0.943396 | 15.2251% |
| OEF | iShares S&P 100 ETF | | 334.28 | 90 | 0.00598337 | 1.05505 | 16.5396% |
| SSO | ProShares Ultra S&P500 2x Shares | | 113.12 | 90 | 0.177117 | 2.334 | 23.4297% |
| UPRO | ProShares UltraPro S&P 500 ETF 3x Shares | | 113.01 | 90 | 0.275067 | 3.45112 | 29.2069% |
| SPXL | Direxion Daily S&P 500 Bull 3X Shares | | 214.76 | 90 | 0.28953 | 3.47386 | 29.2396% |
| SH | ProShares Short S&P500 -1x Shares | | 36.80 | 10 | -0.0543183 | -1.07527 | -11.8852% |
| SDS | ProShares UltraShort S&P500 -2x Shares | | 14.33 | 10 | -0.139373 | -2.1843 | -25.9516% |
| SPXU | ProShares UltraPro Short S&P 500 | | 13.34 | 10 | -0.224383 | -3.26323 | -40.0301% |
| SPXS | Direxion Daily S&P 500 Bear -3X Shares | | 37.50 | 70 | -0.239425 | 868.992 | 503.962% |
| 12Stocks.com: Charts, Trends, Fundamental Data and Performances of S&P 500 Stocks | |
|
We now take in-depth look at all S&P 500 stocks including charts, multi-period performances and overall trends (as measured by Smart Investing & Trading Score). One can sort S&P 500 stocks (click link to choose) by Daily, Weekly and by Year-to-Date performances. Also, one can sort by size of the company or by market capitalization. |
| Select Your Default Chart Type: | |||||
| |||||
| Click on stock symbol or name for detailed view. Click on to add stock symbol to your watchlist and to view watchlist. Quick View: Move mouse or cursor over "Daily" to quickly view daily technical stock chart and over "Weekly" to view weekly technical stock chart. | |||||

 | NVDA NVIDIA Corp |
| Sector: Technology | |
| SubSector: Semiconductors | |
| MarketCap: 4058590 Millions | |
| Recent Price: 188.94 Smart Investing & Trading Score: 100 | |
| Day Percent Change: 0.907926% Day Change: 1.55 | |
| Week Change: 6.76386% Year-to-date Change: 36.6% | |
| NVDA Links: Profile News Message Board | |
| Charts:- Daily , Weekly | |
| Add NVDA to Watchlist: View: Get NVDA Trend Analysis ➞ | |
 | MSFT Microsoft Corporation |
| Sector: Technology | |
| SubSector: Software - Infrastructure | |
| MarketCap: 3679420 Millions | |
| Recent Price: 515.74 Smart Investing & Trading Score: 60 | |
| Day Percent Change: -0.763888% Day Change: -2.57 | |
| Week Change: 1.09576% Year-to-date Change: 23.7% | |
| MSFT Links: Profile News Message Board | |
| Charts:- Daily , Weekly | |
| Add MSFT to Watchlist: View: Get MSFT Trend Analysis ➞ | |
 | AAPL Apple Inc |
| Sector: Technology | |
| SubSector: Consumer Electronics | |
| MarketCap: 3557090 Millions | |
| Recent Price: 257.13 Smart Investing & Trading Score: 70 | |
| Day Percent Change: 0.657663% Day Change: 2.57 | |
| Week Change: 1.91035% Year-to-date Change: 5.8% | |
| AAPL Links: Profile News Message Board | |
| Charts:- Daily , Weekly | |
| Add AAPL to Watchlist: View: Get AAPL Trend Analysis ➞ | |
 | GOOG Alphabet Inc |
| Sector: Technology | |
| SubSector: Internet Content & Information | |
| MarketCap: 2843010 Millions | |
| Recent Price: 246.43 Smart Investing & Trading Score: 80 | |
| Day Percent Change: 0.362466% Day Change: -0.56 | |
| Week Change: -0.564903% Year-to-date Change: 29.6% | |
| GOOG Links: Profile News Message Board | |
| Charts:- Daily , Weekly | |
| Add GOOG to Watchlist: View: Get GOOG Trend Analysis ➞ | |
 | GOOGL Alphabet Inc |
| Sector: Technology | |
| SubSector: Internet Content & Information | |
| MarketCap: 2843010 Millions | |
| Recent Price: 245.74 Smart Investing & Trading Score: 80 | |
| Day Percent Change: 0.342997% Day Change: -0.59 | |
| Week Change: -0.566481% Year-to-date Change: 30.0% | |
| GOOGL Links: Profile News Message Board | |
| Charts:- Daily , Weekly | |
| Add GOOGL to Watchlist: View: Get GOOGL Trend Analysis ➞ | |
 | META Meta Platforms Inc |
| Sector: Technology | |
| SubSector: Internet Content & Information | |
| MarketCap: 1890130 Millions | |
| Recent Price: 727.06 Smart Investing & Trading Score: 30 | |
| Day Percent Change: 1.35501% Day Change: 9.27 | |
| Week Change: -4.41722% Year-to-date Change: 21.5% | |
| META Links: Profile News Message Board | |
| Charts:- Daily , Weekly | |
| Add META to Watchlist: View: Get META Trend Analysis ➞ | |
 | AVGO Broadcom Inc |
| Sector: Technology | |
| SubSector: Semiconductors | |
| MarketCap: 1575150 Millions | |
| Recent Price: 338.18 Smart Investing & Trading Score: 70 | |
| Day Percent Change: 1.43676% Day Change: 7.16 | |
| Week Change: -0.333029% Year-to-date Change: 46.6% | |
| AVGO Links: Profile News Message Board | |
| Charts:- Daily , Weekly | |
| Add AVGO to Watchlist: View: Get AVGO Trend Analysis ➞ | |
 | ORCL Oracle Corp |
| Sector: Technology | |
| SubSector: Software - Infrastructure | |
| MarketCap: 653896 Millions | |
| Recent Price: 288.78 Smart Investing & Trading Score: 60 | |
| Day Percent Change: -0.079582% Day Change: 0.44 | |
| Week Change: -6.38008% Year-to-date Change: 75.4% | |
| ORCL Links: Profile News Message Board | |
| Charts:- Daily , Weekly | |
| Add ORCL to Watchlist: View: Get ORCL Trend Analysis ➞ | |
 | NFLX Netflix Inc |
| Sector: Technology | |
| SubSector: Entertainment | |
| MarketCap: 528532 Millions | |
| Recent Price: 1162.30 Smart Investing & Trading Score: 10 | |
| Day Percent Change: -0.734478% Day Change: -11.9 | |
| Week Change: -3.45945% Year-to-date Change: 31.1% | |
| NFLX Links: Profile News Message Board | |
| Charts:- Daily , Weekly | |
| Add NFLX to Watchlist: View: Get NFLX Trend Analysis ➞ | |
 | TMUS T-Mobile US Inc |
| Sector: Technology | |
| SubSector: Telecom Services | |
| MarketCap: 284461 Millions | |
| Recent Price: 230.14 Smart Investing & Trading Score: 0 | |
| Day Percent Change: -1.33756% Day Change: -2.58 | |
| Week Change: -3.46477% Year-to-date Change: 5.6% | |
| TMUS Links: Profile News Message Board | |
| Charts:- Daily , Weekly | |
| Add TMUS to Watchlist: View: Get TMUS Trend Analysis ➞ | |
 | CSCO Cisco Systems, Inc |
| Sector: Technology | |
| SubSector: Communication Equipment | |
| MarketCap: 264469 Millions | |
| Recent Price: 68.31 Smart Investing & Trading Score: 70 | |
| Day Percent Change: -0.644364% Day Change: -0.08 | |
| Week Change: 1.46613% Year-to-date Change: 17.8% | |
| CSCO Links: Profile News Message Board | |
| Charts:- Daily , Weekly | |
| Add CSCO to Watchlist: View: Get CSCO Trend Analysis ➞ | |
 | AMD Advanced Micro Devices Inc |
| Sector: Technology | |
| SubSector: Semiconductors | |
| MarketCap: 245277 Millions | |
| Recent Price: 169.73 Smart Investing & Trading Score: 90 | |
| Day Percent Change: 3.48759% Day Change: 6.03 | |
| Week Change: 5.50099% Year-to-date Change: 40.7% | |
| AMD Links: Profile News Message Board | |
| Charts:- Daily , Weekly | |
| Add AMD to Watchlist: View: Get AMD Trend Analysis ➞ | |
 | CRM Salesforce Inc |
| Sector: Technology | |
| SubSector: Software - Application | |
| MarketCap: 238724 Millions | |
| Recent Price: 238.88 Smart Investing & Trading Score: 10 | |
| Day Percent Change: 1.35347% Day Change: 3.19 | |
| Week Change: -2.85087% Year-to-date Change: -27.5% | |
| CRM Links: Profile News Message Board | |
| Charts:- Daily , Weekly | |
| Add CRM to Watchlist: View: Get CRM Trend Analysis ➞ | |
 | IBM International Business Machines Corp |
| Sector: Technology | |
| SubSector: Information Technology Services | |
| MarketCap: 231510 Millions | |
| Recent Price: 286.72 Smart Investing & Trading Score: 90 | |
| Day Percent Change: 0.080282% Day Change: 0.96 | |
| Week Change: 7.17303% Year-to-date Change: 33.0% | |
| IBM Links: Profile News Message Board | |
| Charts:- Daily , Weekly | |
| Add IBM to Watchlist: View: Get IBM Trend Analysis ➞ | |
 | DIS Walt Disney Co |
| Sector: Technology | |
| SubSector: Entertainment | |
| MarketCap: 211994 Millions | |
| Recent Price: 112.14 Smart Investing & Trading Score: 0 | |
| Day Percent Change: -0.717131% Day Change: -0.38 | |
| Week Change: -1.13727% Year-to-date Change: 1.6% | |
| DIS Links: Profile News Message Board | |
| Charts:- Daily , Weekly | |
| Add DIS to Watchlist: View: Get DIS Trend Analysis ➞ | |
 | T AT&T, Inc |
| Sector: Technology | |
| SubSector: Telecom Services | |
| MarketCap: 211580 Millions | |
| Recent Price: 27.01 Smart Investing & Trading Score: 0 | |
| Day Percent Change: -1.96007% Day Change: -0.55 | |
| Week Change: -4.62571% Year-to-date Change: 22.3% | |
| T Links: Profile News Message Board | |
| Charts:- Daily , Weekly | |
| Add T to Watchlist: View: Get T Trend Analysis ➞ | |
 | NOW ServiceNow Inc |
| Sector: Technology | |
| SubSector: Software - Application | |
| MarketCap: 190070 Millions | |
| Recent Price: 910.10 Smart Investing & Trading Score: 10 | |
| Day Percent Change: -0.255362% Day Change: -3.51 | |
| Week Change: -2.49312% Year-to-date Change: -13.7% | |
| NOW Links: Profile News Message Board | |
| Charts:- Daily , Weekly | |
| Add NOW to Watchlist: View: Get NOW Trend Analysis ➞ | |
 | UBER Uber Technologies Inc |
| Sector: Technology | |
| SubSector: Software - Application | |
| MarketCap: 189752 Millions | |
| Recent Price: 96.80 Smart Investing & Trading Score: 30 | |
| Day Percent Change: 0.196667% Day Change: -0.85 | |
| Week Change: -1.00225% Year-to-date Change: 53.2% | |
| UBER Links: Profile News Message Board | |
| Charts:- Daily , Weekly | |
| Add UBER to Watchlist: View: Get UBER Trend Analysis ➞ | |
 | INTU Intuit Inc |
| Sector: Technology | |
| SubSector: Software - Application | |
| MarketCap: 187586 Millions | |
| Recent Price: 681.86 Smart Investing & Trading Score: 20 | |
| Day Percent Change: 0.347314% Day Change: -3.88 | |
| Week Change: -1.86099% Year-to-date Change: 10.0% | |
| INTU Links: Profile News Message Board | |
| Charts:- Daily , Weekly | |
| Add INTU to Watchlist: View: Get INTU Trend Analysis ➞ | |
 | VZ Verizon Communications Inc |
| Sector: Technology | |
| SubSector: Telecom Services | |
| MarketCap: 187121 Millions | |
| Recent Price: 43.40 Smart Investing & Trading Score: 40 | |
| Day Percent Change: -0.981063% Day Change: -0.34 | |
| Week Change: 0.509495% Year-to-date Change: 13.5% | |
| VZ Links: Profile News Message Board | |
| Charts:- Daily , Weekly | |
| Add VZ to Watchlist: View: Get VZ Trend Analysis ➞ | |
 | ANET Arista Networks Inc |
| Sector: Technology | |
| SubSector: Computer Hardware | |
| MarketCap: 179543 Millions | |
| Recent Price: 144.46 Smart Investing & Trading Score: 60 | |
| Day Percent Change: -3.22235% Day Change: -4.88 | |
| Week Change: 1.27594% Year-to-date Change: 29.2% | |
| ANET Links: Profile News Message Board | |
| Charts:- Daily , Weekly | |
| Add ANET to Watchlist: View: Get ANET Trend Analysis ➞ | |
 | QCOM Qualcomm, Inc |
| Sector: Technology | |
| SubSector: Semiconductors | |
| MarketCap: 172467 Millions | |
| Recent Price: 168.84 Smart Investing & Trading Score: 90 | |
| Day Percent Change: 1.4145% Day Change: 2.39 | |
| Week Change: -2.71103% Year-to-date Change: 11.2% | |
| QCOM Links: Profile News Message Board | |
| Charts:- Daily , Weekly | |
| Add QCOM to Watchlist: View: Get QCOM Trend Analysis ➞ | |
 | TXN Texas Instruments Inc |
| Sector: Technology | |
| SubSector: Semiconductors | |
| MarketCap: 170854 Millions | |
| Recent Price: 182.30 Smart Investing & Trading Score: 30 | |
| Day Percent Change: 1.05882% Day Change: 1.79 | |
| Week Change: -1.15759% Year-to-date Change: -0.2% | |
| TXN Links: Profile News Message Board | |
| Charts:- Daily , Weekly | |
| Add TXN to Watchlist: View: Get TXN Trend Analysis ➞ | |
 | ACN Accenture plc |
| Sector: Technology | |
| SubSector: Information Technology Services | |
| MarketCap: 158796 Millions | |
| Recent Price: 244.34 Smart Investing & Trading Score: 40 | |
| Day Percent Change: 0.258504% Day Change: 0.3 | |
| Week Change: 2.2001% Year-to-date Change: -29.0% | |
| ACN Links: Profile News Message Board | |
| Charts:- Daily , Weekly | |
| Add ACN to Watchlist: View: Get ACN Trend Analysis ➞ | |
 | ADBE Adobe Inc |
| Sector: Technology | |
| SubSector: Software - Application | |
| MarketCap: 148033 Millions | |
| Recent Price: 351.55 Smart Investing & Trading Score: 50 | |
| Day Percent Change: 2.27802% Day Change: 6.51 | |
| Week Change: -0.48688% Year-to-date Change: -20.3% | |
| ADBE Links: Profile News Message Board | |
| Charts:- Daily , Weekly | |
| Add ADBE to Watchlist: View: Get ADBE Trend Analysis ➞ | |
| For tabular summary view of above stock list: Summary View ➞ 0 - 25 , 25 - 50 , 50 - 75 , 75 - 100 | ||
| Click To Change The Sort Order: By Market Cap or Company Size Performance: Year-to-date, Week and Day | |
| Select Chart Type: | ||
|
Best Stocks Today 12Stocks.com |
© 2025 12Stocks.com Terms & Conditions Privacy Contact Us
All Information Provided Only For Education And Not To Be Used For Investing or Trading. See Terms & Conditions


One More Thing ... Get Best Stocks Delivered Daily!
Never Ever Miss A Move With Our Top Ten Stocks Lists
Find Best Stocks In Any Market - Bull or Bear Market
Take A Peek At Our Top Ten Stocks Lists: Daily, Weekly, Year-to-Date & Top Trends
Find Best Stocks In Any Market - Bull or Bear Market
Take A Peek At Our Top Ten Stocks Lists: Daily, Weekly, Year-to-Date & Top Trends
S&P 500 Stocks With Best Up Trends [0-bearish to 100-bullish]: Fair Isaac[100], Intel Corp[100], Bio-Techne Corp[100], DuPont de[100], First Solar[100], Centene Corp[100], Lam Research[100], Charles River[100], Applied Materials[100], Steel Dynamics[100], Teradyne Inc[100]
Best S&P 500 Stocks Year-to-Date:
Seagate [198.865%], Western Digital[181.204%], Newmont Corp[127.671%], Micron [110.87%], Lam Research[103.976%], Intel Corp[84.4708%], Warner Bros.[84.2%], NRG [82.3658%], CVS Health[81.156%], Amphenol Corp[79.8571%], KLA Corp[79.7904%] Best S&P 500 Stocks This Week:
Pioneer Natural[108.1%], Bio-Techne Corp[21.2222%], Electronic Arts[20.1076%], Western Digital[19.6645%], Intel Corp[19.4747%], Charles River[17.3369%], Fair Isaac[15.6495%], Lamb Weston[15.5663%], Lam Research[14.5184%], Seagate [13.8757%], Micron [13.6232%] Best S&P 500 Stocks Daily:
Fair Isaac[17.979%], Celanese Corp[6.98937%], Humana Inc[3.99157%], CF Industries[3.94539%], Eastman Chemical[3.88961%], Intel Corp[3.78408%], Albemarle Corp[3.7173%], Caesars Entertainment[3.66089%], Bio-Techne Corp[3.6215%], DuPont de[3.54129%], Advanced Micro[3.48759%]