
 Login Sign Up


| |||||
 |  | ||||

| 12Stocks.com Market Intelligence |
Best S&P 500 Stocks
|
On this page, you will find the most comprehensive analysis of S&P 500 stocks and ETFs - from latest trends to performances to charts ➞. First, here are the year-to-date (YTD) performances of the most requested S&P 500 stocks at 12Stocks.com (click stock for review):
| NVIDIA 65% | ||
| Merck 19% | ||
| Caterpillar 15% | ||
| Walmart 14% | ||
| JPMorgan Chase 13% | ||
| Amazon.com 13% | ||
| Google 11% | ||
| Chevron 10% | ||
| Goldman Sachs 8% | ||
| Microsoft 4% | ||
| Johnson & Johnson -6% | ||
| McDonald s -7% | ||
| Starbucks -8% | ||
| Apple -12% | ||
| Gilead -19% | ||
| Intel -31% | ||
| Boeing -38% | ||
| Quick: S&P 500 Stocks Lists: Performances & Trends, S&P 500 Stock Charts
Sort S&P 500 stocks: Daily, Weekly, Year-to-Date, Market Cap & Trends. Filter S&P 500 stocks list by sector: Show all, Tech, Finance, Energy, Staples, Retail, Industrial, Materials, Utilities and HealthCare |
| 12Stocks.com S&P 500 Stocks Performances & Trends Daily Report | |||||||||
|
| 
The overall Smart Investing & Trading Score is 44 (0-bearish to 100-bullish) which puts S&P 500 index in short term neutral trend. The Smart Investing & Trading Score from previous trading session is 58 and hence a deterioration of trend. | ||||||||
Here are the Smart Investing & Trading Scores of the most requested S&P 500 stocks at 12Stocks.com (click stock name for detailed review):
|


| 12Stocks.com: Top Performing S&P 500 Index Stocks | ||||||||||||||||||||||||||||||||||||||||||||||||
 The top performing S&P 500 Index stocks year to date are
Now, more recently, over last week, the top performing S&P 500 Index stocks on the move are


|
||||||||||||||||||||||||||||||||||||||||||||||||
| 12Stocks.com: Investing in S&P 500 Index with Stocks | |
|
The following table helps investors and traders sort through current performance and trends (as measured by Smart Investing & Trading Score) of various
stocks in the S&P 500 Index. Quick View: Move mouse or cursor over stock symbol (ticker) to view short-term technical chart and over stock name to view long term chart. Click on  to add stock symbol to your watchlist and to add stock symbol to your watchlist and  to view watchlist. Click on any ticker or stock name for detailed market intelligence report for that stock. to view watchlist. Click on any ticker or stock name for detailed market intelligence report for that stock. |
12Stocks.com Performance of Stocks in S&P 500 Index
| Ticker | Stock Name | Watchlist | Category | Recent Price | Smart Investing & Trading Score | Change % | YTD Change% |
| CDNS | Cadence Design |   | Technology | 275.18 | 10 | -0.89% | 1.03% |
| MCHP | Microchip | | Technology | 90.28 | 100 | -0.44% | 0.11% |
| FTV | Fortive | | Technology | 75.37 | 0 | -0.89% | 2.36% |
| GLW | Corning | | Technology | 31.25 | 28 | -0.84% | 2.64% |
| PANW | Palo Alto | | Technology | 284.76 | 57 | -3.08% | -3.43% |
| MTCH | Match | | Technology | 31.15 | 15 | -2.49% | -14.67% |
| AKAM | Akamai Technologies | | Technology | 100.63 | 18 | -1.53% | -14.97% |
| ANET | Arista Networks | | Technology | 262.46 | 32 | 3.02% | 11.44% |
| SWKS | Skyworks Solutions | | Technology | 101.98 | 42 | 0.85% | -9.29% |
| GRMN | Garmin | | Technology | 140.97 | 49 | -1.27% | 9.67% |
| PAYC | Paycom Software | | Technology | 184.93 | 35 | -1.59% | -10.54% |
| HPE | Hewlett Packard | | Technology | 17.00 | 61 | 0.41% | 0.12% |
| CDW | CDW | | Technology | 240.50 | 51 | -0.08% | 5.80% |
| TTWO | Take-Two Interactive | | Technology | 141.84 | 42 | -0.69% | -11.87% |
| LDOS | Leidos Holdings | | Technology | 129.42 | 83 | 0.40% | 19.57% |
| EPAM | EPAM Systems | | Technology | 237.29 | 18 | -3.15% | -20.20% |
| ZBRA | Zebra Technologies | | Technology | 279.48 | 68 | 0.70% | 2.25% |
| STX | Seagate | | Technology | 86.64 | 38 | -0.54% | 1.49% |
| TYL | Tyler Technologies | | Technology | 445.16 | 64 | 6.24% | 6.47% |
| WDC | Western Digital | | Technology | 68.55 | 44 | -1.45% | 30.89% |
| JKHY | Jack Henry | | Technology | 165.69 | 41 | 0.30% | 1.40% |
| BR | Broadridge Financial | | Technology | 194.32 | 25 | -0.39% | -5.56% |
| QRVO | Qorvo | | Technology | 113.14 | 85 | 0.88% | 0.47% |
| TDY | Teledyne Technologies | | Technology | 368.81 | 0 | 1.74% | -17.36% |
| NTAP | NetApp | | Technology | 99.94 | 63 | -0.11% | 13.37% |
| For chart view version of above stock list: Chart View ➞ 0 - 25 , 25 - 50 , 50 - 75 , 75 - 100 | ||
 | Click To Change The Sort Order: By Market Cap or Company Size Performance: Year-to-date, Week and Day |  |
|
Get the most comprehensive stock market coverage daily at 12Stocks.com ➞ Best Stocks Today ➞ Best Stocks Weekly ➞ Best Stocks Year-to-Date ➞ Best Stocks Trends ➞  Best Stocks Today 12Stocks.com Best Nasdaq Stocks ➞ Best S&P 500 Stocks ➞ Best Tech Stocks ➞ Best Biotech Stocks ➞ |
| Detailed Overview of S&P 500 Stocks |
| S&P 500 Technical Overview, Leaders & Laggards, Top S&P 500 ETF Funds & Detailed S&P 500 Stocks List, Charts, Trends & More |
| S&P 500: Technical Analysis, Trends & YTD Performance | |
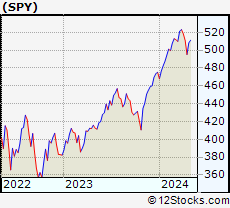
| S&P 500 index as represented by
SPY, an exchange-traded fund [ETF], holds basket of five hundred (mostly largecap) stocks from across all major sectors of the US stock market. The S&P 500 index (contains stocks like Apple and Exxon) is up by 4.99% and is currently outperforming the overall market by 0.74% year-to-date. Below is a quick view of technical charts and trends: | |
 SPY Weekly Chart |
|
| Long Term Trend: Good | |
| Medium Term Trend: Not Good | |
 SPY Daily Chart |
|
| Short Term Trend: Not Good | |
| Overall Trend Score: 44 | |
| YTD Performance: 4.99% | |
| **Trend Scores & Views Are Only For Educational Purposes And Not For Investing | |
| 12Stocks.com: Investing in S&P 500 Index using Exchange Traded Funds | |
|
The following table shows list of key exchange traded funds (ETF) that
help investors track S&P 500 index. The following list also includes leveraged ETF funds that track twice or thrice the daily returns of S&P 500 indices. Short or inverse ETF funds move in the opposite direction to the index they track and are useful during market pullbacks or during bear markets. Quick View: Move mouse or cursor over ETF symbol (ticker) to view short-term technical chart and over ETF name to view long term chart. Click on ticker or stock name for detailed view. Click on to add stock symbol to your watchlist and to view watchlist. |
12Stocks.com List of ETFs that track S&P 500 Index
| Ticker | ETF Name | Watchlist | Recent Price | Smart Investing & Trading Score | Change % | Week % | Year-to-date % |
| SPY | SPDR S&P 500 ETF | | 499.05 | 44 | -1.26 | 0.78 | 4.99% |
| OEF | iShares S&P 100 | | 235.81 | 34 | -1.66 | 0.48 | 5.56% |
| SSO | ProShares Ultra S&P500 | | 70.09 | 44 | -2.59 | 1.42 | 7.71% |
| UPRO | ProShares UltraPro S&P500 | | 60.43 | 36 | -3.90 | 2.15 | 10.39% |
| SH | ProShares Short S&P500 | | 12.52 | 62 | 1.54 | -0.56 | -3.62% |
| SDS | ProShares UltraShort S&P500 | | 27.50 | 62 | 2.61 | -1.43 | -8.09% |
| SPXU | ProShares UltraPro Short S&P500 | | 37.50 | 69 | 4.05 | -2.17 | -12.79% |
| 12Stocks.com: Charts, Trends, Fundamental Data and Performances of S&P 500 Stocks | |
|
We now take in-depth look at all S&P 500 stocks including charts, multi-period performances and overall trends (as measured by Smart Investing & Trading Score). One can sort S&P 500 stocks (click link to choose) by Daily, Weekly and by Year-to-Date performances. Also, one can sort by size of the company or by market capitalization. |
| Select Your Default Chart Type: | |||||
| |||||
| Click on stock symbol or name for detailed view. Click on to add stock symbol to your watchlist and to view watchlist. Quick View: Move mouse or cursor over "Daily" to quickly view daily technical stock chart and over "Weekly" to view weekly technical stock chart. | |||||

 | CDNS Cadence Design Systems, Inc. |
| Sector: Technology | |
| SubSector: Application Software | |
| MarketCap: 16865.8 Millions | |
| Recent Price: 275.18 Smart Investing & Trading Score: 10 | |
| Day Percent Change: -0.89% Day Change: -2.48 | |
| Week Change: -1.81% Year-to-date Change: 1.0% | |
| CDNS Links: Profile News Message Board | |
| Charts:- Daily , Weekly | |
| Add CDNS to Watchlist: View: Get CDNS Trend Analysis ➞ | |
 | MCHP Microchip Technology Incorporated |
| Sector: Technology | |
| SubSector: Semiconductor - Broad Line | |
| MarketCap: 16826.3 Millions | |
| Recent Price: 90.28 Smart Investing & Trading Score: 100 | |
| Day Percent Change: -0.44% Day Change: -0.40 | |
| Week Change: 10.53% Year-to-date Change: 0.1% | |
| MCHP Links: Profile News Message Board | |
| Charts:- Daily , Weekly | |
| Add MCHP to Watchlist: View: Get MCHP Trend Analysis ➞ | |
 | FTV Fortive Corporation |
| Sector: Technology | |
| SubSector: Scientific & Technical Instruments | |
| MarketCap: 16351.9 Millions | |
| Recent Price: 75.37 Smart Investing & Trading Score: 0 | |
| Day Percent Change: -0.89% Day Change: -0.68 | |
| Week Change: -5.18% Year-to-date Change: 2.4% | |
| FTV Links: Profile News Message Board | |
| Charts:- Daily , Weekly | |
| Add FTV to Watchlist: View: Get FTV Trend Analysis ➞ | |
 | GLW Corning Incorporated |
| Sector: Technology | |
| SubSector: Diversified Electronics | |
| MarketCap: 16287.6 Millions | |
| Recent Price: 31.25 Smart Investing & Trading Score: 28 | |
| Day Percent Change: -0.84% Day Change: -0.27 | |
| Week Change: -0.05% Year-to-date Change: 2.6% | |
| GLW Links: Profile News Message Board | |
| Charts:- Daily , Weekly | |
| Add GLW to Watchlist: View: Get GLW Trend Analysis ➞ | |
 | PANW Palo Alto Networks, Inc. |
| Sector: Technology | |
| SubSector: Networking & Communication Devices | |
| MarketCap: 16039.4 Millions | |
| Recent Price: 284.76 Smart Investing & Trading Score: 57 | |
| Day Percent Change: -3.08% Day Change: -9.06 | |
| Week Change: 2.54% Year-to-date Change: -3.4% | |
| PANW Links: Profile News Message Board | |
| Charts:- Daily , Weekly | |
| Add PANW to Watchlist: View: Get PANW Trend Analysis ➞ | |
 | MTCH Match Group, Inc. |
| Sector: Technology | |
| SubSector: Internet Information Providers | |
| MarketCap: 14655.8 Millions | |
| Recent Price: 31.15 Smart Investing & Trading Score: 15 | |
| Day Percent Change: -2.49% Day Change: -0.80 | |
| Week Change: -3.22% Year-to-date Change: -14.7% | |
| MTCH Links: Profile News Message Board | |
| Charts:- Daily , Weekly | |
| Add MTCH to Watchlist: View: Get MTCH Trend Analysis ➞ | |
 | AKAM Akamai Technologies, Inc. |
| Sector: Technology | |
| SubSector: Internet Information Providers | |
| MarketCap: 14495.5 Millions | |
| Recent Price: 100.63 Smart Investing & Trading Score: 18 | |
| Day Percent Change: -1.53% Day Change: -1.56 | |
| Week Change: -0.86% Year-to-date Change: -15.0% | |
| AKAM Links: Profile News Message Board | |
| Charts:- Daily , Weekly | |
| Add AKAM to Watchlist: View: Get AKAM Trend Analysis ➞ | |
 | ANET Arista Networks, Inc. |
| Sector: Technology | |
| SubSector: Diversified Computer Systems | |
| MarketCap: 14071.2 Millions | |
| Recent Price: 262.46 Smart Investing & Trading Score: 32 | |
| Day Percent Change: 3.02% Day Change: 7.69 | |
| Week Change: 6.65% Year-to-date Change: 11.4% | |
| ANET Links: Profile News Message Board | |
| Charts:- Daily , Weekly | |
| Add ANET to Watchlist: View: Get ANET Trend Analysis ➞ | |
 | SWKS Skyworks Solutions, Inc. |
| Sector: Technology | |
| SubSector: Semiconductor - Integrated Circuits | |
| MarketCap: 13981 Millions | |
| Recent Price: 101.98 Smart Investing & Trading Score: 42 | |
| Day Percent Change: 0.85% Day Change: 0.86 | |
| Week Change: 6.11% Year-to-date Change: -9.3% | |
| SWKS Links: Profile News Message Board | |
| Charts:- Daily , Weekly | |
| Add SWKS to Watchlist: View: Get SWKS Trend Analysis ➞ | |
 | GRMN Garmin Ltd. |
| Sector: Technology | |
| SubSector: Scientific & Technical Instruments | |
| MarketCap: 13909.3 Millions | |
| Recent Price: 140.97 Smart Investing & Trading Score: 49 | |
| Day Percent Change: -1.27% Day Change: -1.82 | |
| Week Change: 1.04% Year-to-date Change: 9.7% | |
| GRMN Links: Profile News Message Board | |
| Charts:- Daily , Weekly | |
| Add GRMN to Watchlist: View: Get GRMN Trend Analysis ➞ | |
 | PAYC Paycom Software, Inc. |
| Sector: Technology | |
| SubSector: Application Software | |
| MarketCap: 13041.6 Millions | |
| Recent Price: 184.93 Smart Investing & Trading Score: 35 | |
| Day Percent Change: -1.59% Day Change: -2.98 | |
| Week Change: 0.91% Year-to-date Change: -10.5% | |
| PAYC Links: Profile News Message Board | |
| Charts:- Daily , Weekly | |
| Add PAYC to Watchlist: View: Get PAYC Trend Analysis ➞ | |
 | HPE Hewlett Packard Enterprise Company |
| Sector: Technology | |
| SubSector: Communication Equipment | |
| MarketCap: 12886.1 Millions | |
| Recent Price: 17.00 Smart Investing & Trading Score: 61 | |
| Day Percent Change: 0.41% Day Change: 0.07 | |
| Week Change: 1.25% Year-to-date Change: 0.1% | |
| HPE Links: Profile News Message Board | |
| Charts:- Daily , Weekly | |
| Add HPE to Watchlist: View: Get HPE Trend Analysis ➞ | |
 | CDW CDW Corporation |
| Sector: Technology | |
| SubSector: Information Technology Services | |
| MarketCap: 12775 Millions | |
| Recent Price: 240.50 Smart Investing & Trading Score: 51 | |
| Day Percent Change: -0.08% Day Change: -0.19 | |
| Week Change: 2% Year-to-date Change: 5.8% | |
| CDW Links: Profile News Message Board | |
| Charts:- Daily , Weekly | |
| Add CDW to Watchlist: View: Get CDW Trend Analysis ➞ | |
 | TTWO Take-Two Interactive Software, Inc. |
| Sector: Technology | |
| SubSector: Multimedia & Graphics Software | |
| MarketCap: 12479.6 Millions | |
| Recent Price: 141.84 Smart Investing & Trading Score: 42 | |
| Day Percent Change: -0.69% Day Change: -0.99 | |
| Week Change: 0.88% Year-to-date Change: -11.9% | |
| TTWO Links: Profile News Message Board | |
| Charts:- Daily , Weekly | |
| Add TTWO to Watchlist: View: Get TTWO Trend Analysis ➞ | |
 | LDOS Leidos Holdings, Inc. |
| Sector: Technology | |
| SubSector: Information Technology Services | |
| MarketCap: 11707.5 Millions | |
| Recent Price: 129.42 Smart Investing & Trading Score: 83 | |
| Day Percent Change: 0.40% Day Change: 0.52 | |
| Week Change: 3.61% Year-to-date Change: 19.6% | |
| LDOS Links: Profile News Message Board | |
| Charts:- Daily , Weekly | |
| Add LDOS to Watchlist: View: Get LDOS Trend Analysis ➞ | |
 | EPAM EPAM Systems, Inc. |
| Sector: Technology | |
| SubSector: Information Technology Services | |
| MarketCap: 11519.6 Millions | |
| Recent Price: 237.29 Smart Investing & Trading Score: 18 | |
| Day Percent Change: -3.15% Day Change: -7.71 | |
| Week Change: -3.52% Year-to-date Change: -20.2% | |
| EPAM Links: Profile News Message Board | |
| Charts:- Daily , Weekly | |
| Add EPAM to Watchlist: View: Get EPAM Trend Analysis ➞ | |
 | ZBRA Zebra Technologies Corporation |
| Sector: Technology | |
| SubSector: Communication Equipment | |
| MarketCap: 11474.9 Millions | |
| Recent Price: 279.48 Smart Investing & Trading Score: 68 | |
| Day Percent Change: 0.70% Day Change: 1.95 | |
| Week Change: 4.26% Year-to-date Change: 2.3% | |
| ZBRA Links: Profile News Message Board | |
| Charts:- Daily , Weekly | |
| Add ZBRA to Watchlist: View: Get ZBRA Trend Analysis ➞ | |
 | STX Seagate Technology plc |
| Sector: Technology | |
| SubSector: Data Storage Devices | |
| MarketCap: 10814.7 Millions | |
| Recent Price: 86.64 Smart Investing & Trading Score: 38 | |
| Day Percent Change: -0.54% Day Change: -0.47 | |
| Week Change: 5.07% Year-to-date Change: 1.5% | |
| STX Links: Profile News Message Board | |
| Charts:- Daily , Weekly | |
| Add STX to Watchlist: View: Get STX Trend Analysis ➞ | |
 | TYL Tyler Technologies, Inc. |
| Sector: Technology | |
| SubSector: Technical & System Software | |
| MarketCap: 10785 Millions | |
| Recent Price: 445.16 Smart Investing & Trading Score: 64 | |
| Day Percent Change: 6.24% Day Change: 26.16 | |
| Week Change: 10.37% Year-to-date Change: 6.5% | |
| TYL Links: Profile News Message Board | |
| Charts:- Daily , Weekly | |
| Add TYL to Watchlist: View: Get TYL Trend Analysis ➞ | |
 | WDC Western Digital Corporation |
| Sector: Technology | |
| SubSector: Data Storage Devices | |
| MarketCap: 10712.9 Millions | |
| Recent Price: 68.55 Smart Investing & Trading Score: 44 | |
| Day Percent Change: -1.45% Day Change: -1.00 | |
| Week Change: 3.78% Year-to-date Change: 30.9% | |
| WDC Links: Profile News Message Board | |
| Charts:- Daily , Weekly | |
| Add WDC to Watchlist: View: Get WDC Trend Analysis ➞ | |
 | JKHY Jack Henry & Associates, Inc. |
| Sector: Technology | |
| SubSector: Information Technology Services | |
| MarketCap: 10695.4 Millions | |
| Recent Price: 165.69 Smart Investing & Trading Score: 41 | |
| Day Percent Change: 0.30% Day Change: 0.50 | |
| Week Change: 0.06% Year-to-date Change: 1.4% | |
| JKHY Links: Profile News Message Board | |
| Charts:- Daily , Weekly | |
| Add JKHY to Watchlist: View: Get JKHY Trend Analysis ➞ | |
 | BR Broadridge Financial Solutions, Inc. |
| Sector: Technology | |
| SubSector: Information Technology Services | |
| MarketCap: 10633.8 Millions | |
| Recent Price: 194.32 Smart Investing & Trading Score: 25 | |
| Day Percent Change: -0.39% Day Change: -0.77 | |
| Week Change: 0.48% Year-to-date Change: -5.6% | |
| BR Links: Profile News Message Board | |
| Charts:- Daily , Weekly | |
| Add BR to Watchlist: View: Get BR Trend Analysis ➞ | |
 | QRVO Qorvo, Inc. |
| Sector: Technology | |
| SubSector: Semiconductor - Broad Line | |
| MarketCap: 9524.32 Millions | |
| Recent Price: 113.14 Smart Investing & Trading Score: 85 | |
| Day Percent Change: 0.88% Day Change: 0.99 | |
| Week Change: 7.88% Year-to-date Change: 0.5% | |
| QRVO Links: Profile News Message Board | |
| Charts:- Daily , Weekly | |
| Add QRVO to Watchlist: View: Get QRVO Trend Analysis ➞ | |
 | TDY Teledyne Technologies Incorporated |
| Sector: Technology | |
| SubSector: Scientific & Technical Instruments | |
| MarketCap: 9360.43 Millions | |
| Recent Price: 368.81 Smart Investing & Trading Score: 0 | |
| Day Percent Change: 1.74% Day Change: 6.31 | |
| Week Change: -8.11% Year-to-date Change: -17.4% | |
| TDY Links: Profile News Message Board | |
| Charts:- Daily , Weekly | |
| Add TDY to Watchlist: View: Get TDY Trend Analysis ➞ | |
 | NTAP NetApp, Inc. |
| Sector: Technology | |
| SubSector: Data Storage Devices | |
| MarketCap: 9028.89 Millions | |
| Recent Price: 99.94 Smart Investing & Trading Score: 63 | |
| Day Percent Change: -0.11% Day Change: -0.12 | |
| Week Change: 2.04% Year-to-date Change: 13.4% | |
| NTAP Links: Profile News Message Board | |
| Charts:- Daily , Weekly | |
| Add NTAP to Watchlist: View: Get NTAP Trend Analysis ➞ | |
| For tabular summary view of above stock list: Summary View ➞ 0 - 25 , 25 - 50 , 50 - 75 , 75 - 100 | ||
| Click To Change The Sort Order: By Market Cap or Company Size Performance: Year-to-date, Week and Day | |
| Select Chart Type: | ||
|
Best Stocks Today 12Stocks.com |
© 2024 12Stocks.com Terms & Conditions Privacy Contact Us
All Information Provided Only For Education And Not To Be Used For Investing or Trading. See Terms & Conditions


One More Thing ... Get Best Stocks Delivered Daily!
Never Ever Miss A Move With Our Top Ten Stocks Lists
Find Best Stocks In Any Market - Bull or Bear Market
Take A Peek At Our Top Ten Stocks Lists: Daily, Weekly, Year-to-Date & Top Trends
Find Best Stocks In Any Market - Bull or Bear Market
Take A Peek At Our Top Ten Stocks Lists: Daily, Weekly, Year-to-Date & Top Trends
S&P 500 Stocks With Best Up Trends [0-bearish to 100-bullish]: Newmont [100], Dover [100], Chipotle Mexican[100], Merck [100], Northrop Grumman[100], EQT [100], Boston Scientific[100], Coca-Cola [100], Altria [100], Hess [100], Campbell Soup[100]
Best S&P 500 Stocks Year-to-Date:
NVIDIA [65.24%], Constellation [60.24%], NRG [39.81%], Targa Resources[34.22%], Marathon [33.86%], Chipotle Mexican[32.43%], Diamondback [32.2%], Progressive [31.71%], Eaton [30.97%], Western Digital[30.89%], Micron [30.34%] Best S&P 500 Stocks This Week:
Hasbro [17.46%], Globe Life[14.66%], Tesla [13.26%], Wabtec [12.29%], Teradyne [12.18%], Microchip [10.53%], Tyler Technologies[10.37%], Monolithic Power[10.19%], NXP Semiconductors[9.67%], ON Semiconductor[8.85%], Boston Scientific[8.79%] Best S&P 500 Stocks Daily:
Newmont [8.50%], Carrier Global[7.19%], Teradyne [6.91%], Tyler Technologies[6.24%], Dover [4.35%], ProShares UltraPro[4.05%], Keurig Dr[3.77%], United Rentals[3.69%], Union Pacific[3.50%], Chipotle Mexican[3.48%], Rollins [3.34%]