
 Login Sign Up


| |||||
 |  | ||||

| 12Stocks.com Market Intelligence |
Best S&P 500 Stocks
|
On this page, you will find the most comprehensive analysis of S&P 500 stocks and ETFs - from latest trends to performances to charts ➞. First, here are the year-to-date (YTD) performances of the most requested S&P 500 stocks at 12Stocks.com (click stock for review):
| Intel Corp 84% | ||
| Caterpillar Inc 38% | ||
| Goldman Sachs 37% | ||
| NVIDIA Corp 37% | ||
| Johnson & Johnson 31% | ||
| JPMorgan Chase 30% | ||
| Google Inc 30% | ||
| Boeing Co 27% | ||
| Microsoft 24% | ||
| Gilead 22% | ||
| Walmart Inc 13% | ||
| Chevron Corp 7% | ||
| Apple Inc 6% | ||
| McDonald's Corp 4% | ||
| Amazon.com Inc 1% | ||
| Starbucks Corp -5% | ||
| Merck & Co Inc -8% | ||
| Quick: S&P 500 Stocks Lists: Performances & Trends, S&P 500 Stock Charts
Sort S&P 500 stocks: Daily, Weekly, Year-to-Date, Market Cap & Trends. Filter S&P 500 stocks list by sector: Show all, Tech, Finance, Energy, Staples, Retail, Industrial, Materials, Utilities and HealthCare |
| 12Stocks.com S&P 500 Stocks Performances & Trends Daily Report | |||||||||
|
| 
The overall Smart Investing & Trading Score is 90 (0-bearish to 100-bullish) which puts S&P 500 index in short term bullish trend. The Smart Investing & Trading Score from previous trading session is 80 and an improvement of trend continues. | ||||||||
Here are the Smart Investing & Trading Scores of the most requested S&P 500 stocks at 12Stocks.com (click stock name for detailed review):
|


| 12Stocks.com: Top Performing S&P 500 Index Stocks | ||||||||||||||||||||||||||||||||||||||||||||||||
 The top performing S&P 500 Index stocks year to date are
Now, more recently, over last week, the top performing S&P 500 Index stocks on the move are


|
||||||||||||||||||||||||||||||||||||||||||||||||
| 12Stocks.com: Investing in S&P 500 Index with Stocks | |
|
The following table helps investors and traders sort through current performance and trends (as measured by Smart Investing & Trading Score) of various
stocks in the S&P 500 Index. Quick View: Move mouse or cursor over stock symbol (ticker) to view short-term technical chart and over stock name to view long term chart. Click on  to add stock symbol to your watchlist and to add stock symbol to your watchlist and  to view watchlist. Click on any ticker or stock name for detailed market intelligence report for that stock. to view watchlist. Click on any ticker or stock name for detailed market intelligence report for that stock. |
12Stocks.com Performance of Stocks in S&P 500 Index
| Ticker | Stock Name | Watchlist | Category | Recent Price | Smart Investing & Trading Score | Change % | YTD Change% |
| GE | GE Aerospace |   | Industrials | 299.45 | 70 | -0.48% | 78.21% |
| CAT | Caterpillar Inc | | Industrials | 490.57 | 100 | 2.03% | 38.04% |
| BA | Boeing Co | | Industrials | 217.43 | 60 | 1.04% | 26.51% |
| HON | Honeywell | | Industrials | 210.96 | 60 | 0.37% | -5.47% |
| ETN | Eaton | | Industrials | 376.76 | 80 | 0.78% | 14.64% |
| UNP | Union Pacific | | Industrials | 234.52 | 60 | -0.09% | 3.54% |
| DE | Deere & Co | | Industrials | 461.82 | 40 | 2.23% | 11.17% |
| LMT | Lockheed Martin | | Industrials | 499.36 | 90 | 0.07% | 5.03% |
| PH | Parker-Hannifin Corp | | Industrials | 758.14 | 60 | 0.39% | 21.06% |
| TT | Trane Technologies | | Industrials | 424.44 | 0 | -0.23% | 17.33% |
| WM | Waste Management | | Industrials | 216.91 | 20 | -1.35% | 8.94% |
| GD | General Dynamics | | Industrials | 341.05 | 100 | 0.09% | 32.77% |
| NOC | Northrop Grumman | | Industrials | 605.01 | 100 | -0.07% | 30.47% |
| MMM | 3M Co | | Industrials | 158.80 | 90 | 1.79% | 23.64% |
| CTAS | Cintas | | Industrials | 202.89 | 50 | -0.37% | 11.84% |
| ITW | Illinois Tool | | Industrials | 260.73 | 60 | 0.31% | 5.56% |
| EMR | Emerson Electric | | Industrials | 133.05 | 50 | 1.42% | 9.84% |
| UPS | United Parcel | | Industrials | 85.57 | 80 | 1.41% | -28.78% |
| RSG | Republic Services | | Industrials | 222.57 | 0 | -2.08% | 11.77% |
| TDG | Transdigm | | Industrials | 1283.81 | 40 | -1.31% | 2.37% |
| JCI | Johnson Controls | | Industrials | 108.66 | 40 | -0.21% | 38.75% |
| URI | United Rentals | | Industrials | 978.22 | 90 | 1.59% | 42.50% |
| NSC | Norfolk Southern | | Industrials | 298.30 | 80 | -0.13% | 29.25% |
| CSX | CSX Corp | | Industrials | 35.58 | 70 | 1.64% | 11.53% |
| AXON | Axon Enterprise | | Industrials | 720.20 | 40 | 1.25% | 20.74% |
| For chart view version of above stock list: Chart View ➞ 0 - 25 , 25 - 50 , 50 - 75 | ||
 | Click To Change The Sort Order: By Market Cap or Company Size Performance: Year-to-date, Week and Day |  |
|
Get the most comprehensive stock market coverage daily at 12Stocks.com ➞ Best Stocks Today ➞ Best Stocks Weekly ➞ Best Stocks Year-to-Date ➞ Best Stocks Trends ➞  Best Stocks Today 12Stocks.com Best Nasdaq Stocks ➞ Best S&P 500 Stocks ➞ Best Tech Stocks ➞ Best Biotech Stocks ➞ |
| Detailed Overview of S&P 500 Stocks |
| S&P 500 Technical Overview, Leaders & Laggards, Top S&P 500 ETF Funds & Detailed S&P 500 Stocks List, Charts, Trends & More |
| S&P 500: Technical Analysis, Trends & YTD Performance | |
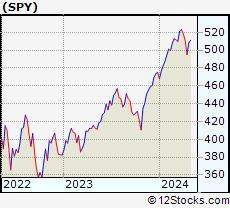
| S&P 500 index as represented by
SPY, an exchange-traded fund [ETF], holds basket of five hundred (mostly largecap) stocks from across all major sectors of the US stock market. The S&P 500 index (contains stocks like Apple and Exxon) is up by 15.1527% and is currently outperforming the overall market by 0.3948% year-to-date. Below is a quick view of technical charts and trends: | |
 SPY Weekly Chart |
|
| Long Term Trend: Very Good | |
| Medium Term Trend: Good | |
 SPY Daily Chart |
|
| Short Term Trend: Very Good | |
| Overall Trend Score: 90 | |
| YTD Performance: 15.1527% | |
| **Trend Scores & Views Are Only For Educational Purposes And Not For Investing | |
| 12Stocks.com: Investing in S&P 500 Index using Exchange Traded Funds | |
|
The following table shows list of key exchange traded funds (ETF) that
help investors track S&P 500 index. The following list also includes leveraged ETF funds that track twice or thrice the daily returns of S&P 500 indices. Short or inverse ETF funds move in the opposite direction to the index they track and are useful during market pullbacks or during bear markets. Quick View: Move mouse or cursor over ETF symbol (ticker) to view short-term technical chart and over ETF name to view long term chart. Click on ticker or stock name for detailed view. Click on to add stock symbol to your watchlist and to view watchlist. |
12Stocks.com List of ETFs that track S&P 500 Index
| Ticker | ETF Name | Watchlist | Recent Price | Smart Investing & Trading Score | Change % | Week % | Year-to-date % |
| SPY | SPDR S&P 500 ETF Trust | | 669.22 | 90 | 0.115192 | 1.22826 | 15.1527% |
| IVV | iShares Core S&P 500 ETF | | 672.50 | 90 | 0.0982377 | 1.24048 | 15.1922% |
| VOO | Vanguard S&P 500 ETF | | 615.25 | 90 | 0.107389 | 0.943396 | 15.2251% |
| OEF | iShares S&P 100 ETF | | 334.28 | 90 | 0.00598337 | 1.05505 | 16.5396% |
| SSO | ProShares Ultra S&P500 2x Shares | | 113.12 | 90 | 0.177117 | 2.334 | 23.4297% |
| UPRO | ProShares UltraPro S&P 500 ETF 3x Shares | | 113.01 | 90 | 0.275067 | 3.45112 | 29.2069% |
| SPXL | Direxion Daily S&P 500 Bull 3X Shares | | 214.76 | 90 | 0.28953 | 3.47386 | 29.2396% |
| SH | ProShares Short S&P500 -1x Shares | | 36.80 | 10 | -0.0543183 | -1.07527 | -11.8852% |
| SDS | ProShares UltraShort S&P500 -2x Shares | | 14.33 | 10 | -0.139373 | -2.1843 | -25.9516% |
| SPXU | ProShares UltraPro Short S&P 500 | | 13.34 | 10 | -0.224383 | -3.26323 | -40.0301% |
| SPXS | Direxion Daily S&P 500 Bear -3X Shares | | 37.50 | 70 | -0.239425 | 868.992 | 503.962% |
| 12Stocks.com: Charts, Trends, Fundamental Data and Performances of S&P 500 Stocks | |
|
We now take in-depth look at all S&P 500 stocks including charts, multi-period performances and overall trends (as measured by Smart Investing & Trading Score). One can sort S&P 500 stocks (click link to choose) by Daily, Weekly and by Year-to-Date performances. Also, one can sort by size of the company or by market capitalization. |
| Select Your Default Chart Type: | |||||
| |||||
| Click on stock symbol or name for detailed view. Click on to add stock symbol to your watchlist and to view watchlist. Quick View: Move mouse or cursor over "Daily" to quickly view daily technical stock chart and over "Weekly" to view weekly technical stock chart. | |||||

 | GE GE Aerospace |
| Sector: Industrials | |
| SubSector: Aerospace & Defense | |
| MarketCap: 296106 Millions | |
| Recent Price: 299.45 Smart Investing & Trading Score: 70 | |
| Day Percent Change: -0.475273% Day Change: -1.7 | |
| Week Change: -0.28305% Year-to-date Change: 78.2% | |
| GE Links: Profile News Message Board | |
| Charts:- Daily , Weekly | |
| Add GE to Watchlist: View: Get GE Trend Analysis ➞ | |
 | CAT Caterpillar Inc |
| Sector: Industrials | |
| SubSector: Farm & Heavy Construction Machinery | |
| MarketCap: 198204 Millions | |
| Recent Price: 490.57 Smart Investing & Trading Score: 100 | |
| Day Percent Change: 2.02779% Day Change: 10.38 | |
| Week Change: 4.42325% Year-to-date Change: 38.0% | |
| CAT Links: Profile News Message Board | |
| Charts:- Daily , Weekly | |
| Add CAT to Watchlist: View: Get CAT Trend Analysis ➞ | |
 | BA Boeing Co |
| Sector: Industrials | |
| SubSector: Aerospace & Defense | |
| MarketCap: 173621 Millions | |
| Recent Price: 217.43 Smart Investing & Trading Score: 60 | |
| Day Percent Change: 1.03625% Day Change: 2.92 | |
| Week Change: 1.08322% Year-to-date Change: 26.5% | |
| BA Links: Profile News Message Board | |
| Charts:- Daily , Weekly | |
| Add BA to Watchlist: View: Get BA Trend Analysis ➞ | |
 | HON Honeywell International Inc |
| Sector: Industrials | |
| SubSector: Conglomerates | |
| MarketCap: 136027 Millions | |
| Recent Price: 210.96 Smart Investing & Trading Score: 60 | |
| Day Percent Change: 0.37111% Day Change: 1.73 | |
| Week Change: 1.13135% Year-to-date Change: -5.5% | |
| HON Links: Profile News Message Board | |
| Charts:- Daily , Weekly | |
| Add HON to Watchlist: View: Get HON Trend Analysis ➞ | |
 | ETN Eaton Corporation plc |
| Sector: Industrials | |
| SubSector: Specialty Industrial Machinery | |
| MarketCap: 135877 Millions | |
| Recent Price: 376.76 Smart Investing & Trading Score: 80 | |
| Day Percent Change: 0.781083% Day Change: 2.88 | |
| Week Change: 1.22243% Year-to-date Change: 14.6% | |
| ETN Links: Profile News Message Board | |
| Charts:- Daily , Weekly | |
| Add ETN to Watchlist: View: Get ETN Trend Analysis ➞ | |
 | UNP Union Pacific Corp |
| Sector: Industrials | |
| SubSector: Railroads | |
| MarketCap: 130653 Millions | |
| Recent Price: 234.52 Smart Investing & Trading Score: 60 | |
| Day Percent Change: -0.0937207% Day Change: -0.43 | |
| Week Change: 1.80587% Year-to-date Change: 3.5% | |
| UNP Links: Profile News Message Board | |
| Charts:- Daily , Weekly | |
| Add UNP to Watchlist: View: Get UNP Trend Analysis ➞ | |
 | DE Deere & Co |
| Sector: Industrials | |
| SubSector: Farm & Heavy Construction Machinery | |
| MarketCap: 127936 Millions | |
| Recent Price: 461.82 Smart Investing & Trading Score: 40 | |
| Day Percent Change: 2.23364% Day Change: 9.22 | |
| Week Change: -1.51832% Year-to-date Change: 11.2% | |
| DE Links: Profile News Message Board | |
| Charts:- Daily , Weekly | |
| Add DE to Watchlist: View: Get DE Trend Analysis ➞ | |
 | LMT Lockheed Martin Corp |
| Sector: Industrials | |
| SubSector: Aerospace & Defense | |
| MarketCap: 108304 Millions | |
| Recent Price: 499.36 Smart Investing & Trading Score: 90 | |
| Day Percent Change: 0.0721443% Day Change: 0.79 | |
| Week Change: 2.69614% Year-to-date Change: 5.0% | |
| LMT Links: Profile News Message Board | |
| Charts:- Daily , Weekly | |
| Add LMT to Watchlist: View: Get LMT Trend Analysis ➞ | |
 | PH Parker-Hannifin Corp |
| Sector: Industrials | |
| SubSector: Specialty Industrial Machinery | |
| MarketCap: 96096 Millions | |
| Recent Price: 758.14 Smart Investing & Trading Score: 60 | |
| Day Percent Change: 0.386642% Day Change: 3.98 | |
| Week Change: 1.25274% Year-to-date Change: 21.1% | |
| PH Links: Profile News Message Board | |
| Charts:- Daily , Weekly | |
| Add PH to Watchlist: View: Get PH Trend Analysis ➞ | |
 | TT Trane Technologies plc |
| Sector: Industrials | |
| SubSector: Building Products & Equipment | |
| MarketCap: 92083.5 Millions | |
| Recent Price: 424.44 Smart Investing & Trading Score: 0 | |
| Day Percent Change: -0.23% Day Change: -0.97 | |
| Week Change: 2.22% Year-to-date Change: 17.3% | |
| TT Links: Profile News Message Board | |
| Charts:- Daily , Weekly | |
| Add TT to Watchlist: View: Get TT Trend Analysis ➞ | |
 | WM Waste Management, Inc |
| Sector: Industrials | |
| SubSector: Waste Management | |
| MarketCap: 88646.8 Millions | |
| Recent Price: 216.91 Smart Investing & Trading Score: 20 | |
| Day Percent Change: -1.34625% Day Change: -2.43 | |
| Week Change: -1.14392% Year-to-date Change: 8.9% | |
| WM Links: Profile News Message Board | |
| Charts:- Daily , Weekly | |
| Add WM to Watchlist: View: Get WM Trend Analysis ➞ | |
 | GD General Dynamics Corp |
| Sector: Industrials | |
| SubSector: Aerospace & Defense | |
| MarketCap: 86847.2 Millions | |
| Recent Price: 341.05 Smart Investing & Trading Score: 100 | |
| Day Percent Change: 0.0880411% Day Change: 0.3 | |
| Week Change: 5.38595% Year-to-date Change: 32.8% | |
| GD Links: Profile News Message Board | |
| Charts:- Daily , Weekly | |
| Add GD to Watchlist: View: Get GD Trend Analysis ➞ | |
 | NOC Northrop Grumman Corp |
| Sector: Industrials | |
| SubSector: Aerospace & Defense | |
| MarketCap: 83160.7 Millions | |
| Recent Price: 605.01 Smart Investing & Trading Score: 100 | |
| Day Percent Change: -0.0677216% Day Change: -0.19 | |
| Week Change: 3.19648% Year-to-date Change: 30.5% | |
| NOC Links: Profile News Message Board | |
| Charts:- Daily , Weekly | |
| Add NOC to Watchlist: View: Get NOC Trend Analysis ➞ | |
 | MMM 3M Co |
| Sector: Industrials | |
| SubSector: Conglomerates | |
| MarketCap: 82717.4 Millions | |
| Recent Price: 158.80 Smart Investing & Trading Score: 90 | |
| Day Percent Change: 1.79487% Day Change: 2.66 | |
| Week Change: 2.71669% Year-to-date Change: 23.6% | |
| MMM Links: Profile News Message Board | |
| Charts:- Daily , Weekly | |
| Add MMM to Watchlist: View: Get MMM Trend Analysis ➞ | |
 | CTAS Cintas Corporation |
| Sector: Industrials | |
| SubSector: Specialty Business Services | |
| MarketCap: 82409 Millions | |
| Recent Price: 202.89 Smart Investing & Trading Score: 50 | |
| Day Percent Change: -0.368297% Day Change: -0.88 | |
| Week Change: 1.42472% Year-to-date Change: 11.8% | |
| CTAS Links: Profile News Message Board | |
| Charts:- Daily , Weekly | |
| Add CTAS to Watchlist: View: Get CTAS Trend Analysis ➞ | |
 | ITW Illinois Tool Works, Inc |
| Sector: Industrials | |
| SubSector: Specialty Industrial Machinery | |
| MarketCap: 77609 Millions | |
| Recent Price: 260.73 Smart Investing & Trading Score: 60 | |
| Day Percent Change: 0.311634% Day Change: 1.31 | |
| Week Change: 0.450763% Year-to-date Change: 5.6% | |
| ITW Links: Profile News Message Board | |
| Charts:- Daily , Weekly | |
| Add ITW to Watchlist: View: Get ITW Trend Analysis ➞ | |
 | EMR Emerson Electric Co |
| Sector: Industrials | |
| SubSector: Specialty Industrial Machinery | |
| MarketCap: 74599.1 Millions | |
| Recent Price: 133.05 Smart Investing & Trading Score: 50 | |
| Day Percent Change: 1.41779% Day Change: 1.82 | |
| Week Change: 0.85658% Year-to-date Change: 9.8% | |
| EMR Links: Profile News Message Board | |
| Charts:- Daily , Weekly | |
| Add EMR to Watchlist: View: Get EMR Trend Analysis ➞ | |
 | UPS United Parcel Service, Inc |
| Sector: Industrials | |
| SubSector: Integrated Freight & Logistics | |
| MarketCap: 72077.3 Millions | |
| Recent Price: 85.57 Smart Investing & Trading Score: 80 | |
| Day Percent Change: 1.41029% Day Change: 1.58 | |
| Week Change: 1.99046% Year-to-date Change: -28.8% | |
| UPS Links: Profile News Message Board | |
| Charts:- Daily , Weekly | |
| Add UPS to Watchlist: View: Get UPS Trend Analysis ➞ | |
 | RSG Republic Services, Inc |
| Sector: Industrials | |
| SubSector: Waste Management | |
| MarketCap: 71725.3 Millions | |
| Recent Price: 222.57 Smart Investing & Trading Score: 0 | |
| Day Percent Change: -2.07664% Day Change: -4.61 | |
| Week Change: -2.12401% Year-to-date Change: 11.8% | |
| RSG Links: Profile News Message Board | |
| Charts:- Daily , Weekly | |
| Add RSG to Watchlist: View: Get RSG Trend Analysis ➞ | |
 | TDG Transdigm Group Incorporated |
| Sector: Industrials | |
| SubSector: Aerospace & Defense | |
| MarketCap: 71623.5 Millions | |
| Recent Price: 1283.81 Smart Investing & Trading Score: 40 | |
| Day Percent Change: -1.30612% Day Change: -13.54 | |
| Week Change: -1.24538% Year-to-date Change: 2.4% | |
| TDG Links: Profile News Message Board | |
| Charts:- Daily , Weekly | |
| Add TDG to Watchlist: View: Get TDG Trend Analysis ➞ | |
 | JCI Johnson Controls International plc |
| Sector: Industrials | |
| SubSector: Building Products & Equipment | |
| MarketCap: 69515.4 Millions | |
| Recent Price: 108.66 Smart Investing & Trading Score: 40 | |
| Day Percent Change: -0.211222% Day Change: -0.62 | |
| Week Change: 1.98986% Year-to-date Change: 38.8% | |
| JCI Links: Profile News Message Board | |
| Charts:- Daily , Weekly | |
| Add JCI to Watchlist: View: Get JCI Trend Analysis ➞ | |
 | URI United Rentals, Inc |
| Sector: Industrials | |
| SubSector: Rental & Leasing Services | |
| MarketCap: 62747.5 Millions | |
| Recent Price: 978.22 Smart Investing & Trading Score: 90 | |
| Day Percent Change: 1.58892% Day Change: 6.81 | |
| Week Change: 4.53525% Year-to-date Change: 42.5% | |
| URI Links: Profile News Message Board | |
| Charts:- Daily , Weekly | |
| Add URI to Watchlist: View: Get URI Trend Analysis ➞ | |
 | NSC Norfolk Southern Corp |
| Sector: Industrials | |
| SubSector: Railroads | |
| MarketCap: 62314.4 Millions | |
| Recent Price: 298.30 Smart Investing & Trading Score: 80 | |
| Day Percent Change: -0.127226% Day Change: -0.22 | |
| Week Change: 1.6978% Year-to-date Change: 29.2% | |
| NSC Links: Profile News Message Board | |
| Charts:- Daily , Weekly | |
| Add NSC to Watchlist: View: Get NSC Trend Analysis ➞ | |
 | CSX CSX Corp |
| Sector: Industrials | |
| SubSector: Railroads | |
| MarketCap: 60644.9 Millions | |
| Recent Price: 35.58 Smart Investing & Trading Score: 70 | |
| Day Percent Change: 1.64286% Day Change: 0.4 | |
| Week Change: 5.18924% Year-to-date Change: 11.5% | |
| CSX Links: Profile News Message Board | |
| Charts:- Daily , Weekly | |
| Add CSX to Watchlist: View: Get CSX Trend Analysis ➞ | |
 | AXON Axon Enterprise Inc |
| Sector: Industrials | |
| SubSector: Aerospace & Defense | |
| MarketCap: 57183.4 Millions | |
| Recent Price: 720.20 Smart Investing & Trading Score: 40 | |
| Day Percent Change: 1.24554% Day Change: 8.69 | |
| Week Change: 3.17756% Year-to-date Change: 20.7% | |
| AXON Links: Profile News Message Board | |
| Charts:- Daily , Weekly | |
| Add AXON to Watchlist: View: Get AXON Trend Analysis ➞ | |
| For tabular summary view of above stock list: Summary View ➞ 0 - 25 , 25 - 50 , 50 - 75 | ||
| Click To Change The Sort Order: By Market Cap or Company Size Performance: Year-to-date, Week and Day | |
| Select Chart Type: | ||
|
Best Stocks Today 12Stocks.com |
© 2025 12Stocks.com Terms & Conditions Privacy Contact Us
All Information Provided Only For Education And Not To Be Used For Investing or Trading. See Terms & Conditions


One More Thing ... Get Best Stocks Delivered Daily!
Never Ever Miss A Move With Our Top Ten Stocks Lists
Find Best Stocks In Any Market - Bull or Bear Market
Take A Peek At Our Top Ten Stocks Lists: Daily, Weekly, Year-to-Date & Top Trends
Find Best Stocks In Any Market - Bull or Bear Market
Take A Peek At Our Top Ten Stocks Lists: Daily, Weekly, Year-to-Date & Top Trends
S&P 500 Stocks With Best Up Trends [0-bearish to 100-bullish]: Fair Isaac[100], Intel Corp[100], Bio-Techne Corp[100], DuPont de[100], First Solar[100], Centene Corp[100], Lam Research[100], Charles River[100], Applied Materials[100], Steel Dynamics[100], Teradyne Inc[100]
Best S&P 500 Stocks Year-to-Date:
Seagate [198.865%], Western Digital[181.204%], Newmont Corp[127.671%], Micron [110.87%], Lam Research[103.976%], Intel Corp[84.4708%], Warner Bros.[84.2%], NRG [82.3658%], CVS Health[81.156%], Amphenol Corp[79.8571%], KLA Corp[79.7904%] Best S&P 500 Stocks This Week:
Pioneer Natural[108.1%], Bio-Techne Corp[21.2222%], Electronic Arts[20.1076%], Western Digital[19.6645%], Intel Corp[19.4747%], Charles River[17.3369%], Fair Isaac[15.6495%], Lamb Weston[15.5663%], Lam Research[14.5184%], Seagate [13.8757%], Micron [13.6232%] Best S&P 500 Stocks Daily:
Fair Isaac[17.979%], Celanese Corp[6.98937%], Humana Inc[3.99157%], CF Industries[3.94539%], Eastman Chemical[3.88961%], Intel Corp[3.78408%], Albemarle Corp[3.7173%], Caesars Entertainment[3.66089%], Bio-Techne Corp[3.6215%], DuPont de[3.54129%], Advanced Micro[3.48759%]