
 Login Sign Up


| |||||
 |  | ||||

| 12Stocks.com Market Intelligence |
Best S&P 500 Stocks
|
On this page, you will find the most comprehensive analysis of S&P 500 stocks and ETFs - from latest trends to performances to charts ➞. First, here are the year-to-date (YTD) performances of the most requested S&P 500 stocks at 12Stocks.com (click stock for review):
| Intel Corp 84% | ||
| Caterpillar Inc 38% | ||
| Goldman Sachs 37% | ||
| NVIDIA Corp 37% | ||
| Johnson & Johnson 31% | ||
| JPMorgan Chase 30% | ||
| Google Inc 30% | ||
| Boeing Co 27% | ||
| Microsoft 24% | ||
| Gilead 22% | ||
| Walmart Inc 13% | ||
| Chevron Corp 7% | ||
| Apple Inc 6% | ||
| McDonald's Corp 4% | ||
| Amazon.com Inc 1% | ||
| Starbucks Corp -5% | ||
| Merck & Co Inc -8% | ||
| Quick: S&P 500 Stocks Lists: Performances & Trends, S&P 500 Stock Charts
Sort S&P 500 stocks: Daily, Weekly, Year-to-Date, Market Cap & Trends. Filter S&P 500 stocks list by sector: Show all, Tech, Finance, Energy, Staples, Retail, Industrial, Materials, Utilities and HealthCare |
| 12Stocks.com S&P 500 Stocks Performances & Trends Daily Report | |||||||||
|
| 
The overall Smart Investing & Trading Score is 90 (0-bearish to 100-bullish) which puts S&P 500 index in short term bullish trend. The Smart Investing & Trading Score from previous trading session is 80 and an improvement of trend continues. | ||||||||
Here are the Smart Investing & Trading Scores of the most requested S&P 500 stocks at 12Stocks.com (click stock name for detailed review):
|


| 12Stocks.com: Top Performing S&P 500 Index Stocks | ||||||||||||||||||||||||||||||||||||||||||||||||
 The top performing S&P 500 Index stocks year to date are
Now, more recently, over last week, the top performing S&P 500 Index stocks on the move are


|
||||||||||||||||||||||||||||||||||||||||||||||||
| 12Stocks.com: Investing in S&P 500 Index with Stocks | |
|
The following table helps investors and traders sort through current performance and trends (as measured by Smart Investing & Trading Score) of various
stocks in the S&P 500 Index. Quick View: Move mouse or cursor over stock symbol (ticker) to view short-term technical chart and over stock name to view long term chart. Click on  to add stock symbol to your watchlist and to add stock symbol to your watchlist and  to view watchlist. Click on any ticker or stock name for detailed market intelligence report for that stock. to view watchlist. Click on any ticker or stock name for detailed market intelligence report for that stock. |
12Stocks.com Performance of Stocks in S&P 500 Index
| Ticker | Stock Name | Watchlist | Category | Recent Price | Smart Investing & Trading Score | Change % | YTD Change% |
| FICO | Fair Isaac |   | Technology | 1784.68 | 100 | 17.98 | -10.58% |
| CE | Celanese Corp | | Materials | 45.31 | 70 | 6.99 | -33.66% |
| HUM | Humana Inc | | Health Care | 256.62 | 40 | 3.99 | 2.28% |
| CF | CF Industries | | Materials | 89.84 | 30 | 3.95 | 5.93% |
| EMN | Eastman Chemical | | Materials | 64.37 | 60 | 3.89 | -25.83% |
| INTC | Intel Corp | | Technology | 37.30 | 100 | 3.78 | 84.47% |
| ALB | Albemarle Corp | | Materials | 87.61 | 80 | 3.72 | 4.05% |
| CZR | Caesars Entertainment | | Services & Goods | 26.90 | 60 | 3.66 | -17.46% |
| TECH | Bio-Techne Corp | | Health Care | 62.09 | 100 | 3.62 | -12.89% |
| DD | DuPont de | | Materials | 80.99 | 100 | 3.54 | 8.56% |
| AMD | Advanced Micro | | Technology | 169.73 | 90 | 3.49 | 40.70% |
| PYPL | PayPal Holdings | | Financials | 68.93 | 70 | 3.41 | -20.02% |
| CMG | Chipotle Mexican | | Services & Goods | 40.27 | 60 | 3.34 | -32.76% |
| NRG | NRG | | Utilities | 167.30 | 70 | 3.33 | 82.37% |
| FSLR | First Solar | | Technology | 232.13 | 100 | 3.25 | 24.49% |
| MCHP | Microchip | | Technology | 66.13 | 70 | 3.15 | 18.04% |
| CNC | Centene Corp | | Health Care | 36.82 | 100 | 3.02 | -39.15% |
| EL | Estee Lauder | | Consumer Staples | 88.77 | 60 | 2.98 | 21.19% |
| CTVA | Corteva Inc | | Materials | 63.28 | 0 | 2.94 | 12.89% |
| LRCX | Lam Research | | Technology | 146.95 | 100 | 2.91 | 103.98% |
| AKAM | Akamai Technologies | | Technology | 78.03 | 90 | 2.89 | -18.22% |
| ETSY | Etsy Inc | | Services & Goods | 72.53 | 90 | 2.89 | 36.57% |
| CRL | Charles River | | Health Care | 175.36 | 100 | 2.86 | -3.99% |
| MRNA | Moderna Inc | | Health Care | 28.37 | 90 | 2.79 | -32.45% |
| DOW | Dow Inc | | Materials | 23.69 | 80 | 2.78 | -37.47% |
| For chart view version of above stock list: Chart View ➞ 0 - 25 , 25 - 50 , 50 - 75 , 75 - 100 , 100 - 125 , 125 - 150 , 150 - 175 , 175 - 200 , 200 - 225 , 225 - 250 , 250 - 275 , 275 - 300 , 300 - 325 , 325 - 350 , 350 - 375 , 375 - 400 , 400 - 425 , 425 - 450 , 450 - 475 , 475 - 500 | ||
 | Click To Change The Sort Order: By Market Cap or Company Size Performance: Year-to-date, Week and Day |  |
|
Get the most comprehensive stock market coverage daily at 12Stocks.com ➞ Best Stocks Today ➞ Best Stocks Weekly ➞ Best Stocks Year-to-Date ➞ Best Stocks Trends ➞  Best Stocks Today 12Stocks.com Best Nasdaq Stocks ➞ Best S&P 500 Stocks ➞ Best Tech Stocks ➞ Best Biotech Stocks ➞ |
| Detailed Overview of S&P 500 Stocks |
| S&P 500 Technical Overview, Leaders & Laggards, Top S&P 500 ETF Funds & Detailed S&P 500 Stocks List, Charts, Trends & More |
| S&P 500: Technical Analysis, Trends & YTD Performance | |
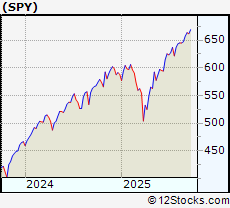
| S&P 500 index as represented by
SPY, an exchange-traded fund [ETF], holds basket of five hundred (mostly largecap) stocks from across all major sectors of the US stock market. The S&P 500 index (contains stocks like Apple and Exxon) is up by 15.1527% and is currently outperforming the overall market by 0.3948% year-to-date. Below is a quick view of technical charts and trends: | |
 SPY Weekly Chart |
|
| Long Term Trend: Very Good | |
| Medium Term Trend: Good | |
 SPY Daily Chart |
|
| Short Term Trend: Very Good | |
| Overall Trend Score: 90 | |
| YTD Performance: 15.1527% | |
| **Trend Scores & Views Are Only For Educational Purposes And Not For Investing | |
| 12Stocks.com: Investing in S&P 500 Index using Exchange Traded Funds | |
|
The following table shows list of key exchange traded funds (ETF) that
help investors track S&P 500 index. The following list also includes leveraged ETF funds that track twice or thrice the daily returns of S&P 500 indices. Short or inverse ETF funds move in the opposite direction to the index they track and are useful during market pullbacks or during bear markets. Quick View: Move mouse or cursor over ETF symbol (ticker) to view short-term technical chart and over ETF name to view long term chart. Click on ticker or stock name for detailed view. Click on to add stock symbol to your watchlist and to view watchlist. |
12Stocks.com List of ETFs that track S&P 500 Index
| Ticker | ETF Name | Watchlist | Recent Price | Smart Investing & Trading Score | Change % | Week % | Year-to-date % |
| SPY | SPDR S&P 500 ETF Trust | | 669.22 | 90 | 0.115192 | 1.22826 | 15.1527% |
| IVV | iShares Core S&P 500 ETF | | 672.50 | 90 | 0.0982377 | 1.24048 | 15.1922% |
| VOO | Vanguard S&P 500 ETF | | 615.25 | 90 | 0.107389 | 0.943396 | 15.2251% |
| OEF | iShares S&P 100 ETF | | 334.28 | 90 | 0.00598337 | 1.05505 | 16.5396% |
| SSO | ProShares Ultra S&P500 2x Shares | | 113.12 | 90 | 0.177117 | 2.334 | 23.4297% |
| UPRO | ProShares UltraPro S&P 500 ETF 3x Shares | | 113.01 | 90 | 0.275067 | 3.45112 | 29.2069% |
| SPXL | Direxion Daily S&P 500 Bull 3X Shares | | 214.76 | 90 | 0.28953 | 3.47386 | 29.2396% |
| SH | ProShares Short S&P500 -1x Shares | | 36.80 | 10 | -0.0543183 | -1.07527 | -11.8852% |
| SDS | ProShares UltraShort S&P500 -2x Shares | | 14.33 | 10 | -0.139373 | -2.1843 | -25.9516% |
| SPXU | ProShares UltraPro Short S&P 500 | | 13.34 | 10 | -0.224383 | -3.26323 | -40.0301% |
| SPXS | Direxion Daily S&P 500 Bear -3X Shares | | 37.50 | 70 | -0.239425 | 868.992 | 503.962% |
| 12Stocks.com: Charts, Trends, Fundamental Data and Performances of S&P 500 Stocks | |
|
We now take in-depth look at all S&P 500 stocks including charts, multi-period performances and overall trends (as measured by Smart Investing & Trading Score). One can sort S&P 500 stocks (click link to choose) by Daily, Weekly and by Year-to-Date performances. Also, one can sort by size of the company or by market capitalization. |
| Select Your Default Chart Type: | |||||
| |||||
| Click on stock symbol or name for detailed view. Click on to add stock symbol to your watchlist and to view watchlist. Quick View: Move mouse or cursor over "Daily" to quickly view daily technical stock chart and over "Weekly" to view weekly technical stock chart. | |||||

 | FICO Fair Isaac Corp |
| Sector: Technology | |
| SubSector: Software - Application | |
| MarketCap: 36773.4 Millions | |
| Recent Price: 1784.68 Smart Investing & Trading Score: 100 | |
| Day Percent Change: 17.979% Day Change: 314.59 | |
| Week Change: 15.6495% Year-to-date Change: -10.6% | |
| FICO Links: Profile News Message Board | |
| Charts:- Daily , Weekly | |
| Add FICO to Watchlist: View: Get FICO Trend Analysis ➞ | |
 | CE Celanese Corp |
| Sector: Materials | |
| SubSector: Chemicals | |
| MarketCap: 5336.12 Millions | |
| Recent Price: 45.31 Smart Investing & Trading Score: 70 | |
| Day Percent Change: 6.98937% Day Change: 2.73 | |
| Week Change: 6.91364% Year-to-date Change: -33.7% | |
| CE Links: Profile News Message Board | |
| Charts:- Daily , Weekly | |
| Add CE to Watchlist: View: Get CE Trend Analysis ➞ | |
 | HUM Humana Inc |
| Sector: Health Care | |
| SubSector: Healthcare Plans | |
| MarketCap: 37034.1 Millions | |
| Recent Price: 256.62 Smart Investing & Trading Score: 40 | |
| Day Percent Change: 3.99157% Day Change: 7.65 | |
| Week Change: -2.04222% Year-to-date Change: 2.3% | |
| HUM Links: Profile News Message Board | |
| Charts:- Daily , Weekly | |
| Add HUM to Watchlist: View: Get HUM Trend Analysis ➞ | |
 | CF CF Industries Holdings Inc |
| Sector: Materials | |
| SubSector: Agricultural Inputs | |
| MarketCap: 13683.5 Millions | |
| Recent Price: 89.84 Smart Investing & Trading Score: 30 | |
| Day Percent Change: 3.94539% Day Change: 3.36 | |
| Week Change: -1.9749% Year-to-date Change: 5.9% | |
| CF Links: Profile News Message Board | |
| Charts:- Daily , Weekly | |
| Add CF to Watchlist: View: Get CF Trend Analysis ➞ | |
 | EMN Eastman Chemical Co |
| Sector: Materials | |
| SubSector: Specialty Chemicals | |
| MarketCap: 7930.33 Millions | |
| Recent Price: 64.37 Smart Investing & Trading Score: 60 | |
| Day Percent Change: 3.88961% Day Change: 2.31 | |
| Week Change: 0.845997% Year-to-date Change: -25.8% | |
| EMN Links: Profile News Message Board | |
| Charts:- Daily , Weekly | |
| Add EMN to Watchlist: View: Get EMN Trend Analysis ➞ | |
 | INTC Intel Corp |
| Sector: Technology | |
| SubSector: Semiconductors | |
| MarketCap: 107193 Millions | |
| Recent Price: 37.30 Smart Investing & Trading Score: 100 | |
| Day Percent Change: 3.78408% Day Change: 1.22 | |
| Week Change: 19.4747% Year-to-date Change: 84.5% | |
| INTC Links: Profile News Message Board | |
| Charts:- Daily , Weekly | |
| Add INTC to Watchlist: View: Get INTC Trend Analysis ➞ | |
 | ALB Albemarle Corp |
| Sector: Materials | |
| SubSector: Specialty Chemicals | |
| MarketCap: 9595.87 Millions | |
| Recent Price: 87.61 Smart Investing & Trading Score: 80 | |
| Day Percent Change: 3.7173% Day Change: 2.94 | |
| Week Change: 7.39152% Year-to-date Change: 4.0% | |
| ALB Links: Profile News Message Board | |
| Charts:- Daily , Weekly | |
| Add ALB to Watchlist: View: Get ALB Trend Analysis ➞ | |
 | CZR Caesars Entertainment Inc |
| Sector: Services & Goods | |
| SubSector: Resorts & Casinos | |
| MarketCap: 5478.5 Millions | |
| Recent Price: 26.90 Smart Investing & Trading Score: 60 | |
| Day Percent Change: 3.66089% Day Change: 0.69 | |
| Week Change: 2.12604% Year-to-date Change: -17.5% | |
| CZR Links: Profile News Message Board | |
| Charts:- Daily , Weekly | |
| Add CZR to Watchlist: View: Get CZR Trend Analysis ➞ | |
 | TECH Bio-Techne Corp |
| Sector: Health Care | |
| SubSector: Biotechnology | |
| MarketCap: 8463.45 Millions | |
| Recent Price: 62.09 Smart Investing & Trading Score: 100 | |
| Day Percent Change: 3.6215% Day Change: 2.48 | |
| Week Change: 21.2222% Year-to-date Change: -12.9% | |
| TECH Links: Profile News Message Board | |
| Charts:- Daily , Weekly | |
| Add TECH to Watchlist: View: Get TECH Trend Analysis ➞ | |
 | DD DuPont de Nemours Inc |
| Sector: Materials | |
| SubSector: Specialty Chemicals | |
| MarketCap: 32584.5 Millions | |
| Recent Price: 80.99 Smart Investing & Trading Score: 100 | |
| Day Percent Change: 3.54129% Day Change: 2.65 | |
| Week Change: 6.83287% Year-to-date Change: 8.6% | |
| DD Links: Profile News Message Board | |
| Charts:- Daily , Weekly | |
| Add DD to Watchlist: View: Get DD Trend Analysis ➞ | |
 | AMD Advanced Micro Devices Inc |
| Sector: Technology | |
| SubSector: Semiconductors | |
| MarketCap: 245277 Millions | |
| Recent Price: 169.73 Smart Investing & Trading Score: 90 | |
| Day Percent Change: 3.48759% Day Change: 6.03 | |
| Week Change: 5.50099% Year-to-date Change: 40.7% | |
| AMD Links: Profile News Message Board | |
| Charts:- Daily , Weekly | |
| Add AMD to Watchlist: View: Get AMD Trend Analysis ➞ | |
 | PYPL PayPal Holdings Inc |
| Sector: Financials | |
| SubSector: Credit Services | |
| MarketCap: 65214.1 Millions | |
| Recent Price: 68.93 Smart Investing & Trading Score: 70 | |
| Day Percent Change: 3.40534% Day Change: 1.84 | |
| Week Change: 1.57678% Year-to-date Change: -20.0% | |
| PYPL Links: Profile News Message Board | |
| Charts:- Daily , Weekly | |
| Add PYPL to Watchlist: View: Get PYPL Trend Analysis ➞ | |
 | CMG Chipotle Mexican Grill |
| Sector: Services & Goods | |
| SubSector: Restaurants | |
| MarketCap: 55056.7 Millions | |
| Recent Price: 40.27 Smart Investing & Trading Score: 60 | |
| Day Percent Change: 3.3359% Day Change: 1.25 | |
| Week Change: 1.82048% Year-to-date Change: -32.8% | |
| CMG Links: Profile News Message Board | |
| Charts:- Daily , Weekly | |
| Add CMG to Watchlist: View: Get CMG Trend Analysis ➞ | |
 | NRG NRG Energy Inc |
| Sector: Utilities | |
| SubSector: Utilities - Independent Power Producers | |
| MarketCap: 28562 Millions | |
| Recent Price: 167.30 Smart Investing & Trading Score: 70 | |
| Day Percent Change: 3.32901% Day Change: 5.6 | |
| Week Change: 1.03877% Year-to-date Change: 82.4% | |
| NRG Links: Profile News Message Board | |
| Charts:- Daily , Weekly | |
| Add NRG to Watchlist: View: Get NRG Trend Analysis ➞ | |
 | FSLR First Solar Inc |
| Sector: Technology | |
| SubSector: Solar | |
| MarketCap: 22000.8 Millions | |
| Recent Price: 232.13 Smart Investing & Trading Score: 100 | |
| Day Percent Change: 3.25149% Day Change: 6.23 | |
| Week Change: 5.91322% Year-to-date Change: 24.5% | |
| FSLR Links: Profile News Message Board | |
| Charts:- Daily , Weekly | |
| Add FSLR to Watchlist: View: Get FSLR Trend Analysis ➞ | |
 | MCHP Microchip Technology, Inc |
| Sector: Technology | |
| SubSector: Semiconductors | |
| MarketCap: 35575.7 Millions | |
| Recent Price: 66.13 Smart Investing & Trading Score: 70 | |
| Day Percent Change: 3.15083% Day Change: 1.97 | |
| Week Change: 0.425209% Year-to-date Change: 18.0% | |
| MCHP Links: Profile News Message Board | |
| Charts:- Daily , Weekly | |
| Add MCHP to Watchlist: View: Get MCHP Trend Analysis ➞ | |
 | CNC Centene Corp |
| Sector: Health Care | |
| SubSector: Healthcare Plans | |
| MarketCap: 14233 Millions | |
| Recent Price: 36.82 Smart Investing & Trading Score: 100 | |
| Day Percent Change: 3.02182% Day Change: 1.18 | |
| Week Change: 6.26263% Year-to-date Change: -39.2% | |
| CNC Links: Profile News Message Board | |
| Charts:- Daily , Weekly | |
| Add CNC to Watchlist: View: Get CNC Trend Analysis ➞ | |
 | EL Estee Lauder Cos., Inc |
| Sector: Consumer Staples | |
| SubSector: Household & Personal Products | |
| MarketCap: 32102.1 Millions | |
| Recent Price: 88.77 Smart Investing & Trading Score: 60 | |
| Day Percent Change: 2.98144% Day Change: 2.58 | |
| Week Change: 4.03141% Year-to-date Change: 21.2% | |
| EL Links: Profile News Message Board | |
| Charts:- Daily , Weekly | |
| Add EL to Watchlist: View: Get EL Trend Analysis ➞ | |
 | CTVA Corteva Inc |
| Sector: Materials | |
| SubSector: Agricultural Inputs | |
| MarketCap: 49098.9 Millions | |
| Recent Price: 63.28 Smart Investing & Trading Score: 0 | |
| Day Percent Change: 2.94453% Day Change: 1.71 | |
| Week Change: -9.09352% Year-to-date Change: 12.9% | |
| CTVA Links: Profile News Message Board | |
| Charts:- Daily , Weekly | |
| Add CTVA to Watchlist: View: Get CTVA Trend Analysis ➞ | |
 | LRCX Lam Research Corp |
| Sector: Technology | |
| SubSector: Semiconductor Equipment & Materials | |
| MarketCap: 130296 Millions | |
| Recent Price: 146.95 Smart Investing & Trading Score: 100 | |
| Day Percent Change: 2.91337% Day Change: 3.94 | |
| Week Change: 14.5184% Year-to-date Change: 104.0% | |
| LRCX Links: Profile News Message Board | |
| Charts:- Daily , Weekly | |
| Add LRCX to Watchlist: View: Get LRCX Trend Analysis ➞ | |
 | AKAM Akamai Technologies Inc |
| Sector: Technology | |
| SubSector: Software - Infrastructure | |
| MarketCap: 11264.4 Millions | |
| Recent Price: 78.03 Smart Investing & Trading Score: 90 | |
| Day Percent Change: 2.88766% Day Change: 2.04 | |
| Week Change: 2.36128% Year-to-date Change: -18.2% | |
| AKAM Links: Profile News Message Board | |
| Charts:- Daily , Weekly | |
| Add AKAM to Watchlist: View: Get AKAM Trend Analysis ➞ | |
 | ETSY Etsy Inc |
| Sector: Services & Goods | |
| SubSector: Internet Retail | |
| MarketCap: 5357.81 Millions | |
| Recent Price: 72.53 Smart Investing & Trading Score: 90 | |
| Day Percent Change: 2.89403% Day Change: 2.62 | |
| Week Change: 13.2397% Year-to-date Change: 36.6% | |
| ETSY Links: Profile News Message Board | |
| Charts:- Daily , Weekly | |
| Add ETSY to Watchlist: View: Get ETSY Trend Analysis ➞ | |
 | CRL Charles River Laboratories International Inc |
| Sector: Health Care | |
| SubSector: Diagnostics & Research | |
| MarketCap: 8070.63 Millions | |
| Recent Price: 175.36 Smart Investing & Trading Score: 100 | |
| Day Percent Change: 2.86251% Day Change: 6.32 | |
| Week Change: 17.3369% Year-to-date Change: -4.0% | |
| CRL Links: Profile News Message Board | |
| Charts:- Daily , Weekly | |
| Add CRL to Watchlist: View: Get CRL Trend Analysis ➞ | |
 | MRNA Moderna Inc |
| Sector: Health Care | |
| SubSector: Biotechnology | |
| MarketCap: 9781.46 Millions | |
| Recent Price: 28.37 Smart Investing & Trading Score: 90 | |
| Day Percent Change: 2.78986% Day Change: 0.35 | |
| Week Change: 9.62133% Year-to-date Change: -32.5% | |
| MRNA Links: Profile News Message Board | |
| Charts:- Daily , Weekly | |
| Add MRNA to Watchlist: View: Get MRNA Trend Analysis ➞ | |
 | DOW Dow Inc |
| Sector: Materials | |
| SubSector: Chemicals | |
| MarketCap: 17366.7 Millions | |
| Recent Price: 23.69 Smart Investing & Trading Score: 80 | |
| Day Percent Change: 2.77657% Day Change: 0.75 | |
| Week Change: 2.4211% Year-to-date Change: -37.5% | |
| DOW Links: Profile News Message Board | |
| Charts:- Daily , Weekly | |
| Add DOW to Watchlist: View: Get DOW Trend Analysis ➞ | |
| For tabular summary view of above stock list: Summary View ➞ 0 - 25 , 25 - 50 , 50 - 75 , 75 - 100 , 100 - 125 , 125 - 150 , 150 - 175 , 175 - 200 , 200 - 225 , 225 - 250 , 250 - 275 , 275 - 300 , 300 - 325 , 325 - 350 , 350 - 375 , 375 - 400 , 400 - 425 , 425 - 450 , 450 - 475 , 475 - 500 | ||
| Click To Change The Sort Order: By Market Cap or Company Size Performance: Year-to-date, Week and Day | |
| Select Chart Type: | ||
|
Best Stocks Today 12Stocks.com |
© 2025 12Stocks.com Terms & Conditions Privacy Contact Us
All Information Provided Only For Education And Not To Be Used For Investing or Trading. See Terms & Conditions


One More Thing ... Get Best Stocks Delivered Daily!
Never Ever Miss A Move With Our Top Ten Stocks Lists
Find Best Stocks In Any Market - Bull or Bear Market
Take A Peek At Our Top Ten Stocks Lists: Daily, Weekly, Year-to-Date & Top Trends
Find Best Stocks In Any Market - Bull or Bear Market
Take A Peek At Our Top Ten Stocks Lists: Daily, Weekly, Year-to-Date & Top Trends
S&P 500 Stocks With Best Up Trends [0-bearish to 100-bullish]: Fair Isaac[100], Intel Corp[100], Bio-Techne Corp[100], DuPont de[100], First Solar[100], Centene Corp[100], Lam Research[100], Charles River[100], Applied Materials[100], Steel Dynamics[100], Teradyne Inc[100]
Best S&P 500 Stocks Year-to-Date:
Seagate [198.865%], Western Digital[181.204%], Newmont Corp[127.671%], Micron [110.87%], Lam Research[103.976%], Intel Corp[84.4708%], Warner Bros.[84.2%], NRG [82.3658%], CVS Health[81.156%], Amphenol Corp[79.8571%], KLA Corp[79.7904%] Best S&P 500 Stocks This Week:
Pioneer Natural[108.1%], Bio-Techne Corp[21.2222%], Electronic Arts[20.1076%], Western Digital[19.6645%], Intel Corp[19.4747%], Charles River[17.3369%], Fair Isaac[15.6495%], Lamb Weston[15.5663%], Lam Research[14.5184%], Seagate [13.8757%], Micron [13.6232%] Best S&P 500 Stocks Daily:
Fair Isaac[17.979%], Celanese Corp[6.98937%], Humana Inc[3.99157%], CF Industries[3.94539%], Eastman Chemical[3.88961%], Intel Corp[3.78408%], Albemarle Corp[3.7173%], Caesars Entertainment[3.66089%], Bio-Techne Corp[3.6215%], DuPont de[3.54129%], Advanced Micro[3.48759%]