
 Login Sign Up


| |||||
 |  | ||||

| 12Stocks.com Market Intelligence |
Best S&P 100 Stocks
| In a hurry? S&P 100 Stocks Lists: Performance Trends Table, Stock Charts
Sort S&P 100 stocks: Daily, Weekly, Year-to-Date, Market Cap & Trends. |
| 12Stocks.com S&P 100 Stocks Performances & Trends Daily | |||||||||
|
|  The overall Smart Investing & Trading Score is 88 (0-bearish to 100-bullish) which puts S&P 100 index in short term bullish trend. The Smart Investing & Trading Score from previous trading session is 95 and hence a deterioration of trend.
| ||||||||
Here are the Smart Investing & Trading Scores of the most requested S&P 100 stocks at 12Stocks.com (click stock name for detailed review):
|


| 12Stocks.com: Top Performing S&P 100 Index Stocks | ||||||||||||||||||||||||||||||||||||||||||||||||
 The top performing S&P 100 Index stocks year to date are
Now, more recently, over last week, the top performing S&P 100 Index stocks on the move are


|
||||||||||||||||||||||||||||||||||||||||||||||||
| 12Stocks.com: Investing in S&P 100 Index with Stocks | |
|
The following table helps investors and traders sort through current performance and trends (as measured by Smart Investing & Trading Score) of various
stocks in the S&P 100 Index. Quick View: Move mouse or cursor over stock symbol (ticker) to view short-term technical chart and over stock name to view long term chart. Click on  to add stock symbol to your watchlist and to add stock symbol to your watchlist and  to view watchlist. Click on any ticker or stock name for detailed market intelligence report for that stock. to view watchlist. Click on any ticker or stock name for detailed market intelligence report for that stock. |
12Stocks.com Performance of Stocks in S&P 100 Index
| Ticker | Stock Name | Watchlist | Category | Recent Price | Smart Investing & Trading Score | Change % | Weekly Change% |
| DHR | Danaher |   | Industrials | 248.65 | 57 | -0.04% | 0.11% |
| LOW | Lowe s | | Services & Goods | 232.26 | 40 | 0.35% | 0.06% |
| COF | Capital One | | Financials | 142.19 | 41 | -0.26% | -0.16% |
| UPS | United Parcel | | Transports | 146.18 | 50 | -0.62% | -0.17% |
| SCHW | Charles Schwab | | Financials | 75.89 | 71 | 0.46% | -0.20% |
| JNJ | Johnson & Johnson | | Health Care | 148.88 | 44 | 0.11% | -0.26% |
| TMUS | T-Mobile US | | Technology | 163.99 | 63 | 1.11% | -0.37% |
| USB | U.S. Bancorp | | Financials | 41.23 | 45 | -0.85% | -0.45% |
| BMY | Bristol-Myers | | Health Care | 43.76 | 28 | -0.65% | -0.53% |
| AMT | American Tower | | Financials | 180.60 | 45 | -0.38% | -0.63% |
| AAPL | Apple | | Technology | 182.10 | 88 | -0.17% | -0.70% |
| ABT | Abbott | | Health Care | 105.06 | 0 | -1.05% | -0.79% |
| KHC | Kraft Heinz | | Consumer Staples | 36.03 | 36 | 0.63% | -0.87% |
| HD | Home Depot | | Services & Goods | 339.42 | 37 | -0.37% | -1.00% |
| MCD | McDonald s | | Services & Goods | 267.51 | 10 | 0.00% | -1.04% |
| BA | Boeing | | Industrials | 177.80 | 37 | 0.62% | -1.11% |
| FDX | FedEx | | Transports | 257.51 | 36 | -0.76% | -1.20% |
| CVS | CVS Health | | Health Care | 55.16 | 10 | -1.05% | -1.33% |
| PYPL | PayPal | | Financials | 64.53 | 46 | -2.12% | -1.79% |
| MMM | 3M | | Industrials | 95.36 | 63 | -0.19% | -1.84% |
| F | Ford Motor | | Consumer Staples | 12.18 | 18 | 0.08% | -2.01% |
| ABBV | AbbVie | | Health Care | 160.32 | 7 | -1.37% | -2.12% |
| AMGN | Amgen | | Health Care | 304.50 | 80 | 1.40% | -2.18% |
| INTC | Intel | | Technology | 29.89 | 20 | -2.59% | -3.28% |
| TSLA | Tesla | | Consumer Staples | 174.49 | 25 | -1.87% | -3.70% |
| For chart view version of above stock list: Chart View ➞ 0 - 25 , 25 - 50 , 50 - 75 , 75 - 100 , 100 - 125 | ||
 | Click To Change The Sort Order: By Market Cap or Company Size Performance: Year-to-date, Week and Day |  |
|
Get the most comprehensive stock market coverage daily at 12Stocks.com ➞ Best Stocks Today ➞ Best Stocks Weekly ➞ Best Stocks Year-to-Date ➞ Best Stocks Trends ➞  Best Stocks Today 12Stocks.com Best Nasdaq Stocks ➞ Best S&P 500 Stocks ➞ Best Tech Stocks ➞ Best Biotech Stocks ➞ |
| Detailed Overview of S&P 100 Stocks |
| S&P 100 Technical Overview, Leaders & Laggards, Top S&P 100 ETF Funds & Detailed S&P 100 Stocks List, Charts, Trends & More |
| S&P 100: Technical Analysis, Trends & YTD Performance | |
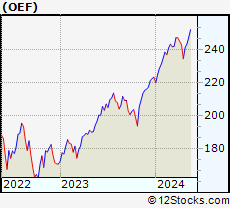
| S&P 100 index as represented by
OEF, an exchange-traded fund [ETF], holds basket of one hundred US (mostly largecap) stocks from across all major sectors of the US stock market. The S&P 100 index (contains stocks like Apple and Exxon) is up by 10.43% and is currently outperforming the overall market by 2.34% year-to-date. Below is a quick view of technical charts and trends: | |
 OEF Weekly Chart |
|
| Long Term Trend: Good | |
| Medium Term Trend: Very Good | |
 OEF Daily Chart |
|
| Short Term Trend: Very Good | |
| Overall Trend Score: 88 | |
| YTD Performance: 10.43% | |
| **Trend Scores & Views Are Only For Educational Purposes And Not For Investing | |
| 12Stocks.com: Investing in S&P 100 Index using Exchange Traded Funds | |
|
The following table shows list of key exchange traded funds (ETF) that
help investors track S&P 100 index. We have also included ETF funds that track S&P 500 index since it is market-cap weighted. The following list also includes leveraged ETF funds that track twice or thrice the daily returns of S&P 100 indices. Short or inverse ETF funds move in the opposite direction to the index they track and are useful during market pullbacks or during bear markets. Quick View: Move mouse or cursor over ETF symbol (ticker) to view short-term technical chart and over ETF name to view long term chart. Click on ticker or stock name for detailed view. Click on to add stock symbol to your watchlist and to view watchlist. |
12Stocks.com List of ETFs that track S&P 100 Index
| Ticker | ETF Name | Watchlist | Recent Price | Smart Investing & Trading Score | Change % | Week % | Year-to-date % |
| SPY | SPDR S&P 500 ETF | | 517.12 | 88 | 0.00 | 1.14 | 8.8% |
| SH | ProShares Short S&P500 | | 12.10 | 22 | 0.04 | -1.1 | -6.89% |
| SPXS | Direxion Daily S&P 500 Bear 3X ETF | | 9.18 | 12 | 0.49 | -3.01 | -20.56% |
| SPXU | ProShares UltraPro Short S&P500 | | 33.78 | 12 | 0.15 | -3.18 | -21.44% |
| SDS | ProShares UltraShort S&P500 | | 25.65 | 12 | -0.04 | -2.29 | -14.27% |
| UPRO | ProShares UltraPro S&P500 | | 66.84 | 88 | -0.07 | 3.32 | 22.1% |
| SSO | ProShares Ultra S&P500 | | 75.14 | 88 | 0.05 | 2.29 | 15.48% |
| SPXL | Direxion Daily S&P500 Bull 3X ETF | | 126.32 | 88 | -0.61 | 2.82 | 21.47% |
| VOO | Vanguard 500 ETF | | 474.53 | 88 | -0.18 | 0.97 | 8.64% |
| OEF | iShares S&P 100 | | 246.70 | 88 | 0.11 | 1.21 | 10.43% |
| 12Stocks.com: Charts, Trends, Fundamental Data and Performances of S&P 100 Stocks | |
|
We now take in-depth look at all S&P 100 stocks including charts, multi-period performances and overall trends (as measured by Smart Investing & Trading Score). One can sort S&P 100 stocks (click link to choose) by Daily, Weekly and by Year-to-Date performances. Also, one can sort by size of the company or by market capitalization. |
| Select Your Default Chart Type: | |||||
| |||||
| Click on stock symbol or name for detailed view. Click on to add stock symbol to your watchlist and to view watchlist. Quick View: Move mouse or cursor over "Daily" to quickly view daily technical stock chart and over "Weekly" to view weekly technical stock chart. | |||||

 | DHR Danaher Corporation |
| Sector: Industrials | |
| SubSector: Diversified Machinery | |
| MarketCap: 93210.3 Millions | |
| Recent Price: 248.65 Smart Investing & Trading Score: 57 | |
| Day Percent Change: -0.04% Day Change: -0.11 | |
| Week Change: 0.11% Year-to-date Change: 7.5% | |
| DHR Links: Profile News Message Board | |
| Charts:- Daily , Weekly | |
| Add DHR to Watchlist: View: Get Complete DHR Trend Analysis ➞ | |
 | LOW Lowe s Companies, Inc. |
| Sector: Services & Goods | |
| SubSector: Home Improvement Stores | |
| MarketCap: 56084.2 Millions | |
| Recent Price: 232.26 Smart Investing & Trading Score: 40 | |
| Day Percent Change: 0.35% Day Change: 0.80 | |
| Week Change: 0.06% Year-to-date Change: 4.4% | |
| LOW Links: Profile News Message Board | |
| Charts:- Daily , Weekly | |
| Add LOW to Watchlist: View: Get Complete LOW Trend Analysis ➞ | |
 | COF Capital One Financial Corporation |
| Sector: Financials | |
| SubSector: Credit Services | |
| MarketCap: 23094.2 Millions | |
| Recent Price: 142.19 Smart Investing & Trading Score: 41 | |
| Day Percent Change: -0.26% Day Change: -0.38 | |
| Week Change: -0.16% Year-to-date Change: 8.4% | |
| COF Links: Profile News Message Board | |
| Charts:- Daily , Weekly | |
| Add COF to Watchlist: View: Get Complete COF Trend Analysis ➞ | |
 | UPS United Parcel Service, Inc. |
| Sector: Transports | |
| SubSector: Air Delivery & Freight Services | |
| MarketCap: 81928.9 Millions | |
| Recent Price: 146.18 Smart Investing & Trading Score: 50 | |
| Day Percent Change: -0.62% Day Change: -0.91 | |
| Week Change: -0.17% Year-to-date Change: -7.0% | |
| UPS Links: Profile News Message Board | |
| Charts:- Daily , Weekly | |
| Add UPS to Watchlist: View: Get Complete UPS Trend Analysis ➞ | |
 | SCHW The Charles Schwab Corporation |
| Sector: Financials | |
| SubSector: Investment Brokerage - National | |
| MarketCap: 45115.8 Millions | |
| Recent Price: 75.89 Smart Investing & Trading Score: 71 | |
| Day Percent Change: 0.46% Day Change: 0.35 | |
| Week Change: -0.2% Year-to-date Change: 10.3% | |
| SCHW Links: Profile News Message Board | |
| Charts:- Daily , Weekly | |
| Add SCHW to Watchlist: View: Get Complete SCHW Trend Analysis ➞ | |
 | JNJ Johnson & Johnson |
| Sector: Health Care | |
| SubSector: Drug Manufacturers - Major | |
| MarketCap: 331972 Millions | |
| Recent Price: 148.88 Smart Investing & Trading Score: 44 | |
| Day Percent Change: 0.11% Day Change: 0.16 | |
| Week Change: -0.26% Year-to-date Change: -5.0% | |
| JNJ Links: Profile News Message Board | |
| Charts:- Daily , Weekly | |
| Add JNJ to Watchlist: View: Get Complete JNJ Trend Analysis ➞ | |
 | TMUS T-Mobile US, Inc. |
| Sector: Technology | |
| SubSector: Wireless Communications | |
| MarketCap: 71949 Millions | |
| Recent Price: 163.99 Smart Investing & Trading Score: 63 | |
| Day Percent Change: 1.11% Day Change: 1.80 | |
| Week Change: -0.37% Year-to-date Change: 2.3% | |
| TMUS Links: Profile News Message Board | |
| Charts:- Daily , Weekly | |
| Add TMUS to Watchlist: View: Get Complete TMUS Trend Analysis ➞ | |
 | USB U.S. Bancorp |
| Sector: Financials | |
| SubSector: Regional - Midwest Banks | |
| MarketCap: 56757.8 Millions | |
| Recent Price: 41.23 Smart Investing & Trading Score: 45 | |
| Day Percent Change: -0.85% Day Change: -0.35 | |
| Week Change: -0.45% Year-to-date Change: -4.8% | |
| USB Links: Profile News Message Board | |
| Charts:- Daily , Weekly | |
| Add USB to Watchlist: View: Get Complete USB Trend Analysis ➞ | |
 | BMY Bristol-Myers Squibb Company |
| Sector: Health Care | |
| SubSector: Drug Manufacturers - Major | |
| MarketCap: 117052 Millions | |
| Recent Price: 43.76 Smart Investing & Trading Score: 28 | |
| Day Percent Change: -0.65% Day Change: -0.28 | |
| Week Change: -0.53% Year-to-date Change: -14.7% | |
| BMY Links: Profile News Message Board | |
| Charts:- Daily , Weekly | |
| Add BMY to Watchlist: View: Get Complete BMY Trend Analysis ➞ | |
 | AMT American Tower Corporation (REIT) |
| Sector: Financials | |
| SubSector: REIT - Diversified | |
| MarketCap: 92527 Millions | |
| Recent Price: 180.60 Smart Investing & Trading Score: 45 | |
| Day Percent Change: -0.38% Day Change: -0.68 | |
| Week Change: -0.63% Year-to-date Change: -16.3% | |
| AMT Links: Profile News Message Board | |
| Charts:- Daily , Weekly | |
| Add AMT to Watchlist: View: Get Complete AMT Trend Analysis ➞ | |
 | AAPL Apple Inc. |
| Sector: Technology | |
| SubSector: Electronic Equipment | |
| MarketCap: 1112940 Millions | |
| Recent Price: 182.10 Smart Investing & Trading Score: 88 | |
| Day Percent Change: -0.17% Day Change: -0.31 | |
| Week Change: -0.7% Year-to-date Change: -5.4% | |
| AAPL Links: Profile News Message Board | |
| Charts:- Daily , Weekly | |
| Add AAPL to Watchlist: View: Get Complete AAPL Trend Analysis ➞ | |
 | ABT Abbott Laboratories |
| Sector: Health Care | |
| SubSector: Medical Appliances & Equipment | |
| MarketCap: 125288 Millions | |
| Recent Price: 105.06 Smart Investing & Trading Score: 0 | |
| Day Percent Change: -1.05% Day Change: -1.11 | |
| Week Change: -0.79% Year-to-date Change: -4.6% | |
| ABT Links: Profile News Message Board | |
| Charts:- Daily , Weekly | |
| Add ABT to Watchlist: View: Get Complete ABT Trend Analysis ➞ | |
 | KHC The Kraft Heinz Company |
| Sector: Consumer Staples | |
| SubSector: Food - Major Diversified | |
| MarketCap: 32096.3 Millions | |
| Recent Price: 36.03 Smart Investing & Trading Score: 36 | |
| Day Percent Change: 0.63% Day Change: 0.22 | |
| Week Change: -0.87% Year-to-date Change: -2.6% | |
| KHC Links: Profile News Message Board | |
| Charts:- Daily , Weekly | |
| Add KHC to Watchlist: View: Get Complete KHC Trend Analysis ➞ | |
 | HD The Home Depot, Inc. |
| Sector: Services & Goods | |
| SubSector: Home Improvement Stores | |
| MarketCap: 185389 Millions | |
| Recent Price: 339.42 Smart Investing & Trading Score: 37 | |
| Day Percent Change: -0.37% Day Change: -1.27 | |
| Week Change: -1% Year-to-date Change: -2.1% | |
| HD Links: Profile News Message Board | |
| Charts:- Daily , Weekly | |
| Add HD to Watchlist: View: Get Complete HD Trend Analysis ➞ | |
 | MCD McDonald s Corporation |
| Sector: Services & Goods | |
| SubSector: Restaurants | |
| MarketCap: 122481 Millions | |
| Recent Price: 267.51 Smart Investing & Trading Score: 10 | |
| Day Percent Change: 0.00% Day Change: 0.01 | |
| Week Change: -1.04% Year-to-date Change: -9.8% | |
| MCD Links: Profile News Message Board | |
| Charts:- Daily , Weekly | |
| Add MCD to Watchlist: View: Get Complete MCD Trend Analysis ➞ | |
 | BA The Boeing Company |
| Sector: Industrials | |
| SubSector: Aerospace/Defense Products & Services | |
| MarketCap: 65336.4 Millions | |
| Recent Price: 177.80 Smart Investing & Trading Score: 37 | |
| Day Percent Change: 0.62% Day Change: 1.09 | |
| Week Change: -1.11% Year-to-date Change: -31.8% | |
| BA Links: Profile News Message Board | |
| Charts:- Daily , Weekly | |
| Add BA to Watchlist: View: Get Complete BA Trend Analysis ➞ | |
 | FDX FedEx Corporation |
| Sector: Transports | |
| SubSector: Air Delivery & Freight Services | |
| MarketCap: 33188 Millions | |
| Recent Price: 257.51 Smart Investing & Trading Score: 36 | |
| Day Percent Change: -0.76% Day Change: -1.96 | |
| Week Change: -1.2% Year-to-date Change: 1.8% | |
| FDX Links: Profile News Message Board | |
| Charts:- Daily , Weekly | |
| Add FDX to Watchlist: View: Get Complete FDX Trend Analysis ➞ | |
 | CVS CVS Health Corporation |
| Sector: Health Care | |
| SubSector: Health Care Plans | |
| MarketCap: 80104.3 Millions | |
| Recent Price: 55.16 Smart Investing & Trading Score: 10 | |
| Day Percent Change: -1.05% Day Change: -0.59 | |
| Week Change: -1.33% Year-to-date Change: -30.2% | |
| CVS Links: Profile News Message Board | |
| Charts:- Daily , Weekly | |
| Add CVS to Watchlist: View: Get Complete CVS Trend Analysis ➞ | |
 | PYPL PayPal Holdings, Inc. |
| Sector: Financials | |
| SubSector: Credit Services | |
| MarketCap: 108949 Millions | |
| Recent Price: 64.53 Smart Investing & Trading Score: 46 | |
| Day Percent Change: -2.12% Day Change: -1.39 | |
| Week Change: -1.79% Year-to-date Change: 5.1% | |
| PYPL Links: Profile News Message Board | |
| Charts:- Daily , Weekly | |
| Add PYPL to Watchlist: View: Get Complete PYPL Trend Analysis ➞ | |
 | MMM 3M Company |
| Sector: Industrials | |
| SubSector: Diversified Machinery | |
| MarketCap: 79237.7 Millions | |
| Recent Price: 95.36 Smart Investing & Trading Score: 63 | |
| Day Percent Change: -0.19% Day Change: -0.18 | |
| Week Change: -1.84% Year-to-date Change: -12.8% | |
| MMM Links: Profile News Message Board | |
| Charts:- Daily , Weekly | |
| Add MMM to Watchlist: View: Get Complete MMM Trend Analysis ➞ | |
 | F Ford Motor Company |
| Sector: Consumer Staples | |
| SubSector: Auto Manufacturers - Major | |
| MarketCap: 19052.1 Millions | |
| Recent Price: 12.18 Smart Investing & Trading Score: 18 | |
| Day Percent Change: 0.08% Day Change: 0.01 | |
| Week Change: -2.01% Year-to-date Change: -0.1% | |
| F Links: Profile News Message Board | |
| Charts:- Daily , Weekly | |
| Add F to Watchlist: View: Get Complete F Trend Analysis ➞ | |
 | ABBV AbbVie Inc. |
| Sector: Health Care | |
| SubSector: Drug Manufacturers - Major | |
| MarketCap: 110080 Millions | |
| Recent Price: 160.32 Smart Investing & Trading Score: 7 | |
| Day Percent Change: -1.37% Day Change: -2.23 | |
| Week Change: -2.12% Year-to-date Change: 3.5% | |
| ABBV Links: Profile News Message Board | |
| Charts:- Daily , Weekly | |
| Add ABBV to Watchlist: View: Get Complete ABBV Trend Analysis ➞ | |
 | AMGN Amgen Inc. |
| Sector: Health Care | |
| SubSector: Biotechnology | |
| MarketCap: 121030 Millions | |
| Recent Price: 304.50 Smart Investing & Trading Score: 80 | |
| Day Percent Change: 1.40% Day Change: 4.20 | |
| Week Change: -2.18% Year-to-date Change: 5.7% | |
| AMGN Links: Profile News Message Board | |
| Charts:- Daily , Weekly | |
| Add AMGN to Watchlist: View: Get Complete AMGN Trend Analysis ➞ | |
 | INTC Intel Corporation |
| Sector: Technology | |
| SubSector: Semiconductor - Broad Line | |
| MarketCap: 222357 Millions | |
| Recent Price: 29.89 Smart Investing & Trading Score: 20 | |
| Day Percent Change: -2.59% Day Change: -0.79 | |
| Week Change: -3.28% Year-to-date Change: -40.5% | |
| INTC Links: Profile News Message Board | |
| Charts:- Daily , Weekly | |
| Add INTC to Watchlist: View: Get Complete INTC Trend Analysis ➞ | |
 | TSLA Tesla, Inc. |
| Sector: Consumer Staples | |
| SubSector: Auto Manufacturers - Major | |
| MarketCap: 89058.8 Millions | |
| Recent Price: 174.49 Smart Investing & Trading Score: 25 | |
| Day Percent Change: -1.87% Day Change: -3.32 | |
| Week Change: -3.7% Year-to-date Change: -29.8% | |
| TSLA Links: Profile News Message Board | |
| Charts:- Daily , Weekly | |
| Add TSLA to Watchlist: View: Get Complete TSLA Trend Analysis ➞ | |
| For tabular summary view of above stock list: Summary View ➞ 0 - 25 , 25 - 50 , 50 - 75 , 75 - 100 , 100 - 125 | ||
| Click To Change The Sort Order: By Market Cap or Company Size Performance: Year-to-date, Week and Day | |
| Select Chart Type: | ||
|
Best Stocks Today 12Stocks.com |
� 2024 12Stocks.com Terms & Conditions Privacy Contact Us
All Information Provided Only For Education And Not To Be Used For Investing or Trading. See Terms & Conditions


One More Thing ... Get Best Stocks Delivered Daily!
Never Ever Miss A Move With Our Top Ten Stocks Lists
Find Best Stocks In Any Market - Bull or Bear Market
Take A Peek At Our Top Ten Stocks Lists: Daily, Weekly, Year-to-Date & Top Trends
Find Best Stocks In Any Market - Bull or Bear Market
Take A Peek At Our Top Ten Stocks Lists: Daily, Weekly, Year-to-Date & Top Trends
S&P 100 Stocks With Best Up Trends [0-bearish to 100-bullish]: Altria [100], Dow [100], NextEra Energy[100], Duke Energy[100], PepsiCo [100], Morgan Stanley[100], Netflix [95], AT&T [95], American [95], Southern [95], Exelon [95]
Best S&P 100 Stocks Year-to-Date:
NVIDIA [82.42%], Meta Platforms[33.86%], General Electric[32.92%], Eli Lilly[32.88%], Netflix [26.48%], General Motors[26.04%], American Express[25.4%], QUALCOMM [24.46%], Amazon.com [23.62%], Wells Fargo[22.82%], Google [21.75%] Best S&P 100 Stocks This Week:
Netflix [6.3%], Charter [5.66%], Eli Lilly[5.39%], Meta Platforms[4.79%], Broadcom [3.85%], Emerson Electric[3.76%], General Electric[3.37%], Costco Wholesale[3.29%], Dow [3.28%], Simon Property[3.26%], NextEra Energy[3.19%] Best S&P 100 Stocks Daily:
Charter [4.85%], Comcast [3.20%], Emerson Electric[2.93%], Broadcom [1.86%], Starbucks [1.77%], Netflix [1.62%], Amgen [1.40%], Cisco Systems[1.22%], Meta Platforms[1.20%], T-Mobile US[1.11%], Pfizer [0.97%]