
 Login Sign Up


| |||||
 |  | ||||

| 12Stocks.com Market Intelligence |
Best S&P 100 Stocks
| In a hurry? S&P 100 Stocks Lists: Performance Trends Table, Stock Charts
Sort S&P 100 stocks: Daily, Weekly, Year-to-Date, Market Cap & Trends. |
| 12Stocks.com S&P 100 Stocks Performances & Trends Daily | |||||||||
|
|  The overall Smart Investing & Trading Score is 30 (0-bearish to 100-bullish) which puts S&P 100 index in short term bearish to neutral trend. The Smart Investing & Trading Score from previous trading session is 7 and hence an improvement of trend.
| ||||||||
Here are the Smart Investing & Trading Scores of the most requested S&P 100 stocks at 12Stocks.com (click stock name for detailed review):
|


| 12Stocks.com: Top Performing S&P 100 Index Stocks | ||||||||||||||||||||||||||||||||||||||||||||||||
 The top performing S&P 100 Index stocks year to date are
Now, more recently, over last week, the top performing S&P 100 Index stocks on the move are


|
||||||||||||||||||||||||||||||||||||||||||||||||
| 12Stocks.com: Investing in S&P 100 Index with Stocks | |
|
The following table helps investors and traders sort through current performance and trends (as measured by Smart Investing & Trading Score) of various
stocks in the S&P 100 Index. Quick View: Move mouse or cursor over stock symbol (ticker) to view short-term technical chart and over stock name to view long term chart. Click on  to add stock symbol to your watchlist and to add stock symbol to your watchlist and  to view watchlist. Click on any ticker or stock name for detailed market intelligence report for that stock. to view watchlist. Click on any ticker or stock name for detailed market intelligence report for that stock. |
12Stocks.com Performance of Stocks in S&P 100 Index
| Ticker | Stock Name | Watchlist | Category | Recent Price | Smart Investing & Trading Score | Change % | Weekly Change% |
| USB | U.S. Bancorp |   | Financials | 40.97 | 24 | -0.19% | -0.36% |
| TMO | Thermo Fisher | | Health Care | 571.25 | 45 | -0.65% | -0.41% |
| UNH | UnitedHealth | | Health Care | 492.97 | 75 | 1.83% | -0.48% |
| CMCSA | Comcast | | Services & Goods | 38.36 | 17 | 0.42% | -0.54% |
| OEF | iShares S&P | | Utilities | 240.23 | 30 | 1.16% | -0.55% |
| SPY | SPDR S&P | | Utilities | 505.03 | 30 | 0.94% | -0.64% |
| SPG | Simon Property | | Financials | 141.36 | 10 | 0.84% | -0.70% |
| WMT | Walmart | | Services & Goods | 59.71 | 56 | 1.46% | -0.75% |
| BLK | BlackRock | | Financials | 757.00 | 18 | 0.72% | -0.77% |
| CRM | salesforce.com | | Technology | 272.13 | 10 | 1.28% | -0.79% |
| DOW | Dow | | Materials | 56.83 | 41 | -0.70% | -0.80% |
| JPM | JPMorgan Chase | | Financials | 191.66 | 48 | -0.10% | -0.95% |
| TXN | Texas Instruments | | Technology | 175.80 | 68 | 0.34% | -0.95% |
| BK | Bank of New York | | Financials | 56.60 | 48 | 0.25% | -1.26% |
| AXP | American Express | | Financials | 232.50 | 53 | 0.45% | -1.33% |
| BKNG | Booking | | Services & Goods | 3472.91 | 23 | 1.68% | -1.37% |
| FDX | FedEx | | Transports | 262.03 | 43 | 0.50% | -1.43% |
| XOM | Exxon Mobil | | Energy | 116.24 | 36 | 0.18% | -1.46% |
| IBM | Business | | Technology | 164.69 | 10 | 0.16% | -1.46% |
| ABT | Abbott | | Health Care | 105.92 | 0 | -0.35% | -1.50% |
| C | Citi | | Financials | 61.54 | 53 | 0.31% | -1.79% |
| NKE | NIKE | | Consumer Staples | 92.41 | 35 | 2.29% | -1.82% |
| VZ | Verizon | | Technology | 38.93 | 0 | -0.69% | -1.89% |
| ORCL | Oracle | | Technology | 114.96 | 43 | 0.29% | -1.92% |
| MSFT | Microsoft | | Technology | 397.84 | 10 | 0.73% | -2.09% |
| For chart view version of above stock list: Chart View ➞ 0 - 25 , 25 - 50 , 50 - 75 , 75 - 100 , 100 - 125 | ||
 | Click To Change The Sort Order: By Market Cap or Company Size Performance: Year-to-date, Week and Day |  |
|
Get the most comprehensive stock market coverage daily at 12Stocks.com ➞ Best Stocks Today ➞ Best Stocks Weekly ➞ Best Stocks Year-to-Date ➞ Best Stocks Trends ➞  Best Stocks Today 12Stocks.com Best Nasdaq Stocks ➞ Best S&P 500 Stocks ➞ Best Tech Stocks ➞ Best Biotech Stocks ➞ |
| Detailed Overview of S&P 100 Stocks |
| S&P 100 Technical Overview, Leaders & Laggards, Top S&P 100 ETF Funds & Detailed S&P 100 Stocks List, Charts, Trends & More |
| S&P 100: Technical Analysis, Trends & YTD Performance | |
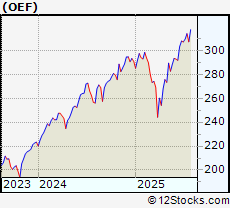
| S&P 100 index as represented by
OEF, an exchange-traded fund [ETF], holds basket of one hundred US (mostly largecap) stocks from across all major sectors of the US stock market. The S&P 100 index (contains stocks like Apple and Exxon) is up by 7.54% and is currently outperforming the overall market by 1.92% year-to-date. Below is a quick view of technical charts and trends: | |
 OEF Weekly Chart |
|
| Long Term Trend: Not Good | |
| Medium Term Trend: Not Good | |
 OEF Daily Chart |
|
| Short Term Trend: Deteriorating | |
| Overall Trend Score: 30 | |
| YTD Performance: 7.54% | |
| **Trend Scores & Views Are Only For Educational Purposes And Not For Investing | |
| 12Stocks.com: Investing in S&P 100 Index using Exchange Traded Funds | |
|
The following table shows list of key exchange traded funds (ETF) that
help investors track S&P 100 index. We have also included ETF funds that track S&P 500 index since it is market-cap weighted. The following list also includes leveraged ETF funds that track twice or thrice the daily returns of S&P 100 indices. Short or inverse ETF funds move in the opposite direction to the index they track and are useful during market pullbacks or during bear markets. Quick View: Move mouse or cursor over ETF symbol (ticker) to view short-term technical chart and over ETF name to view long term chart. Click on ticker or stock name for detailed view. Click on to add stock symbol to your watchlist and to view watchlist. |
12Stocks.com List of ETFs that track S&P 100 Index
| Ticker | ETF Name | Watchlist | Recent Price | Smart Investing & Trading Score | Change % | Week % | Year-to-date % |
| SPY | SPDR S&P 500 ETF | | 505.03 | 30 | 0.94 | -0.64 | 6.25% |
| SPXS | Direxion Daily S&P 500 Bear 3X ETF | | 9.81 | 78 | -2.58 | 2.08 | -15.06% |
| SH | ProShares Short S&P500 | | 12.38 | 70 | -0.88 | 0.81 | -4.7% |
| SDS | ProShares UltraShort S&P500 | | 26.90 | 83 | -1.82 | 1.39 | -10.09% |
| SPXU | ProShares UltraPro Short S&P500 | | 36.26 | 78 | -2.55 | 2.14 | -15.67% |
| UPRO | ProShares UltraPro S&P500 | | 62.37 | 17 | 2.75 | -2.27 | 13.94% |
| SSO | ProShares Ultra S&P500 | | 71.66 | 17 | 1.80 | -1.44 | 10.13% |
| SPXL | Direxion Daily S&P500 Bull 3X ETF | | 118.44 | 17 | 2.68 | -2.23 | 13.9% |
| VOO | Vanguard 500 ETF | | 464.22 | 30 | 0.93 | -0.64 | 6.28% |
| OEF | iShares S&P 100 | | 240.23 | 30 | 1.16 | -0.55 | 7.54% |
| 12Stocks.com: Charts, Trends, Fundamental Data and Performances of S&P 100 Stocks | |
|
We now take in-depth look at all S&P 100 stocks including charts, multi-period performances and overall trends (as measured by Smart Investing & Trading Score). One can sort S&P 100 stocks (click link to choose) by Daily, Weekly and by Year-to-Date performances. Also, one can sort by size of the company or by market capitalization. |
| Select Your Default Chart Type: | |||||
| |||||
| Click on stock symbol or name for detailed view. Click on to add stock symbol to your watchlist and to view watchlist. Quick View: Move mouse or cursor over "Daily" to quickly view daily technical stock chart and over "Weekly" to view weekly technical stock chart. | |||||
 | USB U.S. Bancorp |
| Sector: Financials | |
| SubSector: Regional - Midwest Banks | |
| MarketCap: 56757.8 Millions | |
| Recent Price: 40.97 Smart Investing & Trading Score: 24 | |
| Day Percent Change: -0.19% Day Change: -0.08 | |
| Week Change: -0.36% Year-to-date Change: -5.3% | |
| USB Links: Profile News Message Board | |
| Charts:- Daily , Weekly | |
| Add USB to Watchlist: View: Get Complete USB Trend Analysis ➞ | |
 | TMO Thermo Fisher Scientific Inc. |
| Sector: Health Care | |
| SubSector: Medical Laboratories & Research | |
| MarketCap: 112999 Millions | |
| Recent Price: 571.25 Smart Investing & Trading Score: 45 | |
| Day Percent Change: -0.65% Day Change: -3.74 | |
| Week Change: -0.41% Year-to-date Change: 7.6% | |
| TMO Links: Profile News Message Board | |
| Charts:- Daily , Weekly | |
| Add TMO to Watchlist: View: Get Complete TMO Trend Analysis ➞ | |
 | UNH UnitedHealth Group Incorporated |
| Sector: Health Care | |
| SubSector: Health Care Plans | |
| MarketCap: 217384 Millions | |
| Recent Price: 492.97 Smart Investing & Trading Score: 75 | |
| Day Percent Change: 1.83% Day Change: 8.86 | |
| Week Change: -0.48% Year-to-date Change: -6.4% | |
| UNH Links: Profile News Message Board | |
| Charts:- Daily , Weekly | |
| Add UNH to Watchlist: View: Get Complete UNH Trend Analysis ➞ | |
 | CMCSA Comcast Corporation |
| Sector: Services & Goods | |
| SubSector: Entertainment - Diversified | |
| MarketCap: 164849 Millions | |
| Recent Price: 38.36 Smart Investing & Trading Score: 17 | |
| Day Percent Change: 0.42% Day Change: 0.16 | |
| Week Change: -0.54% Year-to-date Change: -12.5% | |
| CMCSA Links: Profile News Message Board | |
| Charts:- Daily , Weekly | |
| Add CMCSA to Watchlist: View: Get Complete CMCSA Trend Analysis ➞ | |
 | OEF iShares S&P 100 |
| Sector: Utilities | |
| SubSector: Exchange Traded Fund | |
| MarketCap: 0 Millions | |
| Recent Price: 240.23 Smart Investing & Trading Score: 30 | |
| Day Percent Change: 1.16% Day Change: 2.75 | |
| Week Change: -0.55% Year-to-date Change: 7.5% | |
| OEF Links: Profile News Message Board | |
| Charts:- Daily , Weekly | |
| Add OEF to Watchlist: View: Get Complete OEF Trend Analysis ➞ | |
 | SPY SPDR S&P 500 ETF |
| Sector: Utilities | |
| SubSector: Exchange Traded Fund | |
| MarketCap: 0 Millions | |
| Recent Price: 505.03 Smart Investing & Trading Score: 30 | |
| Day Percent Change: 0.94% Day Change: 4.68 | |
| Week Change: -0.64% Year-to-date Change: 6.3% | |
| SPY Links: Profile News Message Board | |
| Charts:- Daily , Weekly | |
| Add SPY to Watchlist: View: Get Complete SPY Trend Analysis ➞ | |
 | SPG Simon Property Group, Inc. |
| Sector: Financials | |
| SubSector: REIT - Retail | |
| MarketCap: 17959.6 Millions | |
| Recent Price: 141.36 Smart Investing & Trading Score: 10 | |
| Day Percent Change: 0.84% Day Change: 1.18 | |
| Week Change: -0.7% Year-to-date Change: -0.9% | |
| SPG Links: Profile News Message Board | |
| Charts:- Daily , Weekly | |
| Add SPG to Watchlist: View: Get Complete SPG Trend Analysis ➞ | |
 | WMT Walmart Inc. |
| Sector: Services & Goods | |
| SubSector: Discount, Variety Stores | |
| MarketCap: 355610 Millions | |
| Recent Price: 59.71 Smart Investing & Trading Score: 56 | |
| Day Percent Change: 1.46% Day Change: 0.86 | |
| Week Change: -0.75% Year-to-date Change: 13.6% | |
| WMT Links: Profile News Message Board | |
| Charts:- Daily , Weekly | |
| Add WMT to Watchlist: View: Get Complete WMT Trend Analysis ➞ | |
 | BLK BlackRock, Inc. |
| Sector: Financials | |
| SubSector: Asset Management | |
| MarketCap: 61284.9 Millions | |
| Recent Price: 757.00 Smart Investing & Trading Score: 18 | |
| Day Percent Change: 0.72% Day Change: 5.42 | |
| Week Change: -0.77% Year-to-date Change: -6.8% | |
| BLK Links: Profile News Message Board | |
| Charts:- Daily , Weekly | |
| Add BLK to Watchlist: View: Get Complete BLK Trend Analysis ➞ | |
 | CRM salesforce.com, inc. |
| Sector: Technology | |
| SubSector: Application Software | |
| MarketCap: 137120 Millions | |
| Recent Price: 272.13 Smart Investing & Trading Score: 10 | |
| Day Percent Change: 1.28% Day Change: 3.44 | |
| Week Change: -0.79% Year-to-date Change: 3.4% | |
| CRM Links: Profile News Message Board | |
| Charts:- Daily , Weekly | |
| Add CRM to Watchlist: View: Get Complete CRM Trend Analysis ➞ | |
 | DOW Dow Inc. |
| Sector: Materials | |
| SubSector: Chemicals - Major Diversified | |
| MarketCap: 24098.6 Millions | |
| Recent Price: 56.83 Smart Investing & Trading Score: 41 | |
| Day Percent Change: -0.70% Day Change: -0.40 | |
| Week Change: -0.8% Year-to-date Change: 3.6% | |
| DOW Links: Profile News Message Board | |
| Charts:- Daily , Weekly | |
| Add DOW to Watchlist: View: Get Complete DOW Trend Analysis ➞ | |
 | JPM JPMorgan Chase & Co. |
| Sector: Financials | |
| SubSector: Money Center Banks | |
| MarketCap: 279736 Millions | |
| Recent Price: 191.66 Smart Investing & Trading Score: 48 | |
| Day Percent Change: -0.10% Day Change: -0.20 | |
| Week Change: -0.95% Year-to-date Change: 12.7% | |
| JPM Links: Profile News Message Board | |
| Charts:- Daily , Weekly | |
| Add JPM to Watchlist: View: Get Complete JPM Trend Analysis ➞ | |
 | TXN Texas Instruments Incorporated |
| Sector: Technology | |
| SubSector: Semiconductor - Broad Line | |
| MarketCap: 99509.1 Millions | |
| Recent Price: 175.80 Smart Investing & Trading Score: 68 | |
| Day Percent Change: 0.34% Day Change: 0.60 | |
| Week Change: -0.95% Year-to-date Change: 3.1% | |
| TXN Links: Profile News Message Board | |
| Charts:- Daily , Weekly | |
| Add TXN to Watchlist: View: Get Complete TXN Trend Analysis ➞ | |
 | BK The Bank of New York Mellon Corporation |
| Sector: Financials | |
| SubSector: Asset Management | |
| MarketCap: 29807.5 Millions | |
| Recent Price: 56.60 Smart Investing & Trading Score: 48 | |
| Day Percent Change: 0.25% Day Change: 0.14 | |
| Week Change: -1.26% Year-to-date Change: 8.7% | |
| BK Links: Profile News Message Board | |
| Charts:- Daily , Weekly | |
| Add BK to Watchlist: View: Get Complete BK Trend Analysis ➞ | |
 | AXP American Express Company |
| Sector: Financials | |
| SubSector: Credit Services | |
| MarketCap: 68388 Millions | |
| Recent Price: 232.50 Smart Investing & Trading Score: 53 | |
| Day Percent Change: 0.45% Day Change: 1.04 | |
| Week Change: -1.33% Year-to-date Change: 24.1% | |
| AXP Links: Profile News Message Board | |
| Charts:- Daily , Weekly | |
| Add AXP to Watchlist: View: Get Complete AXP Trend Analysis ➞ | |
 | BKNG Booking Holdings Inc. |
| Sector: Services & Goods | |
| SubSector: Business Services | |
| MarketCap: 54467.9 Millions | |
| Recent Price: 3472.91 Smart Investing & Trading Score: 23 | |
| Day Percent Change: 1.68% Day Change: 57.27 | |
| Week Change: -1.37% Year-to-date Change: -2.1% | |
| BKNG Links: Profile News Message Board | |
| Charts:- Daily , Weekly | |
| Add BKNG to Watchlist: View: Get Complete BKNG Trend Analysis ➞ | |
 | FDX FedEx Corporation |
| Sector: Transports | |
| SubSector: Air Delivery & Freight Services | |
| MarketCap: 33188 Millions | |
| Recent Price: 262.03 Smart Investing & Trading Score: 43 | |
| Day Percent Change: 0.50% Day Change: 1.30 | |
| Week Change: -1.43% Year-to-date Change: 3.6% | |
| FDX Links: Profile News Message Board | |
| Charts:- Daily , Weekly | |
| Add FDX to Watchlist: View: Get Complete FDX Trend Analysis ➞ | |
 | XOM Exxon Mobil Corporation |
| Sector: Energy | |
| SubSector: Major Integrated Oil & Gas | |
| MarketCap: 156450 Millions | |
| Recent Price: 116.24 Smart Investing & Trading Score: 36 | |
| Day Percent Change: 0.18% Day Change: 0.21 | |
| Week Change: -1.46% Year-to-date Change: 16.3% | |
| XOM Links: Profile News Message Board | |
| Charts:- Daily , Weekly | |
| Add XOM to Watchlist: View: Get Complete XOM Trend Analysis ➞ | |
 | IBM International Business Machines Corporation |
| Sector: Technology | |
| SubSector: Information Technology Services | |
| MarketCap: 97241.6 Millions | |
| Recent Price: 164.69 Smart Investing & Trading Score: 10 | |
| Day Percent Change: 0.16% Day Change: 0.26 | |
| Week Change: -1.46% Year-to-date Change: 0.7% | |
| IBM Links: Profile News Message Board | |
| Charts:- Daily , Weekly | |
| Add IBM to Watchlist: View: Get Complete IBM Trend Analysis ➞ | |
 | ABT Abbott Laboratories |
| Sector: Health Care | |
| SubSector: Medical Appliances & Equipment | |
| MarketCap: 125288 Millions | |
| Recent Price: 105.92 Smart Investing & Trading Score: 0 | |
| Day Percent Change: -0.35% Day Change: -0.37 | |
| Week Change: -1.5% Year-to-date Change: -3.8% | |
| ABT Links: Profile News Message Board | |
| Charts:- Daily , Weekly | |
| Add ABT to Watchlist: View: Get Complete ABT Trend Analysis ➞ | |
 | C Citigroup Inc. |
| Sector: Financials | |
| SubSector: Money Center Banks | |
| MarketCap: 94128 Millions | |
| Recent Price: 61.54 Smart Investing & Trading Score: 53 | |
| Day Percent Change: 0.31% Day Change: 0.19 | |
| Week Change: -1.79% Year-to-date Change: 19.6% | |
| C Links: Profile News Message Board | |
| Charts:- Daily , Weekly | |
| Add C to Watchlist: View: Get Complete C Trend Analysis ➞ | |
 | NKE NIKE, Inc. |
| Sector: Consumer Staples | |
| SubSector: Textile - Apparel Footwear & Accessories | |
| MarketCap: 118918 Millions | |
| Recent Price: 92.41 Smart Investing & Trading Score: 35 | |
| Day Percent Change: 2.29% Day Change: 2.07 | |
| Week Change: -1.82% Year-to-date Change: -14.9% | |
| NKE Links: Profile News Message Board | |
| Charts:- Daily , Weekly | |
| Add NKE to Watchlist: View: Get Complete NKE Trend Analysis ➞ | |
 | VZ Verizon Communications Inc. |
| Sector: Technology | |
| SubSector: Telecom Services - Domestic | |
| MarketCap: 229427 Millions | |
| Recent Price: 38.93 Smart Investing & Trading Score: 0 | |
| Day Percent Change: -0.69% Day Change: -0.27 | |
| Week Change: -1.89% Year-to-date Change: 3.3% | |
| VZ Links: Profile News Message Board | |
| Charts:- Daily , Weekly | |
| Add VZ to Watchlist: View: Get Complete VZ Trend Analysis ➞ | |
 | ORCL Oracle Corporation |
| Sector: Technology | |
| SubSector: Application Software | |
| MarketCap: 164530 Millions | |
| Recent Price: 114.96 Smart Investing & Trading Score: 43 | |
| Day Percent Change: 0.29% Day Change: 0.33 | |
| Week Change: -1.92% Year-to-date Change: 9.0% | |
| ORCL Links: Profile News Message Board | |
| Charts:- Daily , Weekly | |
| Add ORCL to Watchlist: View: Get Complete ORCL Trend Analysis ➞ | |
 | MSFT Microsoft Corporation |
| Sector: Technology | |
| SubSector: Business Software & Services | |
| MarketCap: 1154150 Millions | |
| Recent Price: 397.84 Smart Investing & Trading Score: 10 | |
| Day Percent Change: 0.73% Day Change: 2.90 | |
| Week Change: -2.09% Year-to-date Change: 5.8% | |
| MSFT Links: Profile News Message Board | |
| Charts:- Daily , Weekly | |
| Add MSFT to Watchlist: View: Get Complete MSFT Trend Analysis ➞ | |
| For tabular summary view of above stock list: Summary View ➞ 0 - 25 , 25 - 50 , 50 - 75 , 75 - 100 , 100 - 125 | ||
| Click To Change The Sort Order: By Market Cap or Company Size Performance: Year-to-date, Week and Day | |
| Select Chart Type: | ||
|
Best Stocks Today 12Stocks.com |
� 2024 12Stocks.com Terms & Conditions Privacy Contact Us
All Information Provided Only For Education And Not To Be Used For Investing or Trading. See Terms & Conditions


One More Thing ... Get Best Stocks Delivered Daily!
Never Ever Miss A Move With Our Top Ten Stocks Lists
Find Best Stocks In Any Market - Bull or Bear Market
Take A Peek At Our Top Ten Stocks Lists: Daily, Weekly, Year-to-Date & Top Trends
Find Best Stocks In Any Market - Bull or Bear Market
Take A Peek At Our Top Ten Stocks Lists: Daily, Weekly, Year-to-Date & Top Trends
S&P 100 Stocks With Best Up Trends [0-bearish to 100-bullish]: QUALCOMM [100], Pfizer [100], Colgate-Palmolive [100], Southern [100], NextEra Energy[100], American [95], Philip Morris[95], Charles Schwab[95], Procter & Gamble[95], 3M [88], Goldman Sachs[88]
Best S&P 100 Stocks Year-to-Date:
NVIDIA [73.29%], Eli Lilly[29.68%], General Electric[27.43%], Meta Platforms[24.81%], Walt Disney[24.73%], QUALCOMM [24.52%], General Motors[24.36%], American Express[24.11%], Amazon.com [21.57%], Wells Fargo[21.56%], Citi [19.63%] Best S&P 100 Stocks This Week:
Pfizer [9.06%], QUALCOMM [8.72%], Tesla [6.96%], Boeing [6.95%], 3M [5.42%], American [4.79%], American Tower[4.63%], NextEra Energy[4.33%], Amgen [3.12%], Eli Lilly[3.05%], Charter [2.9%] Best S&P 100 Stocks Daily:
QUALCOMM [9.74%], Boeing [4.31%], NVIDIA [3.34%], Amazon.com [3.20%], American [3.02%], Netflix [2.44%], Ford Motor[2.38%], NIKE [2.29%], Apple [2.20%], Deere & [2.18%], Walt Disney[1.94%]