
 Login Sign Up


| |||||
 |  | ||||

| 12Stocks.com Market Intelligence |
Best MidCap Stocks
|
| In a hurry? Mid Cap Stocks Lists: Performance Trends Table, Stock Charts
Sort midcap stocks: Daily, Weekly, Year-to-Date, Market Cap & Trends. Filter midcap stocks list by sector: Show all, Tech, Finance, Energy, Staples, Retail, Industrial, Materials, Utilities and HealthCare Filter midcap stocks list by size:All MidCap Large Mid-Range Small |
| 12Stocks.com Mid Cap Stocks Performances & Trends Daily | |||||||||
|
|  The overall Smart Investing & Trading Score is 85 (0-bearish to 100-bullish) which puts Mid Cap index in short term bullish trend. The Smart Investing & Trading Score from previous trading session is 45 and hence an improvement of trend.
| ||||||||
Here are the Smart Investing & Trading Scores of the most requested mid cap stocks at 12Stocks.com (click stock name for detailed review):
|


| 12Stocks.com: Top Performing Mid Cap Index Stocks | ||||||||||||||||||||||||||||||||||||||||||||||||
 The top performing Mid Cap Index stocks year to date are
Now, more recently, over last week, the top performing Mid Cap Index stocks on the move are


|
||||||||||||||||||||||||||||||||||||||||||||||||
| 12Stocks.com: Investing in Midcap Index with Stocks | |
|
The following table helps investors and traders sort through current performance and trends (as measured by Smart Investing & Trading Score) of various
stocks in the Midcap Index. Quick View: Move mouse or cursor over stock symbol (ticker) to view short-term technical chart and over stock name to view long term chart. Click on  to add stock symbol to your watchlist and to add stock symbol to your watchlist and  to view watchlist. Click on any ticker or stock name for detailed market intelligence report for that stock. to view watchlist. Click on any ticker or stock name for detailed market intelligence report for that stock. |
12Stocks.com Performance of Stocks in Midcap Index
| Ticker | Stock Name | Watchlist | Category | Recent Price | Smart Investing & Trading Score | Change % | YTD Change% |
| GWRE | Guidewire Software |   | Technology | 113.32 | 64 | 0.03% | 3.93% |
| MRCY | Mercury | | Technology | 29.04 | 64 | -1.02% | -20.59% |
| FWONK | Formula One | | Services & Goods | 70.55 | 64 | -0.47% | 11.75% |
| FWONA | Formula One | | Services & Goods | 62.89 | 64 | -0.36% | 8.47% |
| SON | Sonoco Products | | Consumer Staples | 56.80 | 63 | 2.14% | 1.66% |
| AYI | Acuity | | Technology | 254.41 | 63 | 1.57% | 24.21% |
| DXCM | DexCom | | Health Care | 128.37 | 63 | 1.36% | 3.45% |
| OMF | OneMain | | Financials | 51.20 | 63 | 0.77% | 4.07% |
| SPOT | Spotify | | Services & Goods | 296.07 | 63 | 0.65% | 57.56% |
| COIN | Coinbase Global | | Financials | 223.25 | 63 | 0.38% | 29.20% |
| DPZ | Domino s | | Services & Goods | 514.33 | 63 | 0.32% | 24.77% |
| FRT | Federal Realty | | Financials | 102.01 | 63 | -2.76% | -1.01% |
| ES | Eversource Energy | | Utilities | 60.01 | 63 | -1.22% | -2.77% |
| SPR | Spirit Aero | | Industrials | 32.93 | 63 | -0.27% | 3.62% |
| WDC | Western Digital | | Technology | 70.95 | 63 | 1.76% | 35.48% |
| DHI | D.R. Horton | | Industrials | 148.48 | 62 | 2.08% | -2.30% |
| TTWO | Take-Two Interactive | | Technology | 145.88 | 62 | 1.96% | -9.36% |
| LEN | Lennar | | Industrials | 158.10 | 62 | 1.86% | 6.08% |
| OLN | Olin | | Materials | 53.63 | 62 | 0.64% | -0.59% |
| VFC | V.F | | Consumer Staples | 12.61 | 62 | 0.40% | -32.93% |
| ON | ON Semiconductor | | Technology | 70.37 | 62 | 0.51% | -15.75% |
| ASH | Ashland Global | | Materials | 95.85 | 61 | 0.06% | 13.69% |
| RRC | Range Resources | | Energy | 35.71 | 61 | 2.06% | 17.31% |
| FANG | Diamondback Energy | | Energy | 201.50 | 61 | 1.96% | 29.93% |
| OMC | Omnicom | | Services & Goods | 92.75 | 61 | 0.13% | 7.21% |
| For chart view version of above stock list: Chart View ➞ 0 - 25 , 25 - 50 , 50 - 75 , 75 - 100 , 100 - 125 , 125 - 150 , 150 - 175 , 175 - 200 , 200 - 225 , 225 - 250 , 250 - 275 , 275 - 300 , 300 - 325 , 325 - 350 , 350 - 375 , 375 - 400 , 400 - 425 , 425 - 450 , 450 - 475 , 475 - 500 , 500 - 525 , 525 - 550 , 550 - 575 , 575 - 600 , 600 - 625 , 625 - 650 , 650 - 675 , 675 - 700 , 700 - 725 , 725 - 750 , 750 - 775 | ||
 | Click To Change The Sort Order: By Market Cap or Company Size Performance: Year-to-date, Week and Day |  |
|
Get the most comprehensive stock market coverage daily at 12Stocks.com ➞ Best Stocks Today ➞ Best Stocks Weekly ➞ Best Stocks Year-to-Date ➞ Best Stocks Trends ➞  Best Stocks Today 12Stocks.com Best Nasdaq Stocks ➞ Best S&P 500 Stocks ➞ Best Tech Stocks ➞ Best Biotech Stocks ➞ |
| Detailed Overview of Midcap Stocks |
| Midcap Technical Overview, Leaders & Laggards, Top Midcap ETF Funds & Detailed Midcap Stocks List, Charts, Trends & More |
| Midcap: Technical Analysis, Trends & YTD Performance | |
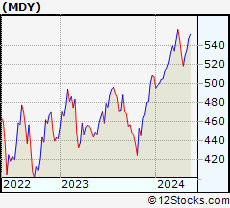
| MidCap segment as represented by
MDY, an exchange-traded fund [ETF], holds basket of about four hundred midcap stocks from across all major sectors of the US stock market. The midcap index (contains stocks like Green Mountain Coffee Roasters and Tractor Supply Company) is up by 5.52% and is currently underperforming the overall market by -1.36% year-to-date. Below is a quick view of technical charts and trends: | |
 MDY Weekly Chart |
|
| Long Term Trend: Good | |
| Medium Term Trend: Good | |
 MDY Daily Chart |
|
| Short Term Trend: Very Good | |
| Overall Trend Score: 85 | |
| YTD Performance: 5.52% | |
| **Trend Scores & Views Are Only For Educational Purposes And Not For Investing | |
| 12Stocks.com: Investing in Midcap Index using Exchange Traded Funds | |
|
The following table shows list of key exchange traded funds (ETF) that
help investors track Midcap index. The following list also includes leveraged ETF funds that track twice or thrice the daily returns of Midcap indices. Short or inverse ETF funds move in the opposite direction to the index they track and are useful during market pullbacks or during bear markets. Quick View: Move mouse or cursor over ETF symbol (ticker) to view short-term technical chart and over ETF name to view long term chart. Click on ticker or stock name for detailed view. Click on to add stock symbol to your watchlist and to view watchlist. |
12Stocks.com List of ETFs that track Midcap Index
| Ticker | ETF Name | Watchlist | Recent Price | Smart Investing & Trading Score | Change % | Week % | Year-to-date % |
| IJH | iShares Core S&P Mid-Cap | | 58.53 | 85 | 1.05 | 1.23 | 5.59% |
| IWR | iShares Russell Mid-Cap | | 80.78 | 60 | 0.72 | 0.32 | 3.92% |
| MDY | SPDR S&P MidCap 400 ETF | | 535.41 | 85 | 1.01 | 1.14 | 5.52% |
| IWP | iShares Russell Mid-Cap Growth | | 108.75 | 39 | 0.54 | -0.21 | 4.11% |
| IJK | iShares S&P Mid-Cap 400 Growth | | 87.89 | 78 | 1.02 | 1.02 | 10.94% |
| IWS | iShares Russell Mid-Cap Value | | 120.70 | 78 | 0.80 | 0.59 | 3.79% |
| IJJ | iShares S&P Mid-Cap 400 Value | | 113.77 | 90 | 0.96 | 1.37 | -0.24% |
| XMLV | PowerShares S&P MidCap Low Volatil ETF | | 55.50 | 100 | 0.62 | 1.56 | 4.36% |
| SMDD | ProShares UltraPro Short MidCap400 | | 11.45 | 10 | -2.82 | -3.23 | -14.97% |
| MVV | ProShares Ultra MidCap400 | | 62.72 | 85 | 2.37 | 2.1 | 8.34% |
| UMDD | ProShares UltraPro MidCap400 | | 24.68 | 85 | 3.08 | 3 | 10.56% |
| MYY | ProShares Short MidCap400 | | 20.57 | 28 | -0.76 | -1.04 | -4.11% |
| MZZ | ProShares UltraShort MidCap400 | | 11.46 | 20 | -2.05 | -1.88 | -8.84% |
| 12Stocks.com: Charts, Trends, Fundamental Data and Performances of MidCap Stocks | |
|
We now take in-depth look at all MidCap stocks including charts, multi-period performances and overall trends (as measured by Smart Investing & Trading Score). One can sort MidCap stocks (click link to choose) by Daily, Weekly and by Year-to-Date performances. Also, one can sort by size of the company or by market capitalization. |
| Select Your Default Chart Type: | |||||
| |||||
| Click on stock symbol or name for detailed view. Click on to add stock symbol to your watchlist and to view watchlist. Quick View: Move mouse or cursor over "Daily" to quickly view daily technical stock chart and over "Weekly" to view weekly technical stock chart. | |||||

 | GWRE Guidewire Software, Inc. |
| Sector: Technology | |
| SubSector: Business Software & Services | |
| MarketCap: 7073.18 Millions | |
| Recent Price: 113.32 Smart Investing & Trading Score: 64 | |
| Day Percent Change: 0.03% Day Change: 0.03 | |
| Week Change: -0.2% Year-to-date Change: 3.9% | |
| GWRE Links: Profile News Message Board | |
| Charts:- Daily , Weekly | |
| Add GWRE to Watchlist: View: Get Complete GWRE Trend Analysis ➞ | |
 | MRCY Mercury Systems, Inc. |
| Sector: Technology | |
| SubSector: Computer Peripherals | |
| MarketCap: 3797.09 Millions | |
| Recent Price: 29.04 Smart Investing & Trading Score: 64 | |
| Day Percent Change: -1.02% Day Change: -0.30 | |
| Week Change: -0.14% Year-to-date Change: -20.6% | |
| MRCY Links: Profile News Message Board | |
| Charts:- Daily , Weekly | |
| Add MRCY to Watchlist: View: Get Complete MRCY Trend Analysis ➞ | |
 | FWONK Formula One Group |
| Sector: Services & Goods | |
| SubSector: Broadcasting - TV | |
| MarketCap: 4677.53 Millions | |
| Recent Price: 70.55 Smart Investing & Trading Score: 64 | |
| Day Percent Change: -0.47% Day Change: -0.33 | |
| Week Change: 1.61% Year-to-date Change: 11.8% | |
| FWONK Links: Profile News Message Board | |
| Charts:- Daily , Weekly | |
| Add FWONK to Watchlist: View: Get Complete FWONK Trend Analysis ➞ | |
 | FWONA Formula One Group |
| Sector: Services & Goods | |
| SubSector: Broadcasting - TV | |
| MarketCap: 17485.6 Millions | |
| Recent Price: 62.89 Smart Investing & Trading Score: 64 | |
| Day Percent Change: -0.36% Day Change: -0.23 | |
| Week Change: 2.04% Year-to-date Change: 8.5% | |
| FWONA Links: Profile News Message Board | |
| Charts:- Daily , Weekly | |
| Add FWONA to Watchlist: View: Get Complete FWONA Trend Analysis ➞ | |
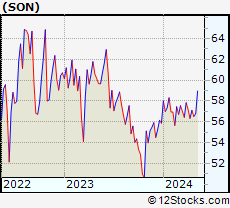 | SON Sonoco Products Company |
| Sector: Consumer Staples | |
| SubSector: Packaging & Containers | |
| MarketCap: 4564.33 Millions | |
| Recent Price: 56.80 Smart Investing & Trading Score: 63 | |
| Day Percent Change: 2.14% Day Change: 1.19 | |
| Week Change: 0.51% Year-to-date Change: 1.7% | |
| SON Links: Profile News Message Board | |
| Charts:- Daily , Weekly | |
| Add SON to Watchlist: View: Get Complete SON Trend Analysis ➞ | |
 | AYI Acuity Brands, Inc. |
| Sector: Technology | |
| SubSector: Diversified Electronics | |
| MarketCap: 3356.66 Millions | |
| Recent Price: 254.41 Smart Investing & Trading Score: 63 | |
| Day Percent Change: 1.57% Day Change: 3.94 | |
| Week Change: 0.89% Year-to-date Change: 24.2% | |
| AYI Links: Profile News Message Board | |
| Charts:- Daily , Weekly | |
| Add AYI to Watchlist: View: Get Complete AYI Trend Analysis ➞ | |
 | DXCM DexCom, Inc. |
| Sector: Health Care | |
| SubSector: Medical Laboratories & Research | |
| MarketCap: 19559 Millions | |
| Recent Price: 128.37 Smart Investing & Trading Score: 63 | |
| Day Percent Change: 1.36% Day Change: 1.72 | |
| Week Change: 3.24% Year-to-date Change: 3.5% | |
| DXCM Links: Profile News Message Board | |
| Charts:- Daily , Weekly | |
| Add DXCM to Watchlist: View: Get Complete DXCM Trend Analysis ➞ | |
 | OMF OneMain Holdings, Inc. |
| Sector: Financials | |
| SubSector: Credit Services | |
| MarketCap: 2753.38 Millions | |
| Recent Price: 51.20 Smart Investing & Trading Score: 63 | |
| Day Percent Change: 0.77% Day Change: 0.39 | |
| Week Change: 0.61% Year-to-date Change: 4.1% | |
| OMF Links: Profile News Message Board | |
| Charts:- Daily , Weekly | |
| Add OMF to Watchlist: View: Get Complete OMF Trend Analysis ➞ | |
 | SPOT Spotify Technology S.A. |
| Sector: Services & Goods | |
| SubSector: Broadcasting - Radio | |
| MarketCap: 24379.5 Millions | |
| Recent Price: 296.07 Smart Investing & Trading Score: 63 | |
| Day Percent Change: 0.65% Day Change: 1.90 | |
| Week Change: 2.24% Year-to-date Change: 57.6% | |
| SPOT Links: Profile News Message Board | |
| Charts:- Daily , Weekly | |
| Add SPOT to Watchlist: View: Get Complete SPOT Trend Analysis ➞ | |
 | COIN Coinbase Global, Inc. |
| Sector: Financials | |
| SubSector: Financial Data & Stock Exchanges | |
| MarketCap: 16390 Millions | |
| Recent Price: 223.25 Smart Investing & Trading Score: 63 | |
| Day Percent Change: 0.38% Day Change: 0.84 | |
| Week Change: -5.58% Year-to-date Change: 29.2% | |
| COIN Links: Profile News Message Board | |
| Charts:- Daily , Weekly | |
| Add COIN to Watchlist: View: Get Complete COIN Trend Analysis ➞ | |
 | DPZ Domino s Pizza, Inc. |
| Sector: Services & Goods | |
| SubSector: Restaurants | |
| MarketCap: 12166 Millions | |
| Recent Price: 514.33 Smart Investing & Trading Score: 63 | |
| Day Percent Change: 0.32% Day Change: 1.63 | |
| Week Change: 3.06% Year-to-date Change: 24.8% | |
| DPZ Links: Profile News Message Board | |
| Charts:- Daily , Weekly | |
| Add DPZ to Watchlist: View: Get Complete DPZ Trend Analysis ➞ | |
 | FRT Federal Realty Investment Trust |
| Sector: Financials | |
| SubSector: REIT - Retail | |
| MarketCap: 5878.64 Millions | |
| Recent Price: 102.01 Smart Investing & Trading Score: 63 | |
| Day Percent Change: -2.76% Day Change: -2.90 | |
| Week Change: -0.18% Year-to-date Change: -1.0% | |
| FRT Links: Profile News Message Board | |
| Charts:- Daily , Weekly | |
| Add FRT to Watchlist: View: Get Complete FRT Trend Analysis ➞ | |
 | ES Eversource Energy |
| Sector: Utilities | |
| SubSector: Diversified Utilities | |
| MarketCap: 23963.4 Millions | |
| Recent Price: 60.01 Smart Investing & Trading Score: 63 | |
| Day Percent Change: -1.22% Day Change: -0.74 | |
| Week Change: 0.92% Year-to-date Change: -2.8% | |
| ES Links: Profile News Message Board | |
| Charts:- Daily , Weekly | |
| Add ES to Watchlist: View: Get Complete ES Trend Analysis ➞ | |
 | SPR Spirit AeroSystems Holdings, Inc. |
| Sector: Industrials | |
| SubSector: Aerospace/Defense Products & Services | |
| MarketCap: 2283.01 Millions | |
| Recent Price: 32.93 Smart Investing & Trading Score: 63 | |
| Day Percent Change: -0.27% Day Change: -0.09 | |
| Week Change: 1.35% Year-to-date Change: 3.6% | |
| SPR Links: Profile News Message Board | |
| Charts:- Daily , Weekly | |
| Add SPR to Watchlist: View: Get Complete SPR Trend Analysis ➞ | |
 | WDC Western Digital Corporation |
| Sector: Technology | |
| SubSector: Data Storage Devices | |
| MarketCap: 10712.9 Millions | |
| Recent Price: 70.95 Smart Investing & Trading Score: 63 | |
| Day Percent Change: 1.76% Day Change: 1.23 | |
| Week Change: -0.57% Year-to-date Change: 35.5% | |
| WDC Links: Profile News Message Board | |
| Charts:- Daily , Weekly | |
| Add WDC to Watchlist: View: Get Complete WDC Trend Analysis ➞ | |
 | DHI D.R. Horton, Inc. |
| Sector: Industrials | |
| SubSector: Residential Construction | |
| MarketCap: 13372.6 Millions | |
| Recent Price: 148.48 Smart Investing & Trading Score: 62 | |
| Day Percent Change: 2.08% Day Change: 3.02 | |
| Week Change: 2.17% Year-to-date Change: -2.3% | |
| DHI Links: Profile News Message Board | |
| Charts:- Daily , Weekly | |
| Add DHI to Watchlist: View: Get Complete DHI Trend Analysis ➞ | |
 | TTWO Take-Two Interactive Software, Inc. |
| Sector: Technology | |
| SubSector: Multimedia & Graphics Software | |
| MarketCap: 12479.6 Millions | |
| Recent Price: 145.88 Smart Investing & Trading Score: 62 | |
| Day Percent Change: 1.96% Day Change: 2.81 | |
| Week Change: 0.98% Year-to-date Change: -9.4% | |
| TTWO Links: Profile News Message Board | |
| Charts:- Daily , Weekly | |
| Add TTWO to Watchlist: View: Get Complete TTWO Trend Analysis ➞ | |
 | LEN Lennar Corporation |
| Sector: Industrials | |
| SubSector: Residential Construction | |
| MarketCap: 11926.6 Millions | |
| Recent Price: 158.10 Smart Investing & Trading Score: 62 | |
| Day Percent Change: 1.86% Day Change: 2.89 | |
| Week Change: 2.47% Year-to-date Change: 6.1% | |
| LEN Links: Profile News Message Board | |
| Charts:- Daily , Weekly | |
| Add LEN to Watchlist: View: Get Complete LEN Trend Analysis ➞ | |
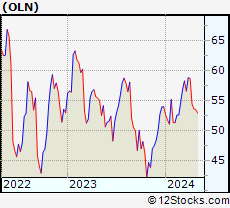 | OLN Olin Corporation |
| Sector: Materials | |
| SubSector: Specialty Chemicals | |
| MarketCap: 2126.87 Millions | |
| Recent Price: 53.63 Smart Investing & Trading Score: 62 | |
| Day Percent Change: 0.64% Day Change: 0.34 | |
| Week Change: 0.28% Year-to-date Change: -0.6% | |
| OLN Links: Profile News Message Board | |
| Charts:- Daily , Weekly | |
| Add OLN to Watchlist: View: Get Complete OLN Trend Analysis ➞ | |
 | VFC V.F. Corporation |
| Sector: Consumer Staples | |
| SubSector: Textile - Apparel Clothing | |
| MarketCap: 23607.5 Millions | |
| Recent Price: 12.61 Smart Investing & Trading Score: 62 | |
| Day Percent Change: 0.40% Day Change: 0.05 | |
| Week Change: -0.24% Year-to-date Change: -32.9% | |
| VFC Links: Profile News Message Board | |
| Charts:- Daily , Weekly | |
| Add VFC to Watchlist: View: Get Complete VFC Trend Analysis ➞ | |
 | ON ON Semiconductor Corporation |
| Sector: Technology | |
| SubSector: Semiconductor - Broad Line | |
| MarketCap: 5183.82 Millions | |
| Recent Price: 70.37 Smart Investing & Trading Score: 62 | |
| Day Percent Change: 0.51% Day Change: 0.36 | |
| Week Change: 3.39% Year-to-date Change: -15.8% | |
| ON Links: Profile News Message Board | |
| Charts:- Daily , Weekly | |
| Add ON to Watchlist: View: Get Complete ON Trend Analysis ➞ | |
 | ASH Ashland Global Holdings Inc. |
| Sector: Materials | |
| SubSector: Chemicals - Major Diversified | |
| MarketCap: 2764.16 Millions | |
| Recent Price: 95.85 Smart Investing & Trading Score: 61 | |
| Day Percent Change: 0.06% Day Change: 0.06 | |
| Week Change: -0.22% Year-to-date Change: 13.7% | |
| ASH Links: Profile News Message Board | |
| Charts:- Daily , Weekly | |
| Add ASH to Watchlist: View: Get Complete ASH Trend Analysis ➞ | |
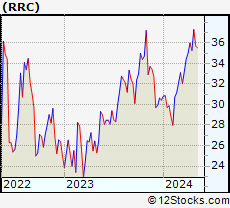 | RRC Range Resources Corporation |
| Sector: Energy | |
| SubSector: Independent Oil & Gas | |
| MarketCap: 728.093 Millions | |
| Recent Price: 35.71 Smart Investing & Trading Score: 61 | |
| Day Percent Change: 2.06% Day Change: 0.72 | |
| Week Change: -4.29% Year-to-date Change: 17.3% | |
| RRC Links: Profile News Message Board | |
| Charts:- Daily , Weekly | |
| Add RRC to Watchlist: View: Get Complete RRC Trend Analysis ➞ | |
 | FANG Diamondback Energy, Inc. |
| Sector: Energy | |
| SubSector: Independent Oil & Gas | |
| MarketCap: 3009.13 Millions | |
| Recent Price: 201.50 Smart Investing & Trading Score: 61 | |
| Day Percent Change: 1.96% Day Change: 3.87 | |
| Week Change: -3.01% Year-to-date Change: 29.9% | |
| FANG Links: Profile News Message Board | |
| Charts:- Daily , Weekly | |
| Add FANG to Watchlist: View: Get Complete FANG Trend Analysis ➞ | |
 | OMC Omnicom Group Inc. |
| Sector: Services & Goods | |
| SubSector: Advertising Agencies | |
| MarketCap: 11813.5 Millions | |
| Recent Price: 92.75 Smart Investing & Trading Score: 61 | |
| Day Percent Change: 0.13% Day Change: 0.12 | |
| Week Change: -3.27% Year-to-date Change: 7.2% | |
| OMC Links: Profile News Message Board | |
| Charts:- Daily , Weekly | |
| Add OMC to Watchlist: View: Get Complete OMC Trend Analysis ➞ | |
| For tabular summary view of above stock list: Summary View ➞ 0 - 25 , 25 - 50 , 50 - 75 , 75 - 100 , 100 - 125 , 125 - 150 , 150 - 175 , 175 - 200 , 200 - 225 , 225 - 250 , 250 - 275 , 275 - 300 , 300 - 325 , 325 - 350 , 350 - 375 , 375 - 400 , 400 - 425 , 425 - 450 , 450 - 475 , 475 - 500 , 500 - 525 , 525 - 550 , 550 - 575 , 575 - 600 , 600 - 625 , 625 - 650 , 650 - 675 , 675 - 700 , 700 - 725 , 725 - 750 , 750 - 775 | ||
| Click To Change The Sort Order: By Market Cap or Company Size Performance: Year-to-date, Week and Day | |
| Select Chart Type: | ||
|
Best Stocks Today 12Stocks.com |
© 2024 12Stocks.com Terms & Conditions Privacy Contact Us
All Information Provided Only For Education And Not To Be Used For Investing or Trading. See Terms & Conditions


One More Thing ... Get Best Stocks Delivered Daily!
Never Ever Miss A Move With Our Top Ten Stocks Lists
Find Best Stocks In Any Market - Bull or Bear Market
Take A Peek At Our Top Ten Stocks Lists: Daily, Weekly, Year-to-Date & Top Trends
Find Best Stocks In Any Market - Bull or Bear Market
Take A Peek At Our Top Ten Stocks Lists: Daily, Weekly, Year-to-Date & Top Trends
Midcap Stocks With Best Up Trends [0-bearish to 100-bullish]: GameStop [100], Tandem Diabetes[100], MasTec [100], Frontier [100], Organon [100], First Solar[100], Reinsurance [100], Brookfield Renewable[100], Camden Property[100], Aptiv [100], Texas Roadhouse[100]
Best Midcap Stocks Year-to-Date:
Vistra Energy[111.55%], AppLovin [88.57%], ShockWave Medical[73.37%], EMCOR [68.86%], Constellation Energy[66.35%], CAVA [65.92%], Tenet [59.16%], Spotify [57.56%], Natera [54.82%], Wingstop [51.43%], Tandem Diabetes[51.18%] Best Midcap Stocks This Week:
GameStop [38.4%], Tandem Diabetes[26.9%], Tenet [25.12%], Wayfair [22.26%], Brookfield Renewable[21.71%], Bio-Techne [20.65%], Pinterest [18.99%], New York[18.86%], Olaplex [18.28%], Valmont Industries[17.25%], NovoCure [16.98%] Best Midcap Stocks Daily:
GameStop [29.08%], Tandem Diabetes[22.32%], Ginkgo Bioworks[12.33%], Paylocity Holding[12.05%], MasTec [11.87%], Plug Power[11.84%], Peloton Interactive[9.42%], Universal Display[9.28%], Sunrun [8.68%], Frontier [8.66%], Wayfair [8.44%]