
 Login Sign Up


| |||||
 |  | ||||

| 12Stocks.com Market Intelligence |
Best MidCap Stocks
|
| In a hurry? Mid Cap Stocks Lists: Performance Trends Table, Stock Charts
Sort midcap stocks: Daily, Weekly, Year-to-Date, Market Cap & Trends. Filter midcap stocks list by sector: Show all, Tech, Finance, Energy, Staples, Retail, Industrial, Materials, Utilities and HealthCare Filter midcap stocks list by size:All MidCap Large Mid-Range Small |
| 12Stocks.com Mid Cap Stocks Performances & Trends Daily | |||||||||
|
|  The overall Smart Investing & Trading Score is 85 (0-bearish to 100-bullish) which puts Mid Cap index in short term bullish trend. The Smart Investing & Trading Score from previous trading session is 45 and hence an improvement of trend.
| ||||||||
Here are the Smart Investing & Trading Scores of the most requested mid cap stocks at 12Stocks.com (click stock name for detailed review):
|


| 12Stocks.com: Top Performing Mid Cap Index Stocks | ||||||||||||||||||||||||||||||||||||||||||||||||
 The top performing Mid Cap Index stocks year to date are
Now, more recently, over last week, the top performing Mid Cap Index stocks on the move are


|
||||||||||||||||||||||||||||||||||||||||||||||||
| 12Stocks.com: Investing in Midcap Index with Stocks | |
|
The following table helps investors and traders sort through current performance and trends (as measured by Smart Investing & Trading Score) of various
stocks in the Midcap Index. Quick View: Move mouse or cursor over stock symbol (ticker) to view short-term technical chart and over stock name to view long term chart. Click on  to add stock symbol to your watchlist and to add stock symbol to your watchlist and  to view watchlist. Click on any ticker or stock name for detailed market intelligence report for that stock. to view watchlist. Click on any ticker or stock name for detailed market intelligence report for that stock. |
12Stocks.com Performance of Stocks in Midcap Index
| Ticker | Stock Name | Watchlist | Category | Recent Price | Smart Investing & Trading Score | Change % | YTD Change% |
| INSP | Inspire Medical |   | Technology | 249.72 | 100 | -0.59% | 22.75% |
| PINS | | Industrials | 40.41 | 100 | -0.22% | 9.10% | |
| IFF | Flavors | | Materials | 86.64 | 100 | -0.20% | 7.00% |
| W | Wayfair | | Services & Goods | 63.59 | 95 | 8.44% | 3.06% |
| NU | Nu | | Financials | 11.69 | 95 | 6.13% | 40.17% |
| NTAP | NetApp | | Technology | 104.64 | 95 | 2.47% | 18.69% |
| J | Jacobs Engineering | | Services & Goods | 148.10 | 95 | 2.19% | 14.10% |
| NRG | NRG Energy | | Utilities | 76.65 | 95 | 2.02% | 48.26% |
| CARR | Carrier Global | | Industrials | 62.09 | 95 | 1.89% | 8.08% |
| EWBC | East West | | Financials | 76.64 | 95 | 1.87% | 6.52% |
| JHG | Janus Henderson | | Financials | 32.55 | 95 | 1.85% | 7.96% |
| WING | Wingstop | | Services & Goods | 388.55 | 95 | 1.84% | 51.43% |
| DOCU | DocuSign | | Technology | 59.80 | 95 | 1.77% | 0.59% |
| TDG | TransDigm | | Industrials | 1293.80 | 95 | 1.73% | 27.90% |
| CR | Crane Co | | Industrials | 142.95 | 95 | 1.04% | 21.00% |
| HLI | Houlihan Lokey | | Financials | 131.90 | 95 | 1.03% | 10.00% |
| TYL | Tyler Technologies | | Technology | 469.00 | 95 | 0.98% | 12.17% |
| CACI | CACI | | Technology | 414.95 | 95 | 0.97% | 28.13% |
| OC | Owens Corning | | Industrials | 174.81 | 95 | 0.96% | 17.93% |
| AVY | Avery Dennison | | Consumer Staples | 221.55 | 95 | 0.93% | 9.59% |
| BPOP | Popular | | Financials | 88.85 | 95 | 0.91% | 8.26% |
| PB | Prosperity Bancshares | | Financials | 63.07 | 95 | 0.88% | -6.88% |
| SYF | Synchrony Financial | | Financials | 45.60 | 95 | 0.77% | 19.40% |
| HEI | HEICO | | Industrials | 211.36 | 95 | 0.63% | 18.16% |
| TWLO | Twilio | | Technology | 61.89 | 95 | 0.60% | -18.43% |
| For chart view version of above stock list: Chart View ➞ 0 - 25 , 25 - 50 , 50 - 75 , 75 - 100 , 100 - 125 , 125 - 150 , 150 - 175 , 175 - 200 , 200 - 225 , 225 - 250 , 250 - 275 , 275 - 300 , 300 - 325 , 325 - 350 , 350 - 375 , 375 - 400 , 400 - 425 , 425 - 450 , 450 - 475 , 475 - 500 , 500 - 525 , 525 - 550 , 550 - 575 , 575 - 600 , 600 - 625 , 625 - 650 , 650 - 675 , 675 - 700 , 700 - 725 , 725 - 750 , 750 - 775 | ||
 | Click To Change The Sort Order: By Market Cap or Company Size Performance: Year-to-date, Week and Day |  |
|
Get the most comprehensive stock market coverage daily at 12Stocks.com ➞ Best Stocks Today ➞ Best Stocks Weekly ➞ Best Stocks Year-to-Date ➞ Best Stocks Trends ➞  Best Stocks Today 12Stocks.com Best Nasdaq Stocks ➞ Best S&P 500 Stocks ➞ Best Tech Stocks ➞ Best Biotech Stocks ➞ |
| Detailed Overview of Midcap Stocks |
| Midcap Technical Overview, Leaders & Laggards, Top Midcap ETF Funds & Detailed Midcap Stocks List, Charts, Trends & More |
| Midcap: Technical Analysis, Trends & YTD Performance | |
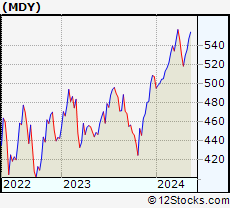
| MidCap segment as represented by
MDY, an exchange-traded fund [ETF], holds basket of about four hundred midcap stocks from across all major sectors of the US stock market. The midcap index (contains stocks like Green Mountain Coffee Roasters and Tractor Supply Company) is up by 5.52% and is currently underperforming the overall market by -1.36% year-to-date. Below is a quick view of technical charts and trends: | |
 MDY Weekly Chart |
|
| Long Term Trend: Good | |
| Medium Term Trend: Good | |
 MDY Daily Chart |
|
| Short Term Trend: Very Good | |
| Overall Trend Score: 85 | |
| YTD Performance: 5.52% | |
| **Trend Scores & Views Are Only For Educational Purposes And Not For Investing | |
| 12Stocks.com: Investing in Midcap Index using Exchange Traded Funds | |
|
The following table shows list of key exchange traded funds (ETF) that
help investors track Midcap index. The following list also includes leveraged ETF funds that track twice or thrice the daily returns of Midcap indices. Short or inverse ETF funds move in the opposite direction to the index they track and are useful during market pullbacks or during bear markets. Quick View: Move mouse or cursor over ETF symbol (ticker) to view short-term technical chart and over ETF name to view long term chart. Click on ticker or stock name for detailed view. Click on to add stock symbol to your watchlist and to view watchlist. |
12Stocks.com List of ETFs that track Midcap Index
| Ticker | ETF Name | Watchlist | Recent Price | Smart Investing & Trading Score | Change % | Week % | Year-to-date % |
| IJH | iShares Core S&P Mid-Cap | | 58.53 | 85 | 1.05 | 1.23 | 5.59% |
| IWR | iShares Russell Mid-Cap | | 80.78 | 60 | 0.72 | 0.32 | 3.92% |
| MDY | SPDR S&P MidCap 400 ETF | | 535.41 | 85 | 1.01 | 1.14 | 5.52% |
| IWP | iShares Russell Mid-Cap Growth | | 108.75 | 39 | 0.54 | -0.21 | 4.11% |
| IJK | iShares S&P Mid-Cap 400 Growth | | 87.89 | 78 | 1.02 | 1.02 | 10.94% |
| IWS | iShares Russell Mid-Cap Value | | 120.70 | 78 | 0.80 | 0.59 | 3.79% |
| IJJ | iShares S&P Mid-Cap 400 Value | | 113.77 | 90 | 0.96 | 1.37 | -0.24% |
| XMLV | PowerShares S&P MidCap Low Volatil ETF | | 55.50 | 100 | 0.62 | 1.56 | 4.36% |
| SMDD | ProShares UltraPro Short MidCap400 | | 11.45 | 10 | -2.82 | -3.23 | -14.97% |
| MVV | ProShares Ultra MidCap400 | | 62.72 | 85 | 2.37 | 2.1 | 8.34% |
| UMDD | ProShares UltraPro MidCap400 | | 24.68 | 85 | 3.08 | 3 | 10.56% |
| MYY | ProShares Short MidCap400 | | 20.57 | 28 | -0.76 | -1.04 | -4.11% |
| MZZ | ProShares UltraShort MidCap400 | | 11.46 | 20 | -2.05 | -1.88 | -8.84% |
| 12Stocks.com: Charts, Trends, Fundamental Data and Performances of MidCap Stocks | |
|
We now take in-depth look at all MidCap stocks including charts, multi-period performances and overall trends (as measured by Smart Investing & Trading Score). One can sort MidCap stocks (click link to choose) by Daily, Weekly and by Year-to-Date performances. Also, one can sort by size of the company or by market capitalization. |
| Select Your Default Chart Type: | |||||
| |||||
| Click on stock symbol or name for detailed view. Click on to add stock symbol to your watchlist and to view watchlist. Quick View: Move mouse or cursor over "Daily" to quickly view daily technical stock chart and over "Weekly" to view weekly technical stock chart. | |||||

 | INSP Inspire Medical Systems, Inc. |
| Sector: Technology | |
| SubSector: Internet Information Providers | |
| MarketCap: 1239.8 Millions | |
| Recent Price: 249.72 Smart Investing & Trading Score: 100 | |
| Day Percent Change: -0.59% Day Change: -1.47 | |
| Week Change: 5.17% Year-to-date Change: 22.8% | |
| INSP Links: Profile News Message Board | |
| Charts:- Daily , Weekly | |
| Add INSP to Watchlist: View: Get Complete INSP Trend Analysis ➞ | |
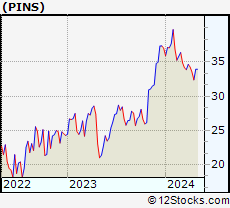 | PINS Pinterest, Inc. |
| Sector: Industrials | |
| SubSector: Conglomerates | |
| MarketCap: 8115.78 Millions | |
| Recent Price: 40.41 Smart Investing & Trading Score: 100 | |
| Day Percent Change: -0.22% Day Change: -0.09 | |
| Week Change: 18.99% Year-to-date Change: 9.1% | |
| PINS Links: Profile News Message Board | |
| Charts:- Daily , Weekly | |
| Add PINS to Watchlist: View: Get Complete PINS Trend Analysis ➞ | |
 | IFF International Flavors & Fragrances Inc. |
| Sector: Materials | |
| SubSector: Specialty Chemicals | |
| MarketCap: 12178.7 Millions | |
| Recent Price: 86.64 Smart Investing & Trading Score: 100 | |
| Day Percent Change: -0.20% Day Change: -0.17 | |
| Week Change: 2.4% Year-to-date Change: 7.0% | |
| IFF Links: Profile News Message Board | |
| Charts:- Daily , Weekly | |
| Add IFF to Watchlist: View: Get Complete IFF Trend Analysis ➞ | |
 | W Wayfair Inc. |
| Sector: Services & Goods | |
| SubSector: Catalog & Mail Order Houses | |
| MarketCap: 3497.02 Millions | |
| Recent Price: 63.59 Smart Investing & Trading Score: 95 | |
| Day Percent Change: 8.44% Day Change: 4.95 | |
| Week Change: 22.26% Year-to-date Change: 3.1% | |
| W Links: Profile News Message Board | |
| Charts:- Daily , Weekly | |
| Add W to Watchlist: View: Get Complete W Trend Analysis ➞ | |
 | NU Nu Holdings Ltd. |
| Sector: Financials | |
| SubSector: Banks - Diversified | |
| MarketCap: 37240 Millions | |
| Recent Price: 11.69 Smart Investing & Trading Score: 95 | |
| Day Percent Change: 6.13% Day Change: 0.67 | |
| Week Change: 5.79% Year-to-date Change: 40.2% | |
| NU Links: Profile News Message Board | |
| Charts:- Daily , Weekly | |
| Add NU to Watchlist: View: Get Complete NU Trend Analysis ➞ | |
 | NTAP NetApp, Inc. |
| Sector: Technology | |
| SubSector: Data Storage Devices | |
| MarketCap: 9028.89 Millions | |
| Recent Price: 104.64 Smart Investing & Trading Score: 95 | |
| Day Percent Change: 2.47% Day Change: 2.52 | |
| Week Change: 3.27% Year-to-date Change: 18.7% | |
| NTAP Links: Profile News Message Board | |
| Charts:- Daily , Weekly | |
| Add NTAP to Watchlist: View: Get Complete NTAP Trend Analysis ➞ | |
 | J Jacobs Engineering Group Inc. |
| Sector: Services & Goods | |
| SubSector: Technical Services | |
| MarketCap: 9714.8 Millions | |
| Recent Price: 148.10 Smart Investing & Trading Score: 95 | |
| Day Percent Change: 2.19% Day Change: 3.17 | |
| Week Change: 2.2% Year-to-date Change: 14.1% | |
| J Links: Profile News Message Board | |
| Charts:- Daily , Weekly | |
| Add J to Watchlist: View: Get Complete J Trend Analysis ➞ | |
 | NRG NRG Energy, Inc. |
| Sector: Utilities | |
| SubSector: Diversified Utilities | |
| MarketCap: 6510.7 Millions | |
| Recent Price: 76.65 Smart Investing & Trading Score: 95 | |
| Day Percent Change: 2.02% Day Change: 1.52 | |
| Week Change: 5.27% Year-to-date Change: 48.3% | |
| NRG Links: Profile News Message Board | |
| Charts:- Daily , Weekly | |
| Add NRG to Watchlist: View: Get Complete NRG Trend Analysis ➞ | |
 | CARR Carrier Global Corporation |
| Sector: Industrials | |
| SubSector: Building Products & Equipment | |
| MarketCap: 32547 Millions | |
| Recent Price: 62.09 Smart Investing & Trading Score: 95 | |
| Day Percent Change: 1.89% Day Change: 1.15 | |
| Week Change: 2.63% Year-to-date Change: 8.1% | |
| CARR Links: Profile News Message Board | |
| Charts:- Daily , Weekly | |
| Add CARR to Watchlist: View: Get Complete CARR Trend Analysis ➞ | |
 | EWBC East West Bancorp, Inc. |
| Sector: Financials | |
| SubSector: Foreign Money Center Banks | |
| MarketCap: 4618.31 Millions | |
| Recent Price: 76.64 Smart Investing & Trading Score: 95 | |
| Day Percent Change: 1.87% Day Change: 1.41 | |
| Week Change: 0.87% Year-to-date Change: 6.5% | |
| EWBC Links: Profile News Message Board | |
| Charts:- Daily , Weekly | |
| Add EWBC to Watchlist: View: Get Complete EWBC Trend Analysis ➞ | |
 | JHG Janus Henderson Group plc |
| Sector: Financials | |
| SubSector: Asset Management | |
| MarketCap: 2992.33 Millions | |
| Recent Price: 32.55 Smart Investing & Trading Score: 95 | |
| Day Percent Change: 1.85% Day Change: 0.59 | |
| Week Change: 2.71% Year-to-date Change: 8.0% | |
| JHG Links: Profile News Message Board | |
| Charts:- Daily , Weekly | |
| Add JHG to Watchlist: View: Get Complete JHG Trend Analysis ➞ | |
 | WING Wingstop Inc. |
| Sector: Services & Goods | |
| SubSector: Restaurants | |
| MarketCap: 1744.7 Millions | |
| Recent Price: 388.55 Smart Investing & Trading Score: 95 | |
| Day Percent Change: 1.84% Day Change: 7.01 | |
| Week Change: 1.57% Year-to-date Change: 51.4% | |
| WING Links: Profile News Message Board | |
| Charts:- Daily , Weekly | |
| Add WING to Watchlist: View: Get Complete WING Trend Analysis ➞ | |
 | DOCU DocuSign, Inc. |
| Sector: Technology | |
| SubSector: Business Software & Services | |
| MarketCap: 15618.8 Millions | |
| Recent Price: 59.80 Smart Investing & Trading Score: 95 | |
| Day Percent Change: 1.77% Day Change: 1.04 | |
| Week Change: 4.55% Year-to-date Change: 0.6% | |
| DOCU Links: Profile News Message Board | |
| Charts:- Daily , Weekly | |
| Add DOCU to Watchlist: View: Get Complete DOCU Trend Analysis ➞ | |
 | TDG TransDigm Group Incorporated |
| Sector: Industrials | |
| SubSector: Aerospace/Defense Products & Services | |
| MarketCap: 18441 Millions | |
| Recent Price: 1293.80 Smart Investing & Trading Score: 95 | |
| Day Percent Change: 1.73% Day Change: 22.02 | |
| Week Change: 2.75% Year-to-date Change: 27.9% | |
| TDG Links: Profile News Message Board | |
| Charts:- Daily , Weekly | |
| Add TDG to Watchlist: View: Get Complete TDG Trend Analysis ➞ | |
 | CR Crane Co. |
| Sector: Industrials | |
| SubSector: Diversified Machinery | |
| MarketCap: 2715.16 Millions | |
| Recent Price: 142.95 Smart Investing & Trading Score: 95 | |
| Day Percent Change: 1.04% Day Change: 1.47 | |
| Week Change: -0.97% Year-to-date Change: 21.0% | |
| CR Links: Profile News Message Board | |
| Charts:- Daily , Weekly | |
| Add CR to Watchlist: View: Get Complete CR Trend Analysis ➞ | |
 | HLI Houlihan Lokey, Inc. |
| Sector: Financials | |
| SubSector: Investment Brokerage - National | |
| MarketCap: 3352.65 Millions | |
| Recent Price: 131.90 Smart Investing & Trading Score: 95 | |
| Day Percent Change: 1.03% Day Change: 1.35 | |
| Week Change: 4.1% Year-to-date Change: 10.0% | |
| HLI Links: Profile News Message Board | |
| Charts:- Daily , Weekly | |
| Add HLI to Watchlist: View: Get Complete HLI Trend Analysis ➞ | |
 | TYL Tyler Technologies, Inc. |
| Sector: Technology | |
| SubSector: Technical & System Software | |
| MarketCap: 10785 Millions | |
| Recent Price: 469.00 Smart Investing & Trading Score: 95 | |
| Day Percent Change: 0.98% Day Change: 4.54 | |
| Week Change: 1.79% Year-to-date Change: 12.2% | |
| TYL Links: Profile News Message Board | |
| Charts:- Daily , Weekly | |
| Add TYL to Watchlist: View: Get Complete TYL Trend Analysis ➞ | |
 | CACI CACI International Inc |
| Sector: Technology | |
| SubSector: Information Technology Services | |
| MarketCap: 5211.58 Millions | |
| Recent Price: 414.95 Smart Investing & Trading Score: 95 | |
| Day Percent Change: 0.97% Day Change: 3.99 | |
| Week Change: 2.49% Year-to-date Change: 28.1% | |
| CACI Links: Profile News Message Board | |
| Charts:- Daily , Weekly | |
| Add CACI to Watchlist: View: Get Complete CACI Trend Analysis ➞ | |
 | OC Owens Corning |
| Sector: Industrials | |
| SubSector: General Building Materials | |
| MarketCap: 3686.73 Millions | |
| Recent Price: 174.81 Smart Investing & Trading Score: 95 | |
| Day Percent Change: 0.96% Day Change: 1.67 | |
| Week Change: 3.74% Year-to-date Change: 17.9% | |
| OC Links: Profile News Message Board | |
| Charts:- Daily , Weekly | |
| Add OC to Watchlist: View: Get Complete OC Trend Analysis ➞ | |
 | AVY Avery Dennison Corporation |
| Sector: Consumer Staples | |
| SubSector: Business Equipment | |
| MarketCap: 8051.27 Millions | |
| Recent Price: 221.55 Smart Investing & Trading Score: 95 | |
| Day Percent Change: 0.93% Day Change: 2.04 | |
| Week Change: 1.15% Year-to-date Change: 9.6% | |
| AVY Links: Profile News Message Board | |
| Charts:- Daily , Weekly | |
| Add AVY to Watchlist: View: Get Complete AVY Trend Analysis ➞ | |
 | BPOP Popular, Inc. |
| Sector: Financials | |
| SubSector: Foreign Regional Banks | |
| MarketCap: 2671.99 Millions | |
| Recent Price: 88.85 Smart Investing & Trading Score: 95 | |
| Day Percent Change: 0.91% Day Change: 0.80 | |
| Week Change: 2.62% Year-to-date Change: 8.3% | |
| BPOP Links: Profile News Message Board | |
| Charts:- Daily , Weekly | |
| Add BPOP to Watchlist: View: Get Complete BPOP Trend Analysis ➞ | |
 | PB Prosperity Bancshares, Inc. |
| Sector: Financials | |
| SubSector: Regional - Southwest Banks | |
| MarketCap: 4682.25 Millions | |
| Recent Price: 63.07 Smart Investing & Trading Score: 95 | |
| Day Percent Change: 0.88% Day Change: 0.55 | |
| Week Change: -0.76% Year-to-date Change: -6.9% | |
| PB Links: Profile News Message Board | |
| Charts:- Daily , Weekly | |
| Add PB to Watchlist: View: Get Complete PB Trend Analysis ➞ | |
 | SYF Synchrony Financial |
| Sector: Financials | |
| SubSector: Credit Services | |
| MarketCap: 9297.28 Millions | |
| Recent Price: 45.60 Smart Investing & Trading Score: 95 | |
| Day Percent Change: 0.77% Day Change: 0.35 | |
| Week Change: 2.08% Year-to-date Change: 19.4% | |
| SYF Links: Profile News Message Board | |
| Charts:- Daily , Weekly | |
| Add SYF to Watchlist: View: Get Complete SYF Trend Analysis ➞ | |
 | HEI HEICO Corporation |
| Sector: Industrials | |
| SubSector: Aerospace/Defense Products & Services | |
| MarketCap: 10023.1 Millions | |
| Recent Price: 211.36 Smart Investing & Trading Score: 95 | |
| Day Percent Change: 0.63% Day Change: 1.32 | |
| Week Change: 2.37% Year-to-date Change: 18.2% | |
| HEI Links: Profile News Message Board | |
| Charts:- Daily , Weekly | |
| Add HEI to Watchlist: View: Get Complete HEI Trend Analysis ➞ | |
 | TWLO Twilio Inc. |
| Sector: Technology | |
| SubSector: Application Software | |
| MarketCap: 13055.8 Millions | |
| Recent Price: 61.89 Smart Investing & Trading Score: 95 | |
| Day Percent Change: 0.60% Day Change: 0.37 | |
| Week Change: 1.64% Year-to-date Change: -18.4% | |
| TWLO Links: Profile News Message Board | |
| Charts:- Daily , Weekly | |
| Add TWLO to Watchlist: View: Get Complete TWLO Trend Analysis ➞ | |
| For tabular summary view of above stock list: Summary View ➞ 0 - 25 , 25 - 50 , 50 - 75 , 75 - 100 , 100 - 125 , 125 - 150 , 150 - 175 , 175 - 200 , 200 - 225 , 225 - 250 , 250 - 275 , 275 - 300 , 300 - 325 , 325 - 350 , 350 - 375 , 375 - 400 , 400 - 425 , 425 - 450 , 450 - 475 , 475 - 500 , 500 - 525 , 525 - 550 , 550 - 575 , 575 - 600 , 600 - 625 , 625 - 650 , 650 - 675 , 675 - 700 , 700 - 725 , 725 - 750 , 750 - 775 | ||
| Click To Change The Sort Order: By Market Cap or Company Size Performance: Year-to-date, Week and Day | |
| Select Chart Type: | ||
|
Best Stocks Today 12Stocks.com |
© 2024 12Stocks.com Terms & Conditions Privacy Contact Us
All Information Provided Only For Education And Not To Be Used For Investing or Trading. See Terms & Conditions


One More Thing ... Get Best Stocks Delivered Daily!
Never Ever Miss A Move With Our Top Ten Stocks Lists
Find Best Stocks In Any Market - Bull or Bear Market
Take A Peek At Our Top Ten Stocks Lists: Daily, Weekly, Year-to-Date & Top Trends
Find Best Stocks In Any Market - Bull or Bear Market
Take A Peek At Our Top Ten Stocks Lists: Daily, Weekly, Year-to-Date & Top Trends
Midcap Stocks With Best Up Trends [0-bearish to 100-bullish]: GameStop [100], Tandem Diabetes[100], MasTec [100], Frontier [100], Organon [100], First Solar[100], Reinsurance [100], Brookfield Renewable[100], Camden Property[100], Aptiv [100], Texas Roadhouse[100]
Best Midcap Stocks Year-to-Date:
Vistra Energy[111.55%], AppLovin [88.57%], ShockWave Medical[73.37%], EMCOR [68.86%], Constellation Energy[66.35%], CAVA [65.92%], Tenet [59.16%], Spotify [57.56%], Natera [54.82%], Wingstop [51.43%], Tandem Diabetes[51.18%] Best Midcap Stocks This Week:
GameStop [38.4%], Tandem Diabetes[26.9%], Tenet [25.12%], Wayfair [22.26%], Brookfield Renewable[21.71%], Bio-Techne [20.65%], Pinterest [18.99%], New York[18.86%], Olaplex [18.28%], Valmont Industries[17.25%], NovoCure [16.98%] Best Midcap Stocks Daily:
GameStop [29.08%], Tandem Diabetes[22.32%], Ginkgo Bioworks[12.33%], Paylocity Holding[12.05%], MasTec [11.87%], Plug Power[11.84%], Peloton Interactive[9.42%], Universal Display[9.28%], Sunrun [8.68%], Frontier [8.66%], Wayfair [8.44%]