
 Login Sign Up


| |||||
 |  | ||||

| 12Stocks.com Market Intelligence |
Best MidCap Stocks
|
| In a hurry? Mid Cap Stocks Lists: Performance Trends Table, Stock Charts
Sort midcap stocks: Daily, Weekly, Year-to-Date, Market Cap & Trends. Filter midcap stocks list by sector: Show all, Tech, Finance, Energy, Staples, Retail, Industrial, Materials, Utilities and HealthCare Filter midcap stocks list by size:All MidCap Large Mid-Range Small |
| 12Stocks.com Mid Cap Stocks Performances & Trends Daily | |||||||||
|
|  The overall Smart Investing & Trading Score is 95 (0-bearish to 100-bullish) which puts Mid Cap index in short term bullish trend. The Smart Investing & Trading Score from previous trading session is 88 and hence an improvement of trend.
| ||||||||
Here are the Smart Investing & Trading Scores of the most requested mid cap stocks at 12Stocks.com (click stock name for detailed review):
|


| 12Stocks.com: Top Performing Mid Cap Index Stocks | ||||||||||||||||||||||||||||||||||||||||||||||||
 The top performing Mid Cap Index stocks year to date are
Now, more recently, over last week, the top performing Mid Cap Index stocks on the move are


|
||||||||||||||||||||||||||||||||||||||||||||||||
| 12Stocks.com: Investing in Midcap Index with Stocks | |
|
The following table helps investors and traders sort through current performance and trends (as measured by Smart Investing & Trading Score) of various
stocks in the Midcap Index. Quick View: Move mouse or cursor over stock symbol (ticker) to view short-term technical chart and over stock name to view long term chart. Click on  to add stock symbol to your watchlist and to add stock symbol to your watchlist and  to view watchlist. Click on any ticker or stock name for detailed market intelligence report for that stock. to view watchlist. Click on any ticker or stock name for detailed market intelligence report for that stock. |
12Stocks.com Performance of Stocks in Midcap Index
| Ticker | Stock Name | Watchlist | Category | Recent Price | Smart Investing & Trading Score | Change % | YTD Change% |
| NYCB | New York |   | Financials | 3.73 | 57 | -3.98% | -63.49% |
| KSS | Kohl s | | Services & Goods | 25.97 | 57 | -2.84% | -9.45% |
| KMX | CarMax | | Services & Goods | 74.56 | 57 | -1.58% | -2.84% |
| ZM | Zoom Video | | Technology | 63.06 | 57 | -0.74% | -12.31% |
| TREX | Trex | | Industrials | 90.95 | 57 | 2.78% | 9.86% |
| MAS | Masco | | Industrials | 72.21 | 57 | 1.56% | 7.81% |
| NEU | NewMarket | | Materials | 563.11 | 57 | 1.48% | 3.16% |
| IQV | IQVIA | | Health Care | 233.92 | 57 | 1.20% | 1.10% |
| GWW | W.W. Grainger | | Services & Goods | 958.74 | 57 | 0.86% | 15.69% |
| GGG | Graco | | Industrials | 83.77 | 57 | 0.76% | -3.45% |
| RYN | Rayonier | | Industrials | 30.20 | 57 | 0.27% | -9.61% |
| MSCI | MSCI | | Technology | 488.71 | 57 | 0.12% | -13.60% |
| ZG | Zillow | | Technology | 43.28 | 57 | -1.30% | -23.70% |
| INGR | Ingredion | | Consumer Staples | 117.98 | 55 | -0.13% | 8.71% |
| SJM | J. M. | | Consumer Staples | 115.37 | 55 | 0.15% | -8.71% |
| PII | Polaris | | Consumer Staples | 87.41 | 55 | -0.76% | -7.77% |
| MTCH | Match | | Technology | 31.90 | 55 | -0.14% | -12.62% |
| TDOC | Teladoc Health | | Technology | 12.86 | 54 | 0.90% | -40.35% |
| RPM | RPM | | Materials | 113.80 | 54 | 0.13% | 1.94% |
| WING | Wingstop | | Services & Goods | 388.58 | 54 | 0.35% | 51.45% |
| APA | Apache | | Energy | 30.21 | 54 | 0.13% | -15.80% |
| GPC | Genuine Parts | | Services & Goods | 155.14 | 54 | -0.28% | 12.01% |
| HIG | Hartford Financial | | Financials | 100.35 | 53 | -0.97% | 24.84% |
| CINF | Cinnati Financial | | Financials | 117.22 | 53 | -0.84% | 13.29% |
| CHD | Church & Dwight Co | | Consumer Staples | 106.55 | 53 | -0.26% | 12.68% |
| For chart view version of above stock list: Chart View ➞ 0 - 25 , 25 - 50 , 50 - 75 , 75 - 100 , 100 - 125 , 125 - 150 , 150 - 175 , 175 - 200 , 200 - 225 , 225 - 250 , 250 - 275 , 275 - 300 , 300 - 325 , 325 - 350 , 350 - 375 , 375 - 400 , 400 - 425 , 425 - 450 , 450 - 475 , 475 - 500 , 500 - 525 , 525 - 550 , 550 - 575 , 575 - 600 , 600 - 625 , 625 - 650 , 650 - 675 , 675 - 700 , 700 - 725 , 725 - 750 | ||
 | Click To Change The Sort Order: By Market Cap or Company Size Performance: Year-to-date, Week and Day |  |
|
Get the most comprehensive stock market coverage daily at 12Stocks.com ➞ Best Stocks Today ➞ Best Stocks Weekly ➞ Best Stocks Year-to-Date ➞ Best Stocks Trends ➞  Best Stocks Today 12Stocks.com Best Nasdaq Stocks ➞ Best S&P 500 Stocks ➞ Best Tech Stocks ➞ Best Biotech Stocks ➞ |
| Detailed Overview of Midcap Stocks |
| Midcap Technical Overview, Leaders & Laggards, Top Midcap ETF Funds & Detailed Midcap Stocks List, Charts, Trends & More |
| Midcap: Technical Analysis, Trends & YTD Performance | |
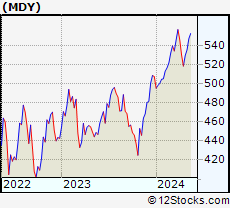
| MidCap segment as represented by
MDY, an exchange-traded fund [ETF], holds basket of about four hundred midcap stocks from across all major sectors of the US stock market. The midcap index (contains stocks like Green Mountain Coffee Roasters and Tractor Supply Company) is up by 9.29% and is currently underperforming the overall market by -0.89% year-to-date. Below is a quick view of technical charts and trends: | |
 MDY Weekly Chart |
|
| Long Term Trend: Very Good | |
| Medium Term Trend: Very Good | |
 MDY Daily Chart |
|
| Short Term Trend: Very Good | |
| Overall Trend Score: 95 | |
| YTD Performance: 9.29% | |
| **Trend Scores & Views Are Only For Educational Purposes And Not For Investing | |
| 12Stocks.com: Investing in Midcap Index using Exchange Traded Funds | |
|
The following table shows list of key exchange traded funds (ETF) that
help investors track Midcap index. The following list also includes leveraged ETF funds that track twice or thrice the daily returns of Midcap indices. Short or inverse ETF funds move in the opposite direction to the index they track and are useful during market pullbacks or during bear markets. Quick View: Move mouse or cursor over ETF symbol (ticker) to view short-term technical chart and over ETF name to view long term chart. Click on ticker or stock name for detailed view. Click on to add stock symbol to your watchlist and to view watchlist. |
12Stocks.com List of ETFs that track Midcap Index
| Ticker | ETF Name | Watchlist | Recent Price | Smart Investing & Trading Score | Change % | Week % | Year-to-date % |
| IJH | iShares Core S&P Mid-Cap | | 60.61 | 95 | 0.50 | 1.34 | 9.35% |
| IWR | iShares Russell Mid-Cap | | 83.36 | 100 | 0.72 | 1.15 | 7.24% |
| MDY | SPDR S&P MidCap 400 ETF | | 554.52 | 95 | 0.49 | 1.36 | 9.29% |
| IWP | iShares Russell Mid-Cap Growth | | 111.68 | 82 | 0.99 | 1.23 | 6.91% |
| IWS | iShares Russell Mid-Cap Value | | 124.76 | 95 | 0.58 | 1.12 | 7.28% |
| IJK | iShares S&P Mid-Cap 400 Growth | | 90.89 | 95 | 0.98 | 1.07 | 14.73% |
| UMDD | ProShares UltraPro MidCap400 | | 27.28 | 95 | 1.07 | 3.69 | 22.22% |
| IJJ | iShares S&P Mid-Cap 400 Value | | 118.06 | 95 | 0.15 | 1.56 | 3.53% |
| SMDD | ProShares UltraPro Short MidCap400 | | 10.33 | 10 | -0.97 | -3.31 | -23.28% |
| XMLV | PowerShares S&P MidCap Low Volatil ETF | | 56.89 | 88 | 0.57 | 0.35 | 6.98% |
| MVV | ProShares Ultra MidCap400 | | 67.20 | 100 | 1.60 | 2.84 | 16.08% |
| MYY | ProShares Short MidCap400 | | 19.80 | 0 | -0.80 | -1.6 | -7.71% |
| MZZ | ProShares UltraShort MidCap400 | | 10.68 | 20 | -1.21 | -2.47 | -15.05% |
| 12Stocks.com: Charts, Trends, Fundamental Data and Performances of MidCap Stocks | |
|
We now take in-depth look at all MidCap stocks including charts, multi-period performances and overall trends (as measured by Smart Investing & Trading Score). One can sort MidCap stocks (click link to choose) by Daily, Weekly and by Year-to-Date performances. Also, one can sort by size of the company or by market capitalization. |
| Select Your Default Chart Type: | |||||
| |||||
| Click on stock symbol or name for detailed view. Click on to add stock symbol to your watchlist and to view watchlist. Quick View: Move mouse or cursor over "Daily" to quickly view daily technical stock chart and over "Weekly" to view weekly technical stock chart. | |||||

 | NYCB New York Community Bancorp, Inc. |
| Sector: Financials | |
| SubSector: Savings & Loans | |
| MarketCap: 4888.6 Millions | |
| Recent Price: 3.73 Smart Investing & Trading Score: 57 | |
| Day Percent Change: -3.98% Day Change: -0.16 | |
| Week Change: 8.26% Year-to-date Change: -63.5% | |
| NYCB Links: Profile News Message Board | |
| Charts:- Daily , Weekly | |
| Add NYCB to Watchlist: View: Get Complete NYCB Trend Analysis ➞ | |
 | KSS Kohl s Corporation |
| Sector: Services & Goods | |
| SubSector: Department Stores | |
| MarketCap: 3068 Millions | |
| Recent Price: 25.97 Smart Investing & Trading Score: 57 | |
| Day Percent Change: -2.84% Day Change: -0.76 | |
| Week Change: 8.52% Year-to-date Change: -9.5% | |
| KSS Links: Profile News Message Board | |
| Charts:- Daily , Weekly | |
| Add KSS to Watchlist: View: Get Complete KSS Trend Analysis ➞ | |
 | KMX CarMax, Inc. |
| Sector: Services & Goods | |
| SubSector: Auto Dealerships | |
| MarketCap: 8121.71 Millions | |
| Recent Price: 74.56 Smart Investing & Trading Score: 57 | |
| Day Percent Change: -1.58% Day Change: -1.20 | |
| Week Change: 3.97% Year-to-date Change: -2.8% | |
| KMX Links: Profile News Message Board | |
| Charts:- Daily , Weekly | |
| Add KMX to Watchlist: View: Get Complete KMX Trend Analysis ➞ | |
 | ZM Zoom Video Communications, Inc. |
| Sector: Technology | |
| SubSector: Application Software | |
| MarketCap: 36358.1 Millions | |
| Recent Price: 63.06 Smart Investing & Trading Score: 57 | |
| Day Percent Change: -0.74% Day Change: -0.47 | |
| Week Change: 2.42% Year-to-date Change: -12.3% | |
| ZM Links: Profile News Message Board | |
| Charts:- Daily , Weekly | |
| Add ZM to Watchlist: View: Get Complete ZM Trend Analysis ➞ | |
 | TREX Trex Company, Inc. |
| Sector: Industrials | |
| SubSector: General Building Materials | |
| MarketCap: 4369.23 Millions | |
| Recent Price: 90.95 Smart Investing & Trading Score: 57 | |
| Day Percent Change: 2.78% Day Change: 2.46 | |
| Week Change: 4.09% Year-to-date Change: 9.9% | |
| TREX Links: Profile News Message Board | |
| Charts:- Daily , Weekly | |
| Add TREX to Watchlist: View: Get Complete TREX Trend Analysis ➞ | |
 | MAS Masco Corporation |
| Sector: Industrials | |
| SubSector: General Building Materials | |
| MarketCap: 8655.63 Millions | |
| Recent Price: 72.21 Smart Investing & Trading Score: 57 | |
| Day Percent Change: 1.56% Day Change: 1.11 | |
| Week Change: -0.14% Year-to-date Change: 7.8% | |
| MAS Links: Profile News Message Board | |
| Charts:- Daily , Weekly | |
| Add MAS to Watchlist: View: Get Complete MAS Trend Analysis ➞ | |
 | NEU NewMarket Corporation |
| Sector: Materials | |
| SubSector: Specialty Chemicals | |
| MarketCap: 4543.77 Millions | |
| Recent Price: 563.11 Smart Investing & Trading Score: 57 | |
| Day Percent Change: 1.48% Day Change: 8.22 | |
| Week Change: -0.28% Year-to-date Change: 3.2% | |
| NEU Links: Profile News Message Board | |
| Charts:- Daily , Weekly | |
| Add NEU to Watchlist: View: Get Complete NEU Trend Analysis ➞ | |
 | IQV IQVIA Holdings Inc. |
| Sector: Health Care | |
| SubSector: Medical Laboratories & Research | |
| MarketCap: 19616.5 Millions | |
| Recent Price: 233.92 Smart Investing & Trading Score: 57 | |
| Day Percent Change: 1.20% Day Change: 2.78 | |
| Week Change: 0.93% Year-to-date Change: 1.1% | |
| IQV Links: Profile News Message Board | |
| Charts:- Daily , Weekly | |
| Add IQV to Watchlist: View: Get Complete IQV Trend Analysis ➞ | |
 | GWW W.W. Grainger, Inc. |
| Sector: Services & Goods | |
| SubSector: Industrial Equipment Wholesale | |
| MarketCap: 12794.8 Millions | |
| Recent Price: 958.74 Smart Investing & Trading Score: 57 | |
| Day Percent Change: 0.86% Day Change: 8.19 | |
| Week Change: 0.01% Year-to-date Change: 15.7% | |
| GWW Links: Profile News Message Board | |
| Charts:- Daily , Weekly | |
| Add GWW to Watchlist: View: Get Complete GWW Trend Analysis ➞ | |
 | GGG Graco Inc. |
| Sector: Industrials | |
| SubSector: Diversified Machinery | |
| MarketCap: 7739.76 Millions | |
| Recent Price: 83.77 Smart Investing & Trading Score: 57 | |
| Day Percent Change: 0.76% Day Change: 0.64 | |
| Week Change: 0.25% Year-to-date Change: -3.5% | |
| GGG Links: Profile News Message Board | |
| Charts:- Daily , Weekly | |
| Add GGG to Watchlist: View: Get Complete GGG Trend Analysis ➞ | |
 | RYN Rayonier Inc. |
| Sector: Industrials | |
| SubSector: Lumber, Wood Production | |
| MarketCap: 3143 Millions | |
| Recent Price: 30.20 Smart Investing & Trading Score: 57 | |
| Day Percent Change: 0.27% Day Change: 0.08 | |
| Week Change: 1.82% Year-to-date Change: -9.6% | |
| RYN Links: Profile News Message Board | |
| Charts:- Daily , Weekly | |
| Add RYN to Watchlist: View: Get Complete RYN Trend Analysis ➞ | |
 | MSCI MSCI Inc. |
| Sector: Technology | |
| SubSector: Processing Systems & Products | |
| MarketCap: 21086.3 Millions | |
| Recent Price: 488.71 Smart Investing & Trading Score: 57 | |
| Day Percent Change: 0.12% Day Change: 0.60 | |
| Week Change: 0.73% Year-to-date Change: -13.6% | |
| MSCI Links: Profile News Message Board | |
| Charts:- Daily , Weekly | |
| Add MSCI to Watchlist: View: Get Complete MSCI Trend Analysis ➞ | |
 | ZG Zillow Group, Inc. |
| Sector: Technology | |
| SubSector: Internet Information Providers | |
| MarketCap: 6536.7 Millions | |
| Recent Price: 43.28 Smart Investing & Trading Score: 57 | |
| Day Percent Change: -1.30% Day Change: -0.57 | |
| Week Change: 3.54% Year-to-date Change: -23.7% | |
| ZG Links: Profile News Message Board | |
| Charts:- Daily , Weekly | |
| Add ZG to Watchlist: View: Get Complete ZG Trend Analysis ➞ | |
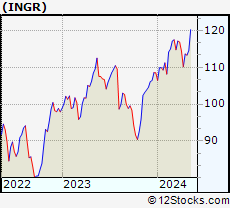 | INGR Ingredion Incorporated |
| Sector: Consumer Staples | |
| SubSector: Processed & Packaged Goods | |
| MarketCap: 5064.18 Millions | |
| Recent Price: 117.98 Smart Investing & Trading Score: 55 | |
| Day Percent Change: -0.13% Day Change: -0.15 | |
| Week Change: -1.86% Year-to-date Change: 8.7% | |
| INGR Links: Profile News Message Board | |
| Charts:- Daily , Weekly | |
| Add INGR to Watchlist: View: Get Complete INGR Trend Analysis ➞ | |
 | SJM The J. M. Smucker Company |
| Sector: Consumer Staples | |
| SubSector: Processed & Packaged Goods | |
| MarketCap: 12635.8 Millions | |
| Recent Price: 115.37 Smart Investing & Trading Score: 55 | |
| Day Percent Change: 0.15% Day Change: 0.17 | |
| Week Change: 0.03% Year-to-date Change: -8.7% | |
| SJM Links: Profile News Message Board | |
| Charts:- Daily , Weekly | |
| Add SJM to Watchlist: View: Get Complete SJM Trend Analysis ➞ | |
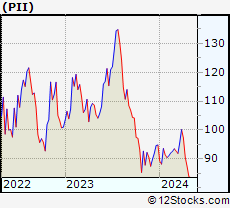 | PII Polaris Inc. |
| Sector: Consumer Staples | |
| SubSector: Recreational Vehicles | |
| MarketCap: 3589.29 Millions | |
| Recent Price: 87.41 Smart Investing & Trading Score: 55 | |
| Day Percent Change: -0.76% Day Change: -0.67 | |
| Week Change: -0.22% Year-to-date Change: -7.8% | |
| PII Links: Profile News Message Board | |
| Charts:- Daily , Weekly | |
| Add PII to Watchlist: View: Get Complete PII Trend Analysis ➞ | |
 | MTCH Match Group, Inc. |
| Sector: Technology | |
| SubSector: Internet Information Providers | |
| MarketCap: 14655.8 Millions | |
| Recent Price: 31.90 Smart Investing & Trading Score: 55 | |
| Day Percent Change: -0.14% Day Change: -0.05 | |
| Week Change: 3.93% Year-to-date Change: -12.6% | |
| MTCH Links: Profile News Message Board | |
| Charts:- Daily , Weekly | |
| Add MTCH to Watchlist: View: Get Complete MTCH Trend Analysis ➞ | |
 | TDOC Teladoc Health, Inc. |
| Sector: Technology | |
| SubSector: Healthcare Information Services | |
| MarketCap: 11968.5 Millions | |
| Recent Price: 12.86 Smart Investing & Trading Score: 54 | |
| Day Percent Change: 0.90% Day Change: 0.12 | |
| Week Change: 7.57% Year-to-date Change: -40.4% | |
| TDOC Links: Profile News Message Board | |
| Charts:- Daily , Weekly | |
| Add TDOC to Watchlist: View: Get Complete TDOC Trend Analysis ➞ | |
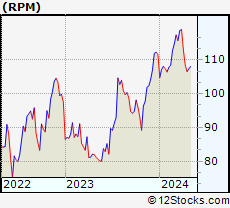 | RPM RPM International Inc. |
| Sector: Materials | |
| SubSector: Specialty Chemicals | |
| MarketCap: 6814.87 Millions | |
| Recent Price: 113.80 Smart Investing & Trading Score: 54 | |
| Day Percent Change: 0.13% Day Change: 0.15 | |
| Week Change: 0.85% Year-to-date Change: 1.9% | |
| RPM Links: Profile News Message Board | |
| Charts:- Daily , Weekly | |
| Add RPM to Watchlist: View: Get Complete RPM Trend Analysis ➞ | |
 | WING Wingstop Inc. |
| Sector: Services & Goods | |
| SubSector: Restaurants | |
| MarketCap: 1744.7 Millions | |
| Recent Price: 388.58 Smart Investing & Trading Score: 54 | |
| Day Percent Change: 0.35% Day Change: 1.34 | |
| Week Change: -0.37% Year-to-date Change: 51.5% | |
| WING Links: Profile News Message Board | |
| Charts:- Daily , Weekly | |
| Add WING to Watchlist: View: Get Complete WING Trend Analysis ➞ | |
 | APA Apache Corporation |
| Sector: Energy | |
| SubSector: Independent Oil & Gas | |
| MarketCap: 1937.53 Millions | |
| Recent Price: 30.21 Smart Investing & Trading Score: 54 | |
| Day Percent Change: 0.13% Day Change: 0.04 | |
| Week Change: -0.56% Year-to-date Change: -15.8% | |
| APA Links: Profile News Message Board | |
| Charts:- Daily , Weekly | |
| Add APA to Watchlist: View: Get Complete APA Trend Analysis ➞ | |
 | GPC Genuine Parts Company |
| Sector: Services & Goods | |
| SubSector: Auto Parts Stores | |
| MarketCap: 8605.9 Millions | |
| Recent Price: 155.14 Smart Investing & Trading Score: 54 | |
| Day Percent Change: -0.28% Day Change: -0.44 | |
| Week Change: -0.08% Year-to-date Change: 12.0% | |
| GPC Links: Profile News Message Board | |
| Charts:- Daily , Weekly | |
| Add GPC to Watchlist: View: Get Complete GPC Trend Analysis ➞ | |
 | HIG The Hartford Financial Services Group, Inc. |
| Sector: Financials | |
| SubSector: Property & Casualty Insurance | |
| MarketCap: 12582.8 Millions | |
| Recent Price: 100.35 Smart Investing & Trading Score: 53 | |
| Day Percent Change: -0.97% Day Change: -0.98 | |
| Week Change: -1.51% Year-to-date Change: 24.8% | |
| HIG Links: Profile News Message Board | |
| Charts:- Daily , Weekly | |
| Add HIG to Watchlist: View: Get Complete HIG Trend Analysis ➞ | |
 | CINF Cincinnati Financial Corporation |
| Sector: Financials | |
| SubSector: Property & Casualty Insurance | |
| MarketCap: 13637 Millions | |
| Recent Price: 117.22 Smart Investing & Trading Score: 53 | |
| Day Percent Change: -0.84% Day Change: -0.99 | |
| Week Change: -1.39% Year-to-date Change: 13.3% | |
| CINF Links: Profile News Message Board | |
| Charts:- Daily , Weekly | |
| Add CINF to Watchlist: View: Get Complete CINF Trend Analysis ➞ | |
 | CHD Church & Dwight Co., Inc. |
| Sector: Consumer Staples | |
| SubSector: Cleaning Products | |
| MarketCap: 17425.7 Millions | |
| Recent Price: 106.55 Smart Investing & Trading Score: 53 | |
| Day Percent Change: -0.26% Day Change: -0.28 | |
| Week Change: -0.71% Year-to-date Change: 12.7% | |
| CHD Links: Profile News Message Board | |
| Charts:- Daily , Weekly | |
| Add CHD to Watchlist: View: Get Complete CHD Trend Analysis ➞ | |
| For tabular summary view of above stock list: Summary View ➞ 0 - 25 , 25 - 50 , 50 - 75 , 75 - 100 , 100 - 125 , 125 - 150 , 150 - 175 , 175 - 200 , 200 - 225 , 225 - 250 , 250 - 275 , 275 - 300 , 300 - 325 , 325 - 350 , 350 - 375 , 375 - 400 , 400 - 425 , 425 - 450 , 450 - 475 , 475 - 500 , 500 - 525 , 525 - 550 , 550 - 575 , 575 - 600 , 600 - 625 , 625 - 650 , 650 - 675 , 675 - 700 , 700 - 725 , 725 - 750 | ||
| Click To Change The Sort Order: By Market Cap or Company Size Performance: Year-to-date, Week and Day | |
| Select Chart Type: | ||
|
Best Stocks Today 12Stocks.com |
© 2024 12Stocks.com Terms & Conditions Privacy Contact Us
All Information Provided Only For Education And Not To Be Used For Investing or Trading. See Terms & Conditions


One More Thing ... Get Best Stocks Delivered Daily!
Never Ever Miss A Move With Our Top Ten Stocks Lists
Find Best Stocks In Any Market - Bull or Bear Market
Take A Peek At Our Top Ten Stocks Lists: Daily, Weekly, Year-to-Date & Top Trends
Find Best Stocks In Any Market - Bull or Bear Market
Take A Peek At Our Top Ten Stocks Lists: Daily, Weekly, Year-to-Date & Top Trends
Midcap Stocks With Best Up Trends [0-bearish to 100-bullish]: Toll Brothers[100], Pure Storage[100], Teradyne [100], AES [100], Biogen [100], NovoCure [100], Jones Lang[100], KKR [100], NRG Energy[100], GoDaddy [100], nVent Electric[100]
Best Midcap Stocks Year-to-Date:
Vistra Energy[149.12%], AppLovin [108.29%], Constellation Energy[89.13%], GameStop [79.58%], EMCOR [78.23%], CAVA [77.94%], Tenet [74.14%], ShockWave Medical[73.69%], Celsius [71.24%], Natera [70.95%], Pure Storage[64.27%] Best Midcap Stocks This Week:
GameStop [80.3%], AMC Entertainment[68.38%], Petco Health[42.77%], Plug Power[30.47%], NovoCure [27.2%], Hawaiian Electric[13.31%], Celsius [12.74%], Hertz Global[12.07%], Medical Properties[11.09%], Victorias Secret[10.82%], Lucid [9.77%] Best Midcap Stocks Daily:
Petco Health[16.18%], Nu [5.93%], Vistra Energy[4.91%], Toll Brothers[4.75%], SBA [4.32%], MarketAxess [4.31%], D.R. Horton[4.09%], Pure Storage[3.85%], Ionis [3.71%], Nutanix [3.69%], IDEXX [3.62%]