
 Login Sign Up


| |||||
 |  | ||||

| 12Stocks.com Market Intelligence |
Best MidCap Stocks
|
| In a hurry? Mid Cap Stocks Lists: Performance Trends Table, Stock Charts
Sort midcap stocks: Daily, Weekly, Year-to-Date, Market Cap & Trends. Filter midcap stocks list by sector: Show all, Tech, Finance, Energy, Staples, Retail, Industrial, Materials, Utilities and HealthCare Filter midcap stocks list by size:All MidCap Large Mid-Range Small |
| 12Stocks.com Mid Cap Stocks Performances & Trends Daily | |||||||||
|
|  The overall Smart Investing & Trading Score is 70 (0-bearish to 100-bullish) which puts Mid Cap index in short term neutral to bullish trend. The Smart Investing & Trading Score from previous trading session is 56 and hence an improvement of trend.
| ||||||||
Here are the Smart Investing & Trading Scores of the most requested mid cap stocks at 12Stocks.com (click stock name for detailed review):
|


| 12Stocks.com: Top Performing Mid Cap Index Stocks | ||||||||||||||||||||||||||||||||||||||||||||||||
 The top performing Mid Cap Index stocks year to date are
Now, more recently, over last week, the top performing Mid Cap Index stocks on the move are


|
||||||||||||||||||||||||||||||||||||||||||||||||
| 12Stocks.com: Investing in Midcap Index with Stocks | |
|
The following table helps investors and traders sort through current performance and trends (as measured by Smart Investing & Trading Score) of various
stocks in the Midcap Index. Quick View: Move mouse or cursor over stock symbol (ticker) to view short-term technical chart and over stock name to view long term chart. Click on  to add stock symbol to your watchlist and to add stock symbol to your watchlist and  to view watchlist. Click on any ticker or stock name for detailed market intelligence report for that stock. to view watchlist. Click on any ticker or stock name for detailed market intelligence report for that stock. |
12Stocks.com Performance of Stocks in Midcap Index
| Ticker | Stock Name | Watchlist | Category | Recent Price | Smart Investing & Trading Score | Change % | YTD Change% |
| WY | Weyerhaeuser |   | Industrials | 31.03 | 10 | -0.06% | -10.76% |
| DAR | Darling Ingredients | | Industrials | 44.45 | 88 | -0.49% | -10.81% |
| NYT | New York | | Services & Goods | 43.68 | 64 | 1.18% | -10.84% |
| LSXMA | Liberty SiriusXM | | Services & Goods | 25.60 | 50 | 5.31% | -10.93% |
| DXC | DXC | | Technology | 20.36 | 35 | 1.37% | -11.00% |
| CUBE | CubeSmart | | Financials | 41.24 | 20 | 1.19% | -11.01% |
| EXPD | Expeditors | | Transports | 113.06 | 35 | -0.21% | -11.12% |
| CTSH | Cognizant | | Technology | 67.10 | 35 | 0.24% | -11.16% |
| FDS | FactSet Research | | Technology | 423.68 | 42 | 0.52% | -11.19% |
| LSXMK | Liberty SiriusXM | | Services & Goods | 25.54 | 57 | 5.21% | -11.28% |
| CLF | Cleveland-Cliffs | | Materials | 18.10 | 10 | 1.23% | -11.36% |
| HXL | Hexcel | | Industrials | 65.29 | 64 | 1.76% | -11.47% |
| ZM | Zoom Video | | Technology | 63.54 | 69 | 2.48% | -11.64% |
| STAG | STAG Industrial | | Financials | 34.64 | 25 | 0.46% | -11.77% |
| CCK | Crown | | Consumer Staples | 81.20 | 74 | 0.76% | -11.83% |
| XEL | Xcel Energy | | Utilities | 54.56 | 42 | 1.11% | -11.87% |
| KIM | Kimco Realty | | Financials | 18.67 | 64 | 1.58% | -12.39% |
| LFUS | Littelfuse | | Services & Goods | 234.26 | 67 | 1.13% | -12.45% |
| NCNO | nCino | | Technology | 29.44 | 20 | -0.24% | -12.46% |
| RH | RH | | Services & Goods | 255.09 | 70 | 2.48% | -12.49% |
| FR | First Industrial | | Financials | 46.09 | 25 | 0.18% | -12.50% |
| ACI | Albertsons | | Consumer Staples | 20.12 | 28 | -0.05% | -12.52% |
| PPG | PPG Industries | | Materials | 130.79 | 35 | 0.48% | -12.54% |
| WSC | WillScot | | Transports | 38.89 | 49 | 0.44% | -12.61% |
| REG | Regency Centers | | Financials | 58.47 | 25 | 0.33% | -12.73% |
| For chart view version of above stock list: Chart View ➞ 0 - 25 , 25 - 50 , 50 - 75 , 75 - 100 , 100 - 125 , 125 - 150 , 150 - 175 , 175 - 200 , 200 - 225 , 225 - 250 , 250 - 275 , 275 - 300 , 300 - 325 , 325 - 350 , 350 - 375 , 375 - 400 , 400 - 425 , 425 - 450 , 450 - 475 , 475 - 500 , 500 - 525 , 525 - 550 , 550 - 575 , 575 - 600 , 600 - 625 , 625 - 650 , 650 - 675 , 675 - 700 , 700 - 725 | ||
 | Click To Change The Sort Order: By Market Cap or Company Size Performance: Year-to-date, Week and Day |  |
|
Get the most comprehensive stock market coverage daily at 12Stocks.com ➞ Best Stocks Today ➞ Best Stocks Weekly ➞ Best Stocks Year-to-Date ➞ Best Stocks Trends ➞  Best Stocks Today 12Stocks.com Best Nasdaq Stocks ➞ Best S&P 500 Stocks ➞ Best Tech Stocks ➞ Best Biotech Stocks ➞ |
| Detailed Overview of Midcap Stocks |
| Midcap Technical Overview, Leaders & Laggards, Top Midcap ETF Funds & Detailed Midcap Stocks List, Charts, Trends & More |
| Midcap: Technical Analysis, Trends & YTD Performance | |
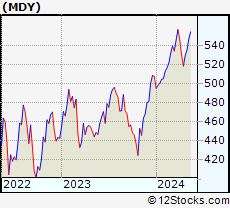
| MidCap segment as represented by
MDY, an exchange-traded fund [ETF], holds basket of about four hundred midcap stocks from across all major sectors of the US stock market. The midcap index (contains stocks like Green Mountain Coffee Roasters and Tractor Supply Company) is up by 4.92% and is currently underperforming the overall market by -1.58% year-to-date. Below is a quick view of technical charts and trends: | |
 MDY Weekly Chart |
|
| Long Term Trend: Very Good | |
| Medium Term Trend: Good | |
 MDY Daily Chart |
|
| Short Term Trend: Very Good | |
| Overall Trend Score: 70 | |
| YTD Performance: 4.92% | |
| **Trend Scores & Views Are Only For Educational Purposes And Not For Investing | |
| 12Stocks.com: Investing in Midcap Index using Exchange Traded Funds | |
|
The following table shows list of key exchange traded funds (ETF) that
help investors track Midcap index. The following list also includes leveraged ETF funds that track twice or thrice the daily returns of Midcap indices. Short or inverse ETF funds move in the opposite direction to the index they track and are useful during market pullbacks or during bear markets. Quick View: Move mouse or cursor over ETF symbol (ticker) to view short-term technical chart and over ETF name to view long term chart. Click on ticker or stock name for detailed view. Click on to add stock symbol to your watchlist and to view watchlist. |
12Stocks.com List of ETFs that track Midcap Index
| Ticker | ETF Name | Watchlist | Recent Price | Smart Investing & Trading Score | Change % | Week % | Year-to-date % |
| IWR | iShares Russell Mid-Cap | | 80.94 | 75 | 0.52 | 0.52 | 4.12% |
| IJH | iShares Core S&P Mid-Cap | | 58.08 | 75 | 0.44 | 0.44 | 4.77% |
| IWP | iShares Russell Mid-Cap Growth | | 109.38 | 78 | 0.37 | 0.37 | 4.71% |
| IWS | iShares Russell Mid-Cap Value | | 120.78 | 75 | 0.66 | 0.66 | 3.86% |
| MDY | SPDR S&P MidCap 400 ETF | | 532.34 | 70 | 0.56 | 0.56 | 4.92% |
| IJK | iShares S&P Mid-Cap 400 Growth | | 87.42 | 70 | 0.48 | 0.48 | 10.35% |
| IJJ | iShares S&P Mid-Cap 400 Value | | 113.04 | 88 | 0.72 | 0.72 | -0.88% |
| UMDD | ProShares UltraPro MidCap400 | | 24.34 | 78 | 1.59 | 1.59 | 9.05% |
| XMLV | PowerShares S&P MidCap Low Volatil ETF | | 54.95 | 83 | 0.54 | 0.54 | 3.32% |
| MYY | ProShares Short MidCap400 | | 20.64 | 25 | -0.72 | -0.72 | -3.8% |
| MZZ | ProShares UltraShort MidCap400 | | 11.67 | 27 | -0.09 | -0.09 | -7.17% |
| MVV | ProShares Ultra MidCap400 | | 62.18 | 83 | 1.22 | 1.22 | 7.41% |
| SMDD | ProShares UltraPro Short MidCap400 | | 11.65 | 10 | -1.52 | -1.52 | -13.47% |
| 12Stocks.com: Charts, Trends, Fundamental Data and Performances of MidCap Stocks | |
|
We now take in-depth look at all MidCap stocks including charts, multi-period performances and overall trends (as measured by Smart Investing & Trading Score). One can sort MidCap stocks (click link to choose) by Daily, Weekly and by Year-to-Date performances. Also, one can sort by size of the company or by market capitalization. |
| Select Your Default Chart Type: | |||||
| |||||
| Click on stock symbol or name for detailed view. Click on to add stock symbol to your watchlist and to view watchlist. Quick View: Move mouse or cursor over "Daily" to quickly view daily technical stock chart and over "Weekly" to view weekly technical stock chart. | |||||

 | WY Weyerhaeuser Company |
| Sector: Industrials | |
| SubSector: Lumber, Wood Production | |
| MarketCap: 13244.8 Millions | |
| Recent Price: 31.03 Smart Investing & Trading Score: 10 | |
| Day Percent Change: -0.06% Day Change: -0.02 | |
| Week Change: -0.06% Year-to-date Change: -10.8% | |
| WY Links: Profile News Message Board | |
| Charts:- Daily , Weekly | |
| Add WY to Watchlist: View: Get Complete WY Trend Analysis ➞ | |
 | DAR Darling Ingredients Inc. |
| Sector: Industrials | |
| SubSector: Waste Management | |
| MarketCap: 3075.28 Millions | |
| Recent Price: 44.45 Smart Investing & Trading Score: 88 | |
| Day Percent Change: -0.49% Day Change: -0.22 | |
| Week Change: -0.49% Year-to-date Change: -10.8% | |
| DAR Links: Profile News Message Board | |
| Charts:- Daily , Weekly | |
| Add DAR to Watchlist: View: Get Complete DAR Trend Analysis ➞ | |
 | NYT The New York Times Company |
| Sector: Services & Goods | |
| SubSector: Publishing - Newspapers | |
| MarketCap: 5188.22 Millions | |
| Recent Price: 43.68 Smart Investing & Trading Score: 64 | |
| Day Percent Change: 1.18% Day Change: 0.51 | |
| Week Change: 1.18% Year-to-date Change: -10.8% | |
| NYT Links: Profile News Message Board | |
| Charts:- Daily , Weekly | |
| Add NYT to Watchlist: View: Get Complete NYT Trend Analysis ➞ | |
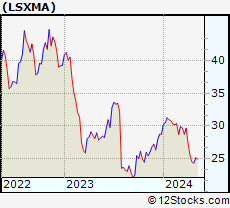 | LSXMA The Liberty SiriusXM Group |
| Sector: Services & Goods | |
| SubSector: Broadcasting - Radio | |
| MarketCap: 14414.5 Millions | |
| Recent Price: 25.60 Smart Investing & Trading Score: 50 | |
| Day Percent Change: 5.31% Day Change: 1.29 | |
| Week Change: 5.31% Year-to-date Change: -10.9% | |
| LSXMA Links: Profile News Message Board | |
| Charts:- Daily , Weekly | |
| Add LSXMA to Watchlist: View: Get Complete LSXMA Trend Analysis ➞ | |
 | DXC DXC Technology Company |
| Sector: Technology | |
| SubSector: Information Technology Services | |
| MarketCap: 3622.28 Millions | |
| Recent Price: 20.36 Smart Investing & Trading Score: 35 | |
| Day Percent Change: 1.37% Day Change: 0.28 | |
| Week Change: 1.37% Year-to-date Change: -11.0% | |
| DXC Links: Profile News Message Board | |
| Charts:- Daily , Weekly | |
| Add DXC to Watchlist: View: Get Complete DXC Trend Analysis ➞ | |
 | CUBE CubeSmart |
| Sector: Financials | |
| SubSector: REIT - Industrial | |
| MarketCap: 4562.99 Millions | |
| Recent Price: 41.24 Smart Investing & Trading Score: 20 | |
| Day Percent Change: 1.19% Day Change: 0.48 | |
| Week Change: 1.19% Year-to-date Change: -11.0% | |
| CUBE Links: Profile News Message Board | |
| Charts:- Daily , Weekly | |
| Add CUBE to Watchlist: View: Get Complete CUBE Trend Analysis ➞ | |
 | EXPD Expeditors International of Washington, Inc. |
| Sector: Transports | |
| SubSector: Air Delivery & Freight Services | |
| MarketCap: 10129.8 Millions | |
| Recent Price: 113.06 Smart Investing & Trading Score: 35 | |
| Day Percent Change: -0.21% Day Change: -0.24 | |
| Week Change: -0.21% Year-to-date Change: -11.1% | |
| EXPD Links: Profile News Message Board | |
| Charts:- Daily , Weekly | |
| Add EXPD to Watchlist: View: Get Complete EXPD Trend Analysis ➞ | |
 | CTSH Cognizant Technology Solutions Corporation |
| Sector: Technology | |
| SubSector: Information Technology Services | |
| MarketCap: 26249.7 Millions | |
| Recent Price: 67.10 Smart Investing & Trading Score: 35 | |
| Day Percent Change: 0.24% Day Change: 0.16 | |
| Week Change: 0.24% Year-to-date Change: -11.2% | |
| CTSH Links: Profile News Message Board | |
| Charts:- Daily , Weekly | |
| Add CTSH to Watchlist: View: Get Complete CTSH Trend Analysis ➞ | |
 | FDS FactSet Research Systems Inc. |
| Sector: Technology | |
| SubSector: Information & Delivery Services | |
| MarketCap: 9024.37 Millions | |
| Recent Price: 423.68 Smart Investing & Trading Score: 42 | |
| Day Percent Change: 0.52% Day Change: 2.21 | |
| Week Change: 0.52% Year-to-date Change: -11.2% | |
| FDS Links: Profile News Message Board | |
| Charts:- Daily , Weekly | |
| Add FDS to Watchlist: View: Get Complete FDS Trend Analysis ➞ | |
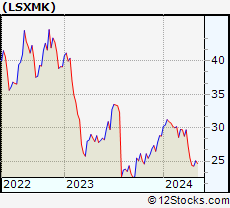 | LSXMK The Liberty SiriusXM Group |
| Sector: Services & Goods | |
| SubSector: Broadcasting - Radio | |
| MarketCap: 5183.95 Millions | |
| Recent Price: 25.54 Smart Investing & Trading Score: 57 | |
| Day Percent Change: 5.21% Day Change: 1.27 | |
| Week Change: 5.21% Year-to-date Change: -11.3% | |
| LSXMK Links: Profile News Message Board | |
| Charts:- Daily , Weekly | |
| Add LSXMK to Watchlist: View: Get Complete LSXMK Trend Analysis ➞ | |
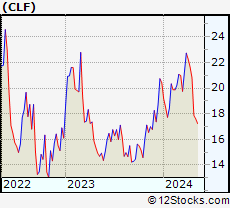 | CLF Cleveland-Cliffs Inc. |
| Sector: Materials | |
| SubSector: Industrial Metals & Minerals | |
| MarketCap: 957.61 Millions | |
| Recent Price: 18.10 Smart Investing & Trading Score: 10 | |
| Day Percent Change: 1.23% Day Change: 0.22 | |
| Week Change: 1.23% Year-to-date Change: -11.4% | |
| CLF Links: Profile News Message Board | |
| Charts:- Daily , Weekly | |
| Add CLF to Watchlist: View: Get Complete CLF Trend Analysis ➞ | |
 | HXL Hexcel Corporation |
| Sector: Industrials | |
| SubSector: Aerospace/Defense Products & Services | |
| MarketCap: 2905.51 Millions | |
| Recent Price: 65.29 Smart Investing & Trading Score: 64 | |
| Day Percent Change: 1.76% Day Change: 1.13 | |
| Week Change: 1.76% Year-to-date Change: -11.5% | |
| HXL Links: Profile News Message Board | |
| Charts:- Daily , Weekly | |
| Add HXL to Watchlist: View: Get Complete HXL Trend Analysis ➞ | |
 | ZM Zoom Video Communications, Inc. |
| Sector: Technology | |
| SubSector: Application Software | |
| MarketCap: 36358.1 Millions | |
| Recent Price: 63.54 Smart Investing & Trading Score: 69 | |
| Day Percent Change: 2.48% Day Change: 1.54 | |
| Week Change: 2.48% Year-to-date Change: -11.6% | |
| ZM Links: Profile News Message Board | |
| Charts:- Daily , Weekly | |
| Add ZM to Watchlist: View: Get Complete ZM Trend Analysis ➞ | |
 | STAG STAG Industrial, Inc. |
| Sector: Financials | |
| SubSector: REIT - Industrial | |
| MarketCap: 3767.49 Millions | |
| Recent Price: 34.64 Smart Investing & Trading Score: 25 | |
| Day Percent Change: 0.46% Day Change: 0.16 | |
| Week Change: 0.46% Year-to-date Change: -11.8% | |
| STAG Links: Profile News Message Board | |
| Charts:- Daily , Weekly | |
| Add STAG to Watchlist: View: Get Complete STAG Trend Analysis ➞ | |
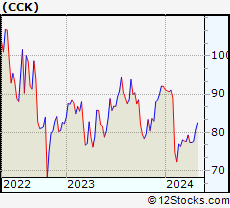 | CCK Crown Holdings, Inc. |
| Sector: Consumer Staples | |
| SubSector: Packaging & Containers | |
| MarketCap: 7198.03 Millions | |
| Recent Price: 81.20 Smart Investing & Trading Score: 74 | |
| Day Percent Change: 0.76% Day Change: 0.61 | |
| Week Change: 0.76% Year-to-date Change: -11.8% | |
| CCK Links: Profile News Message Board | |
| Charts:- Daily , Weekly | |
| Add CCK to Watchlist: View: Get Complete CCK Trend Analysis ➞ | |
 | XEL Xcel Energy Inc. |
| Sector: Utilities | |
| SubSector: Electric Utilities | |
| MarketCap: 28960.8 Millions | |
| Recent Price: 54.56 Smart Investing & Trading Score: 42 | |
| Day Percent Change: 1.11% Day Change: 0.60 | |
| Week Change: 1.11% Year-to-date Change: -11.9% | |
| XEL Links: Profile News Message Board | |
| Charts:- Daily , Weekly | |
| Add XEL to Watchlist: View: Get Complete XEL Trend Analysis ➞ | |
 | KIM Kimco Realty Corporation |
| Sector: Financials | |
| SubSector: REIT - Retail | |
| MarketCap: 5358.64 Millions | |
| Recent Price: 18.67 Smart Investing & Trading Score: 64 | |
| Day Percent Change: 1.58% Day Change: 0.29 | |
| Week Change: 1.58% Year-to-date Change: -12.4% | |
| KIM Links: Profile News Message Board | |
| Charts:- Daily , Weekly | |
| Add KIM to Watchlist: View: Get Complete KIM Trend Analysis ➞ | |
 | LFUS Littelfuse, Inc. |
| Sector: Services & Goods | |
| SubSector: Electronics Wholesale | |
| MarketCap: 2965.23 Millions | |
| Recent Price: 234.26 Smart Investing & Trading Score: 67 | |
| Day Percent Change: 1.13% Day Change: 2.62 | |
| Week Change: 1.13% Year-to-date Change: -12.5% | |
| LFUS Links: Profile News Message Board | |
| Charts:- Daily , Weekly | |
| Add LFUS to Watchlist: View: Get Complete LFUS Trend Analysis ➞ | |
 | NCNO nCino, Inc. |
| Sector: Technology | |
| SubSector: Software Application | |
| MarketCap: 74187 Millions | |
| Recent Price: 29.44 Smart Investing & Trading Score: 20 | |
| Day Percent Change: -0.24% Day Change: -0.07 | |
| Week Change: -0.24% Year-to-date Change: -12.5% | |
| NCNO Links: Profile News Message Board | |
| Charts:- Daily , Weekly | |
| Add NCNO to Watchlist: View: Get Complete NCNO Trend Analysis ➞ | |
 | RH RH |
| Sector: Services & Goods | |
| SubSector: Home Furnishing Stores | |
| MarketCap: 1828.25 Millions | |
| Recent Price: 255.09 Smart Investing & Trading Score: 70 | |
| Day Percent Change: 2.48% Day Change: 6.18 | |
| Week Change: 2.48% Year-to-date Change: -12.5% | |
| RH Links: Profile News Message Board | |
| Charts:- Daily , Weekly | |
| Add RH to Watchlist: View: Get Complete RH Trend Analysis ➞ | |
 | FR First Industrial Realty Trust, Inc. |
| Sector: Financials | |
| SubSector: REIT - Industrial | |
| MarketCap: 3883.39 Millions | |
| Recent Price: 46.09 Smart Investing & Trading Score: 25 | |
| Day Percent Change: 0.18% Day Change: 0.09 | |
| Week Change: 0.18% Year-to-date Change: -12.5% | |
| FR Links: Profile News Message Board | |
| Charts:- Daily , Weekly | |
| Add FR to Watchlist: View: Get Complete FR Trend Analysis ➞ | |
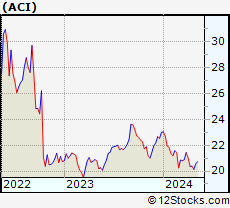 | ACI Albertsons Companies, Inc. |
| Sector: Consumer Staples | |
| SubSector: Grocery Stores | |
| MarketCap: 71347 Millions | |
| Recent Price: 20.12 Smart Investing & Trading Score: 28 | |
| Day Percent Change: -0.05% Day Change: -0.01 | |
| Week Change: -0.05% Year-to-date Change: -12.5% | |
| ACI Links: Profile News Message Board | |
| Charts:- Daily , Weekly | |
| Add ACI to Watchlist: View: Get Complete ACI Trend Analysis ➞ | |
 | PPG PPG Industries, Inc. |
| Sector: Materials | |
| SubSector: Specialty Chemicals | |
| MarketCap: 20285.5 Millions | |
| Recent Price: 130.79 Smart Investing & Trading Score: 35 | |
| Day Percent Change: 0.48% Day Change: 0.63 | |
| Week Change: 0.48% Year-to-date Change: -12.5% | |
| PPG Links: Profile News Message Board | |
| Charts:- Daily , Weekly | |
| Add PPG to Watchlist: View: Get Complete PPG Trend Analysis ➞ | |
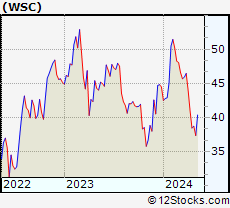 | WSC WillScot Corporation |
| Sector: Transports | |
| SubSector: Rental & Leasing Services | |
| MarketCap: 1050.44 Millions | |
| Recent Price: 38.89 Smart Investing & Trading Score: 49 | |
| Day Percent Change: 0.44% Day Change: 0.17 | |
| Week Change: 0.44% Year-to-date Change: -12.6% | |
| WSC Links: Profile News Message Board | |
| Charts:- Daily , Weekly | |
| Add WSC to Watchlist: View: Get Complete WSC Trend Analysis ➞ | |
 | REG Regency Centers Corporation |
| Sector: Financials | |
| SubSector: REIT - Retail | |
| MarketCap: 6345.84 Millions | |
| Recent Price: 58.47 Smart Investing & Trading Score: 25 | |
| Day Percent Change: 0.33% Day Change: 0.19 | |
| Week Change: 0.33% Year-to-date Change: -12.7% | |
| REG Links: Profile News Message Board | |
| Charts:- Daily , Weekly | |
| Add REG to Watchlist: View: Get Complete REG Trend Analysis ➞ | |
| For tabular summary view of above stock list: Summary View ➞ 0 - 25 , 25 - 50 , 50 - 75 , 75 - 100 , 100 - 125 , 125 - 150 , 150 - 175 , 175 - 200 , 200 - 225 , 225 - 250 , 250 - 275 , 275 - 300 , 300 - 325 , 325 - 350 , 350 - 375 , 375 - 400 , 400 - 425 , 425 - 450 , 450 - 475 , 475 - 500 , 500 - 525 , 525 - 550 , 550 - 575 , 575 - 600 , 600 - 625 , 625 - 650 , 650 - 675 , 675 - 700 , 700 - 725 | ||
| Click To Change The Sort Order: By Market Cap or Company Size Performance: Year-to-date, Week and Day | |
| Select Chart Type: | ||
|
Best Stocks Today 12Stocks.com |
© 2024 12Stocks.com Terms & Conditions Privacy Contact Us
All Information Provided Only For Education And Not To Be Used For Investing or Trading. See Terms & Conditions


One More Thing ... Get Best Stocks Delivered Daily!
Never Ever Miss A Move With Our Top Ten Stocks Lists
Find Best Stocks In Any Market - Bull or Bear Market
Take A Peek At Our Top Ten Stocks Lists: Daily, Weekly, Year-to-Date & Top Trends
Find Best Stocks In Any Market - Bull or Bear Market
Take A Peek At Our Top Ten Stocks Lists: Daily, Weekly, Year-to-Date & Top Trends
Midcap Stocks With Best Up Trends [0-bearish to 100-bullish]: Tandem Diabetes[100], Albemarle [100], Quest Diagnostics[100], Domino s[100], Lazard [100], Aptar [100], LPL Financial[100], Cognex [100], United [100], Owens Corning[100], Highwoods Properties[100]
Best Midcap Stocks Year-to-Date:
Vistra Energy[98.34%], ShockWave Medical[72.86%], EMCOR [66.11%], Spotify [51.73%], Wingstop [50.21%], Natera [49.38%], Antero Resources[48.85%], Pure Storage[47.67%], NRG Energy[43.17%], Interactive Brokers[41.47%], Williams-Sonoma [40.87%] Best Midcap Stocks This Week:
Tandem Diabetes[7.07%], Sunrun [6.46%], Hertz Global[6.45%], Albemarle [6.36%], Liberty SiriusXM[5.31%], Petco Health[5.3%], Liberty SiriusXM[5.21%], Quest Diagnostics[5.18%], Vistra Energy[5.09%], Sirius XM[4.97%], Biogen [4.61%] Best Midcap Stocks Daily:
Tandem Diabetes[7.07%], Sunrun [6.46%], Hertz Global[6.45%], Albemarle [6.36%], Liberty SiriusXM[5.31%], Petco Health[5.30%], Liberty SiriusXM[5.21%], Quest Diagnostics[5.18%], Vistra Energy[5.09%], Sirius XM[4.97%], Biogen [4.61%]