
 Login Sign Up


| |||||
 |  | ||||

| 12Stocks.com Market Intelligence |
Best MidCap Stocks
|
| In a hurry? Mid Cap Stocks Lists: Performance Trends Table, Stock Charts
Sort midcap stocks: Daily, Weekly, Year-to-Date, Market Cap & Trends. Filter midcap stocks list by sector: Show all, Tech, Finance, Energy, Staples, Retail, Industrial, Materials, Utilities and HealthCare Filter midcap stocks list by size:All MidCap Large Mid-Range Small |
| 12Stocks.com Mid Cap Stocks Performances & Trends Daily | |||||||||
|
|  The overall Smart Investing & Trading Score is 63 (0-bearish to 100-bullish) which puts Mid Cap index in short term neutral to bullish trend. The Smart Investing & Trading Score from previous trading session is 44 and an improvement of trend continues.
| ||||||||
Here are the Smart Investing & Trading Scores of the most requested mid cap stocks at 12Stocks.com (click stock name for detailed review):
|


| 12Stocks.com: Top Performing Mid Cap Index Stocks | ||||||||||||||||||||||||||||||||||||||||||||||||
 The top performing Mid Cap Index stocks year to date are
Now, more recently, over last week, the top performing Mid Cap Index stocks on the move are


|
||||||||||||||||||||||||||||||||||||||||||||||||
| 12Stocks.com: Investing in Midcap Index with Stocks | |
|
The following table helps investors and traders sort through current performance and trends (as measured by Smart Investing & Trading Score) of various
stocks in the Midcap Index. Quick View: Move mouse or cursor over stock symbol (ticker) to view short-term technical chart and over stock name to view long term chart. Click on  to add stock symbol to your watchlist and to add stock symbol to your watchlist and  to view watchlist. Click on any ticker or stock name for detailed market intelligence report for that stock. to view watchlist. Click on any ticker or stock name for detailed market intelligence report for that stock. |
12Stocks.com Performance of Stocks in Midcap Index
| Ticker | Stock Name | Watchlist | Category | Recent Price | Smart Investing & Trading Score | Change % | YTD Change% |
| ALK | Alaska Air |   | Transports | 44.16 | 93 | -2.03% | 13.04% |
| RS | Reliance Steel | | Materials | 315.90 | 26 | 0.62% | 12.95% |
| BRKR | Bruker | | Health Care | 82.97 | 63 | 0.62% | 12.92% |
| TSN | Tyson Foods | | Consumer Staples | 60.68 | 100 | -0.49% | 12.89% |
| NVR | NVR | | Industrials | 7891.14 | 63 | 0.72% | 12.72% |
| CHD | Church & Dwight Co | | Consumer Staples | 106.58 | 100 | -0.12% | 12.71% |
| WU | Western Union | | Financials | 13.41 | 75 | 0.11% | 12.54% |
| HUBS | HubSpot | | Technology | 653.27 | 56 | 0.23% | 12.53% |
| DOV | Dover | | Industrials | 173.04 | 68 | 0.44% | 12.50% |
| TRMB | Trimble | | Technology | 59.58 | 68 | -0.18% | 11.99% |
| CPRT | Copart | | Services & Goods | 54.70 | 58 | 0.73% | 11.64% |
| OSK | Oshkosh | | Consumer Staples | 120.90 | 68 | 0.36% | 11.52% |
| USFD | US Foods | | Consumer Staples | 50.62 | 66 | -0.26% | 11.47% |
| AXS | AXIS Capital | | Financials | 61.70 | 63 | -0.89% | 11.42% |
| DCI | Donaldson | | Industrials | 72.74 | 63 | 0.41% | 11.31% |
| WMB | Williams | | Energy | 38.75 | 75 | -0.08% | 11.25% |
| RNR | RenaissanceRe | | Financials | 217.70 | 7 | -1.12% | 11.07% |
| GRMN | Garmin | | Technology | 142.76 | 63 | 0.17% | 11.06% |
| LECO | Loln Electric | | Industrials | 241.31 | 51 | 0.64% | 10.97% |
| LAZ | Lazard | | Financials | 38.61 | 75 | -2.57% | 10.95% |
| WST | West Pharmaceutical | | Health Care | 389.95 | 85 | -0.06% | 10.74% |
| BK | Bank of New York | | Financials | 57.63 | 95 | 0.34% | 10.73% |
| VIRT | Virtu Financial | | Financials | 22.43 | 95 | 5.85% | 10.71% |
| INFA | Informatica | | Technology | 31.44 | 26 | 0.16% | 10.63% |
| HIW | Highwoods Properties | | Financials | 25.39 | 100 | -0.04% | 10.58% |
| For chart view version of above stock list: Chart View ➞ 0 - 25 , 25 - 50 , 50 - 75 , 75 - 100 , 100 - 125 , 125 - 150 , 150 - 175 , 175 - 200 , 200 - 225 , 225 - 250 , 250 - 275 , 275 - 300 , 300 - 325 , 325 - 350 , 350 - 375 , 375 - 400 , 400 - 425 , 425 - 450 , 450 - 475 , 475 - 500 , 500 - 525 , 525 - 550 , 550 - 575 , 575 - 600 , 600 - 625 , 625 - 650 , 650 - 675 , 675 - 700 | ||
 | Click To Change The Sort Order: By Market Cap or Company Size Performance: Year-to-date, Week and Day |  |
|
Get the most comprehensive stock market coverage daily at 12Stocks.com ➞ Best Stocks Today ➞ Best Stocks Weekly ➞ Best Stocks Year-to-Date ➞ Best Stocks Trends ➞  Best Stocks Today 12Stocks.com Best Nasdaq Stocks ➞ Best S&P 500 Stocks ➞ Best Tech Stocks ➞ Best Biotech Stocks ➞ |
| Detailed Overview of Midcap Stocks |
| Midcap Technical Overview, Leaders & Laggards, Top Midcap ETF Funds & Detailed Midcap Stocks List, Charts, Trends & More |
| Midcap: Technical Analysis, Trends & YTD Performance | |
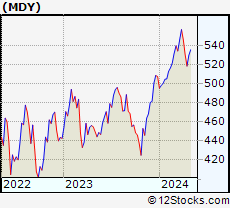
| MidCap segment as represented by
MDY, an exchange-traded fund [ETF], holds basket of about four hundred midcap stocks from across all major sectors of the US stock market. The midcap index (contains stocks like Green Mountain Coffee Roasters and Tractor Supply Company) is up by 4.61% and is currently underperforming the overall market by -1.17% year-to-date. Below is a quick view of technical charts and trends: | |
 MDY Weekly Chart |
|
| Long Term Trend: Very Good | |
| Medium Term Trend: Not Good | |
 MDY Daily Chart |
|
| Short Term Trend: Very Good | |
| Overall Trend Score: 63 | |
| YTD Performance: 4.61% | |
| **Trend Scores & Views Are Only For Educational Purposes And Not For Investing | |
| 12Stocks.com: Investing in Midcap Index using Exchange Traded Funds | |
|
The following table shows list of key exchange traded funds (ETF) that
help investors track Midcap index. The following list also includes leveraged ETF funds that track twice or thrice the daily returns of Midcap indices. Short or inverse ETF funds move in the opposite direction to the index they track and are useful during market pullbacks or during bear markets. Quick View: Move mouse or cursor over ETF symbol (ticker) to view short-term technical chart and over ETF name to view long term chart. Click on ticker or stock name for detailed view. Click on to add stock symbol to your watchlist and to view watchlist. |
12Stocks.com List of ETFs that track Midcap Index
| Ticker | ETF Name | Watchlist | Recent Price | Smart Investing & Trading Score | Change % | Week % | Year-to-date % |
| IJH | iShares Core S&P Mid-Cap | | 57.97 | 68 | 0.21 | 2.46 | 4.58% |
| MDY | SPDR S&P MidCap 400 ETF | | 530.75 | 63 | 0.18 | 2.41 | 4.61% |
| IWS | iShares Russell Mid-Cap Value | | 120.25 | 68 | 0.33 | 2.21 | 3.41% |
| UMDD | ProShares UltraPro MidCap400 | | 23.74 | 63 | -1.53 | 5.22 | 6.36% |
| SMDD | ProShares UltraPro Short MidCap400 | | 11.65 | 32 | -0.01 | -7.27 | -13.47% |
| MYY | ProShares Short MidCap400 | | 20.69 | 32 | -0.22 | -2.34 | -3.55% |
| MZZ | ProShares UltraShort MidCap400 | | 11.64 | 27 | -0.19 | -4.38 | -7.43% |
| 12Stocks.com: Charts, Trends, Fundamental Data and Performances of MidCap Stocks | |
|
We now take in-depth look at all MidCap stocks including charts, multi-period performances and overall trends (as measured by Smart Investing & Trading Score). One can sort MidCap stocks (click link to choose) by Daily, Weekly and by Year-to-Date performances. Also, one can sort by size of the company or by market capitalization. |
| Select Your Default Chart Type: | |||||
| |||||
| Click on stock symbol or name for detailed view. Click on to add stock symbol to your watchlist and to view watchlist. Quick View: Move mouse or cursor over "Daily" to quickly view daily technical stock chart and over "Weekly" to view weekly technical stock chart. | |||||

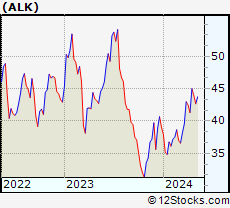 | ALK Alaska Air Group, Inc. |
| Sector: Transports | |
| SubSector: Regional Airlines | |
| MarketCap: 3772.5 Millions | |
| Recent Price: 44.16 Smart Investing & Trading Score: 93 | |
| Day Percent Change: -2.03% Day Change: -0.91 | |
| Week Change: -1.88% Year-to-date Change: 13.0% | |
| ALK Links: Profile News Message Board | |
| Charts:- Daily , Weekly | |
| Add ALK to Watchlist: View: Get Complete ALK Trend Analysis ➞ | |
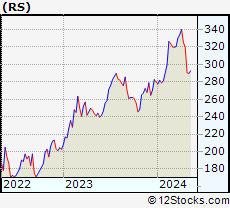 | RS Reliance Steel & Aluminum Co. |
| Sector: Materials | |
| SubSector: Steel & Iron | |
| MarketCap: 5520.48 Millions | |
| Recent Price: 315.90 Smart Investing & Trading Score: 26 | |
| Day Percent Change: 0.62% Day Change: 1.96 | |
| Week Change: -1.12% Year-to-date Change: 13.0% | |
| RS Links: Profile News Message Board | |
| Charts:- Daily , Weekly | |
| Add RS to Watchlist: View: Get Complete RS Trend Analysis ➞ | |
 | BRKR Bruker Corporation |
| Sector: Health Care | |
| SubSector: Medical Laboratories & Research | |
| MarketCap: 5932 Millions | |
| Recent Price: 82.97 Smart Investing & Trading Score: 63 | |
| Day Percent Change: 0.62% Day Change: 0.52 | |
| Week Change: 6.71% Year-to-date Change: 12.9% | |
| BRKR Links: Profile News Message Board | |
| Charts:- Daily , Weekly | |
| Add BRKR to Watchlist: View: Get Complete BRKR Trend Analysis ➞ | |
 | TSN Tyson Foods, Inc. |
| Sector: Consumer Staples | |
| SubSector: Meat Products | |
| MarketCap: 22124.1 Millions | |
| Recent Price: 60.68 Smart Investing & Trading Score: 100 | |
| Day Percent Change: -0.49% Day Change: -0.30 | |
| Week Change: 1.22% Year-to-date Change: 12.9% | |
| TSN Links: Profile News Message Board | |
| Charts:- Daily , Weekly | |
| Add TSN to Watchlist: View: Get Complete TSN Trend Analysis ➞ | |
 | NVR NVR, Inc. |
| Sector: Industrials | |
| SubSector: Residential Construction | |
| MarketCap: 9912.56 Millions | |
| Recent Price: 7891.14 Smart Investing & Trading Score: 63 | |
| Day Percent Change: 0.72% Day Change: 56.03 | |
| Week Change: 2.68% Year-to-date Change: 12.7% | |
| NVR Links: Profile News Message Board | |
| Charts:- Daily , Weekly | |
| Add NVR to Watchlist: View: Get Complete NVR Trend Analysis ➞ | |
 | CHD Church & Dwight Co., Inc. |
| Sector: Consumer Staples | |
| SubSector: Cleaning Products | |
| MarketCap: 17425.7 Millions | |
| Recent Price: 106.58 Smart Investing & Trading Score: 100 | |
| Day Percent Change: -0.12% Day Change: -0.13 | |
| Week Change: 2.14% Year-to-date Change: 12.7% | |
| CHD Links: Profile News Message Board | |
| Charts:- Daily , Weekly | |
| Add CHD to Watchlist: View: Get Complete CHD Trend Analysis ➞ | |
 | WU The Western Union Company |
| Sector: Financials | |
| SubSector: Credit Services | |
| MarketCap: 7974.48 Millions | |
| Recent Price: 13.41 Smart Investing & Trading Score: 75 | |
| Day Percent Change: 0.11% Day Change: 0.01 | |
| Week Change: 3.03% Year-to-date Change: 12.5% | |
| WU Links: Profile News Message Board | |
| Charts:- Daily , Weekly | |
| Add WU to Watchlist: View: Get Complete WU Trend Analysis ➞ | |
 | HUBS HubSpot, Inc. |
| Sector: Technology | |
| SubSector: Application Software | |
| MarketCap: 5715.12 Millions | |
| Recent Price: 653.27 Smart Investing & Trading Score: 56 | |
| Day Percent Change: 0.23% Day Change: 1.49 | |
| Week Change: 3.49% Year-to-date Change: 12.5% | |
| HUBS Links: Profile News Message Board | |
| Charts:- Daily , Weekly | |
| Add HUBS to Watchlist: View: Get Complete HUBS Trend Analysis ➞ | |
 | DOV Dover Corporation |
| Sector: Industrials | |
| SubSector: Diversified Machinery | |
| MarketCap: 10725.6 Millions | |
| Recent Price: 173.04 Smart Investing & Trading Score: 68 | |
| Day Percent Change: 0.44% Day Change: 0.75 | |
| Week Change: 1.88% Year-to-date Change: 12.5% | |
| DOV Links: Profile News Message Board | |
| Charts:- Daily , Weekly | |
| Add DOV to Watchlist: View: Get Complete DOV Trend Analysis ➞ | |
 | TRMB Trimble Inc. |
| Sector: Technology | |
| SubSector: Scientific & Technical Instruments | |
| MarketCap: 7990.33 Millions | |
| Recent Price: 59.58 Smart Investing & Trading Score: 68 | |
| Day Percent Change: -0.18% Day Change: -0.11 | |
| Week Change: 2.78% Year-to-date Change: 12.0% | |
| TRMB Links: Profile News Message Board | |
| Charts:- Daily , Weekly | |
| Add TRMB to Watchlist: View: Get Complete TRMB Trend Analysis ➞ | |
 | CPRT Copart, Inc. |
| Sector: Services & Goods | |
| SubSector: Auto Dealerships | |
| MarketCap: 15462.1 Millions | |
| Recent Price: 54.70 Smart Investing & Trading Score: 58 | |
| Day Percent Change: 0.73% Day Change: 0.39 | |
| Week Change: 3.45% Year-to-date Change: 11.6% | |
| CPRT Links: Profile News Message Board | |
| Charts:- Daily , Weekly | |
| Add CPRT to Watchlist: View: Get Complete CPRT Trend Analysis ➞ | |
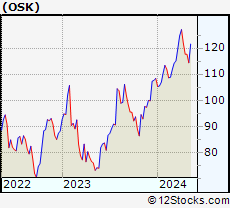 | OSK Oshkosh Corporation |
| Sector: Consumer Staples | |
| SubSector: Trucks & Other Vehicles | |
| MarketCap: 3708 Millions | |
| Recent Price: 120.90 Smart Investing & Trading Score: 68 | |
| Day Percent Change: 0.36% Day Change: 0.43 | |
| Week Change: 2.7% Year-to-date Change: 11.5% | |
| OSK Links: Profile News Message Board | |
| Charts:- Daily , Weekly | |
| Add OSK to Watchlist: View: Get Complete OSK Trend Analysis ➞ | |
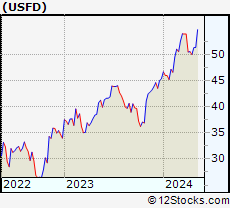 | USFD US Foods Holding Corp. |
| Sector: Consumer Staples | |
| SubSector: Food Wholesale | |
| MarketCap: 3740.99 Millions | |
| Recent Price: 50.62 Smart Investing & Trading Score: 66 | |
| Day Percent Change: -0.26% Day Change: -0.13 | |
| Week Change: 1.16% Year-to-date Change: 11.5% | |
| USFD Links: Profile News Message Board | |
| Charts:- Daily , Weekly | |
| Add USFD to Watchlist: View: Get Complete USFD Trend Analysis ➞ | |
 | AXS AXIS Capital Holdings Limited |
| Sector: Financials | |
| SubSector: Property & Casualty Insurance | |
| MarketCap: 3709.12 Millions | |
| Recent Price: 61.70 Smart Investing & Trading Score: 63 | |
| Day Percent Change: -0.89% Day Change: -0.55 | |
| Week Change: -1.24% Year-to-date Change: 11.4% | |
| AXS Links: Profile News Message Board | |
| Charts:- Daily , Weekly | |
| Add AXS to Watchlist: View: Get Complete AXS Trend Analysis ➞ | |
 | DCI Donaldson Company, Inc. |
| Sector: Industrials | |
| SubSector: Diversified Machinery | |
| MarketCap: 4993.46 Millions | |
| Recent Price: 72.74 Smart Investing & Trading Score: 63 | |
| Day Percent Change: 0.41% Day Change: 0.30 | |
| Week Change: 1.15% Year-to-date Change: 11.3% | |
| DCI Links: Profile News Message Board | |
| Charts:- Daily , Weekly | |
| Add DCI to Watchlist: View: Get Complete DCI Trend Analysis ➞ | |
 | WMB The Williams Companies, Inc. |
| Sector: Energy | |
| SubSector: Oil & Gas Pipelines | |
| MarketCap: 16851.5 Millions | |
| Recent Price: 38.75 Smart Investing & Trading Score: 75 | |
| Day Percent Change: -0.08% Day Change: -0.03 | |
| Week Change: 0.62% Year-to-date Change: 11.3% | |
| WMB Links: Profile News Message Board | |
| Charts:- Daily , Weekly | |
| Add WMB to Watchlist: View: Get Complete WMB Trend Analysis ➞ | |
 | RNR RenaissanceRe Holdings Ltd. |
| Sector: Financials | |
| SubSector: Property & Casualty Insurance | |
| MarketCap: 6153.32 Millions | |
| Recent Price: 217.70 Smart Investing & Trading Score: 7 | |
| Day Percent Change: -1.12% Day Change: -2.47 | |
| Week Change: -3.13% Year-to-date Change: 11.1% | |
| RNR Links: Profile News Message Board | |
| Charts:- Daily , Weekly | |
| Add RNR to Watchlist: View: Get Complete RNR Trend Analysis ➞ | |
 | GRMN Garmin Ltd. |
| Sector: Technology | |
| SubSector: Scientific & Technical Instruments | |
| MarketCap: 13909.3 Millions | |
| Recent Price: 142.76 Smart Investing & Trading Score: 63 | |
| Day Percent Change: 0.17% Day Change: 0.25 | |
| Week Change: 2.32% Year-to-date Change: 11.1% | |
| GRMN Links: Profile News Message Board | |
| Charts:- Daily , Weekly | |
| Add GRMN to Watchlist: View: Get Complete GRMN Trend Analysis ➞ | |
 | LECO Lincoln Electric Holdings, Inc. |
| Sector: Industrials | |
| SubSector: Small Tools & Accessories | |
| MarketCap: 4085.06 Millions | |
| Recent Price: 241.31 Smart Investing & Trading Score: 51 | |
| Day Percent Change: 0.64% Day Change: 1.54 | |
| Week Change: 1.24% Year-to-date Change: 11.0% | |
| LECO Links: Profile News Message Board | |
| Charts:- Daily , Weekly | |
| Add LECO to Watchlist: View: Get Complete LECO Trend Analysis ➞ | |
 | LAZ Lazard Ltd |
| Sector: Financials | |
| SubSector: Asset Management | |
| MarketCap: 3061.13 Millions | |
| Recent Price: 38.61 Smart Investing & Trading Score: 75 | |
| Day Percent Change: -2.57% Day Change: -1.02 | |
| Week Change: 1.85% Year-to-date Change: 11.0% | |
| LAZ Links: Profile News Message Board | |
| Charts:- Daily , Weekly | |
| Add LAZ to Watchlist: View: Get Complete LAZ Trend Analysis ➞ | |
 | WST West Pharmaceutical Services, Inc. |
| Sector: Health Care | |
| SubSector: Medical Instruments & Supplies | |
| MarketCap: 9989 Millions | |
| Recent Price: 389.95 Smart Investing & Trading Score: 85 | |
| Day Percent Change: -0.06% Day Change: -0.25 | |
| Week Change: 4.81% Year-to-date Change: 10.7% | |
| WST Links: Profile News Message Board | |
| Charts:- Daily , Weekly | |
| Add WST to Watchlist: View: Get Complete WST Trend Analysis ➞ | |
 | BK The Bank of New York Mellon Corporation |
| Sector: Financials | |
| SubSector: Asset Management | |
| MarketCap: 29807.5 Millions | |
| Recent Price: 57.63 Smart Investing & Trading Score: 95 | |
| Day Percent Change: 0.34% Day Change: 0.20 | |
| Week Change: 2.39% Year-to-date Change: 10.7% | |
| BK Links: Profile News Message Board | |
| Charts:- Daily , Weekly | |
| Add BK to Watchlist: View: Get Complete BK Trend Analysis ➞ | |
 | VIRT Virtu Financial, Inc. |
| Sector: Financials | |
| SubSector: Investment Brokerage - National | |
| MarketCap: 4305.15 Millions | |
| Recent Price: 22.43 Smart Investing & Trading Score: 95 | |
| Day Percent Change: 5.85% Day Change: 1.24 | |
| Week Change: 6.51% Year-to-date Change: 10.7% | |
| VIRT Links: Profile News Message Board | |
| Charts:- Daily , Weekly | |
| Add VIRT to Watchlist: View: Get Complete VIRT Trend Analysis ➞ | |
 | INFA Informatica Inc. |
| Sector: Technology | |
| SubSector: Software - Infrastructure | |
| MarketCap: 5340 Millions | |
| Recent Price: 31.44 Smart Investing & Trading Score: 26 | |
| Day Percent Change: 0.16% Day Change: 0.05 | |
| Week Change: -10.66% Year-to-date Change: 10.6% | |
| INFA Links: Profile News Message Board | |
| Charts:- Daily , Weekly | |
| Add INFA to Watchlist: View: Get Complete INFA Trend Analysis ➞ | |
 | HIW Highwoods Properties, Inc. |
| Sector: Financials | |
| SubSector: REIT - Office | |
| MarketCap: 3227.46 Millions | |
| Recent Price: 25.39 Smart Investing & Trading Score: 100 | |
| Day Percent Change: -0.04% Day Change: -0.01 | |
| Week Change: 5% Year-to-date Change: 10.6% | |
| HIW Links: Profile News Message Board | |
| Charts:- Daily , Weekly | |
| Add HIW to Watchlist: View: Get Complete HIW Trend Analysis ➞ | |
| For tabular summary view of above stock list: Summary View ➞ 0 - 25 , 25 - 50 , 50 - 75 , 75 - 100 , 100 - 125 , 125 - 150 , 150 - 175 , 175 - 200 , 200 - 225 , 225 - 250 , 250 - 275 , 275 - 300 , 300 - 325 , 325 - 350 , 350 - 375 , 375 - 400 , 400 - 425 , 425 - 450 , 450 - 475 , 475 - 500 , 500 - 525 , 525 - 550 , 550 - 575 , 575 - 600 , 600 - 625 , 625 - 650 , 650 - 675 , 675 - 700 | ||
| Click To Change The Sort Order: By Market Cap or Company Size Performance: Year-to-date, Week and Day | |
| Select Chart Type: | ||
|
Best Stocks Today 12Stocks.com |
© 2024 12Stocks.com Terms & Conditions Privacy Contact Us
All Information Provided Only For Education And Not To Be Used For Investing or Trading. See Terms & Conditions


One More Thing ... Get Best Stocks Delivered Daily!
Never Ever Miss A Move With Our Top Ten Stocks Lists
Find Best Stocks In Any Market - Bull or Bear Market
Take A Peek At Our Top Ten Stocks Lists: Daily, Weekly, Year-to-Date & Top Trends
Find Best Stocks In Any Market - Bull or Bear Market
Take A Peek At Our Top Ten Stocks Lists: Daily, Weekly, Year-to-Date & Top Trends
Midcap Stocks With Best Up Trends [0-bearish to 100-bullish]: Hasbro [100], Synchrony Financial[100], Range Resources[100], EQT [100], Generac [100], Equity Residential[100], Cullen/Frost Bankers[100], BOK Financial[100], Manpower [100], Citizens Financial[100], Popular [100]
Best Midcap Stocks Year-to-Date:
AppLovin [77.16%], Constellation Energy[61.03%], EMCOR [59.44%], Natera [47.61%], Pure Storage[45.95%], Williams-Sonoma [41.67%], CAVA [40.98%], Wingstop [40.72%], DICK S[40.62%], Core & Main[40.33%], Robinhood Markets[40.3%] Best Midcap Stocks This Week:
HashiCorp [22.53%], Hasbro [17.26%], Tandem Diabetes[14.57%], Wabtec [14.19%], Watsco [13.36%], Coinbase Global[12.23%], Microchip [11.51%], Ryder System[11.34%], CoStar [11.18%], Crane Co[9.33%], Rocket [8.91%] Best Midcap Stocks Daily:
Hasbro [11.47%], Wabtec [10.88%], CoStar [10.71%], Watsco [8.79%], ON Semiconductor[6.73%], Allegro Micro[6.51%], Biogen [6.32%], Virtu Financial[5.85%], Hilton Worldwide[5.73%], Microchip [5.67%], Lattice Semiconductor[5.56%]