
 Login Sign Up


| |||||
 |  | ||||

| 12Stocks.com Market Intelligence |
Best MidCap Stocks
|
| In a hurry? Mid Cap Stocks Lists: Performance Trends Table, Stock Charts
Sort midcap stocks: Daily, Weekly, Year-to-Date, Market Cap & Trends. Filter midcap stocks list by sector: Show all, Tech, Finance, Energy, Staples, Retail, Industrial, Materials, Utilities and HealthCare Filter midcap stocks list by size:All MidCap Large Mid-Range Small |
| 12Stocks.com Mid Cap Stocks Performances & Trends Daily | |||||||||
|
|  The overall Smart Investing & Trading Score is 63 (0-bearish to 100-bullish) which puts Mid Cap index in short term neutral to bullish trend. The Smart Investing & Trading Score from previous trading session is 44 and an improvement of trend continues.
| ||||||||
Here are the Smart Investing & Trading Scores of the most requested mid cap stocks at 12Stocks.com (click stock name for detailed review):
|


| 12Stocks.com: Top Performing Mid Cap Index Stocks | ||||||||||||||||||||||||||||||||||||||||||||||||
 The top performing Mid Cap Index stocks year to date are
Now, more recently, over last week, the top performing Mid Cap Index stocks on the move are


|
||||||||||||||||||||||||||||||||||||||||||||||||
| 12Stocks.com: Investing in Midcap Index with Stocks | |
|
The following table helps investors and traders sort through current performance and trends (as measured by Smart Investing & Trading Score) of various
stocks in the Midcap Index. Quick View: Move mouse or cursor over stock symbol (ticker) to view short-term technical chart and over stock name to view long term chart. Click on  to add stock symbol to your watchlist and to add stock symbol to your watchlist and  to view watchlist. Click on any ticker or stock name for detailed market intelligence report for that stock. to view watchlist. Click on any ticker or stock name for detailed market intelligence report for that stock. |
12Stocks.com Performance of Stocks in Midcap Index
| Ticker | Stock Name | Watchlist | Category | Recent Price | Smart Investing & Trading Score | Change % | YTD Change% |
| DRVN | Driven |   | Services & Goods | 14.75 | 61 | 2.47% | 2.75% |
| WEN | Wendy s | | Services & Goods | 19.98 | 100 | 1.40% | 2.59% |
| GGG | Graco | | Industrials | 89.01 | 58 | 0.92% | 2.59% |
| PTC | PTC | | Technology | 179.48 | 25 | 0.52% | 2.58% |
| GWRE | Guidewire Software | | Technology | 111.71 | 32 | 1.75% | 2.45% |
| ED | Consolidated Edison | | Utilities | 92.99 | 100 | 0.28% | 2.22% |
| PCOR | Procore Technologies | | Technology | 71.41 | 38 | 1.17% | 2.18% |
| MTD | Mettler-Toledo | | Health Care | 1239.14 | 68 | 3.31% | 2.16% |
| DLR | Digital Realty | | Financials | 137.49 | 18 | 1.20% | 2.16% |
| SAIC | Science Applications | | Technology | 126.93 | 62 | 1.44% | 2.10% |
| CAH | Cardinal Health | | Services & Goods | 102.91 | 0 | 0.08% | 2.09% |
| CLX | Clorox | | Consumer Staples | 145.46 | 60 | 0.22% | 2.01% |
| JKHY | Jack Henry | | Technology | 166.70 | 55 | 1.13% | 2.01% |
| PAYX | Paychex | | Services & Goods | 121.38 | 73 | 0.12% | 1.90% |
| TPG | TPG | | Financials | 44.07 | 63 | 1.97% | 1.86% |
| ACM | AECOM | | Services & Goods | 94.11 | 54 | 1.58% | 1.82% |
| BYD | Boyd Gaming | | Services & Goods | 63.70 | 48 | 0.74% | 1.75% |
| LUV | Southwest Airlines | | Transports | 29.38 | 62 | -1.18% | 1.73% |
| ARW | Arrow Electronics | | Services & Goods | 124.36 | 68 | 0.88% | 1.73% |
| AFL | Aflac | | Financials | 83.90 | 62 | 0.45% | 1.70% |
| ATO | Atmos Energy | | Utilities | 117.85 | 100 | -0.19% | 1.68% |
| CRUS | Cirrus Logic | | Technology | 84.50 | 53 | 0.04% | 1.57% |
| OMF | OneMain | | Financials | 49.97 | 93 | 1.65% | 1.57% |
| CRL | Charles River | | Health Care | 239.75 | 63 | 3.09% | 1.42% |
| KEY | KeyCorp | | Financials | 14.60 | 68 | -0.27% | 1.39% |
| For chart view version of above stock list: Chart View ➞ 0 - 25 , 25 - 50 , 50 - 75 , 75 - 100 , 100 - 125 , 125 - 150 , 150 - 175 , 175 - 200 , 200 - 225 , 225 - 250 , 250 - 275 , 275 - 300 , 300 - 325 , 325 - 350 , 350 - 375 , 375 - 400 , 400 - 425 , 425 - 450 , 450 - 475 , 475 - 500 , 500 - 525 , 525 - 550 , 550 - 575 , 575 - 600 , 600 - 625 , 625 - 650 , 650 - 675 | ||
 | Click To Change The Sort Order: By Market Cap or Company Size Performance: Year-to-date, Week and Day |  |
|
Get the most comprehensive stock market coverage daily at 12Stocks.com ➞ Best Stocks Today ➞ Best Stocks Weekly ➞ Best Stocks Year-to-Date ➞ Best Stocks Trends ➞  Best Stocks Today 12Stocks.com Best Nasdaq Stocks ➞ Best S&P 500 Stocks ➞ Best Tech Stocks ➞ Best Biotech Stocks ➞ |
| Detailed Overview of Midcap Stocks |
| Midcap Technical Overview, Leaders & Laggards, Top Midcap ETF Funds & Detailed Midcap Stocks List, Charts, Trends & More |
| Midcap: Technical Analysis, Trends & YTD Performance | |
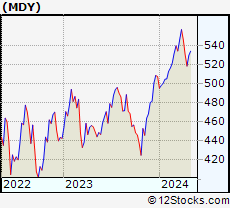
| MidCap segment as represented by
MDY, an exchange-traded fund [ETF], holds basket of about four hundred midcap stocks from across all major sectors of the US stock market. The midcap index (contains stocks like Green Mountain Coffee Roasters and Tractor Supply Company) is up by 4.36% and is currently underperforming the overall market by -1.13% year-to-date. Below is a quick view of technical charts and trends: | |
 MDY Weekly Chart |
|
| Long Term Trend: Very Good | |
| Medium Term Trend: Not Good | |
 MDY Daily Chart |
|
| Short Term Trend: Very Good | |
| Overall Trend Score: 63 | |
| YTD Performance: 4.36% | |
| **Trend Scores & Views Are Only For Educational Purposes And Not For Investing | |
| 12Stocks.com: Investing in Midcap Index using Exchange Traded Funds | |
|
The following table shows list of key exchange traded funds (ETF) that
help investors track Midcap index. The following list also includes leveraged ETF funds that track twice or thrice the daily returns of Midcap indices. Short or inverse ETF funds move in the opposite direction to the index they track and are useful during market pullbacks or during bear markets. Quick View: Move mouse or cursor over ETF symbol (ticker) to view short-term technical chart and over ETF name to view long term chart. Click on ticker or stock name for detailed view. Click on to add stock symbol to your watchlist and to view watchlist. |
12Stocks.com List of ETFs that track Midcap Index
| Ticker | ETF Name | Watchlist | Recent Price | Smart Investing & Trading Score | Change % | Week % | Year-to-date % |
| IJH | iShares Core S&P Mid-Cap | | 57.81 | 56 | 1.76 | 2.18 | 4.3% |
| IWR | iShares Russell Mid-Cap | | 80.22 | 56 | 1.05 | 1.98 | 3.2% |
| MDY | SPDR S&P MidCap 400 ETF | | 529.49 | 63 | 1.14 | 2.16 | 4.36% |
| IJK | iShares S&P Mid-Cap 400 Growth | | 86.84 | 56 | 1.47 | 2.35 | 9.62% |
| IWP | iShares Russell Mid-Cap Growth | | 108.34 | 51 | 1.53 | 2.5 | 3.71% |
| IWS | iShares Russell Mid-Cap Value | | 119.73 | 68 | 0.78 | 1.77 | 2.96% |
| IJJ | iShares S&P Mid-Cap 400 Value | | 112.69 | 63 | 1.03 | 1.93 | -1.19% |
| UMDD | ProShares UltraPro MidCap400 | | 24.02 | 63 | 3.65 | 6.44 | 7.59% |
| SMDD | ProShares UltraPro Short MidCap400 | | 11.78 | 32 | -2.72 | -6.22 | -12.5% |
| XMLV | PowerShares S&P MidCap Low Volatil ETF | | 54.96 | 75 | 0.77 | 1.48 | 3.35% |
| MZZ | ProShares UltraShort MidCap400 | | 11.63 | 27 | -2.76 | -4.44 | -7.48% |
| MVV | ProShares Ultra MidCap400 | | 61.70 | 56 | 2.34 | 4.58 | 6.58% |
| MYY | ProShares Short MidCap400 | | 20.89 | 32 | -0.38 | -1.41 | -2.63% |
| 12Stocks.com: Charts, Trends, Fundamental Data and Performances of MidCap Stocks | |
|
We now take in-depth look at all MidCap stocks including charts, multi-period performances and overall trends (as measured by Smart Investing & Trading Score). One can sort MidCap stocks (click link to choose) by Daily, Weekly and by Year-to-Date performances. Also, one can sort by size of the company or by market capitalization. |
| Select Your Default Chart Type: | |||||
| |||||
| Click on stock symbol or name for detailed view. Click on to add stock symbol to your watchlist and to view watchlist. Quick View: Move mouse or cursor over "Daily" to quickly view daily technical stock chart and over "Weekly" to view weekly technical stock chart. | |||||

 | DRVN Driven Brands Holdings Inc. |
| Sector: Services & Goods | |
| SubSector: Auto & Truck Dealerships | |
| MarketCap: 4490 Millions | |
| Recent Price: 14.75 Smart Investing & Trading Score: 61 | |
| Day Percent Change: 2.47% Day Change: 0.36 | |
| Week Change: 4.54% Year-to-date Change: 2.8% | |
| DRVN Links: Profile News Message Board | |
| Charts:- Daily , Weekly | |
| Add DRVN to Watchlist: View: Get Complete DRVN Trend Analysis ➞ | |
 | WEN The Wendy s Company |
| Sector: Services & Goods | |
| SubSector: Restaurants | |
| MarketCap: 2814.9 Millions | |
| Recent Price: 19.98 Smart Investing & Trading Score: 100 | |
| Day Percent Change: 1.40% Day Change: 0.27 | |
| Week Change: 3.82% Year-to-date Change: 2.6% | |
| WEN Links: Profile News Message Board | |
| Charts:- Daily , Weekly | |
| Add WEN to Watchlist: View: Get Complete WEN Trend Analysis ➞ | |
 | GGG Graco Inc. |
| Sector: Industrials | |
| SubSector: Diversified Machinery | |
| MarketCap: 7739.76 Millions | |
| Recent Price: 89.01 Smart Investing & Trading Score: 58 | |
| Day Percent Change: 0.92% Day Change: 0.81 | |
| Week Change: 0.71% Year-to-date Change: 2.6% | |
| GGG Links: Profile News Message Board | |
| Charts:- Daily , Weekly | |
| Add GGG to Watchlist: View: Get Complete GGG Trend Analysis ➞ | |
 | PTC PTC Inc. |
| Sector: Technology | |
| SubSector: Technical & System Software | |
| MarketCap: 6166.7 Millions | |
| Recent Price: 179.48 Smart Investing & Trading Score: 25 | |
| Day Percent Change: 0.52% Day Change: 0.93 | |
| Week Change: 1.76% Year-to-date Change: 2.6% | |
| PTC Links: Profile News Message Board | |
| Charts:- Daily , Weekly | |
| Add PTC to Watchlist: View: Get Complete PTC Trend Analysis ➞ | |
 | GWRE Guidewire Software, Inc. |
| Sector: Technology | |
| SubSector: Business Software & Services | |
| MarketCap: 7073.18 Millions | |
| Recent Price: 111.71 Smart Investing & Trading Score: 32 | |
| Day Percent Change: 1.75% Day Change: 1.92 | |
| Week Change: 3.78% Year-to-date Change: 2.5% | |
| GWRE Links: Profile News Message Board | |
| Charts:- Daily , Weekly | |
| Add GWRE to Watchlist: View: Get Complete GWRE Trend Analysis ➞ | |
 | ED Consolidated Edison, Inc. |
| Sector: Utilities | |
| SubSector: Electric Utilities | |
| MarketCap: 25012.3 Millions | |
| Recent Price: 92.99 Smart Investing & Trading Score: 100 | |
| Day Percent Change: 0.28% Day Change: 0.26 | |
| Week Change: 1.33% Year-to-date Change: 2.2% | |
| ED Links: Profile News Message Board | |
| Charts:- Daily , Weekly | |
| Add ED to Watchlist: View: Get Complete ED Trend Analysis ➞ | |
 | PCOR Procore Technologies, Inc. |
| Sector: Technology | |
| SubSector: Software - Application | |
| MarketCap: 9180 Millions | |
| Recent Price: 71.41 Smart Investing & Trading Score: 38 | |
| Day Percent Change: 1.17% Day Change: 0.83 | |
| Week Change: 1.59% Year-to-date Change: 2.2% | |
| PCOR Links: Profile News Message Board | |
| Charts:- Daily , Weekly | |
| Add PCOR to Watchlist: View: Get Complete PCOR Trend Analysis ➞ | |
 | MTD Mettler-Toledo International Inc. |
| Sector: Health Care | |
| SubSector: Medical Instruments & Supplies | |
| MarketCap: 15973.1 Millions | |
| Recent Price: 1239.14 Smart Investing & Trading Score: 68 | |
| Day Percent Change: 3.31% Day Change: 39.68 | |
| Week Change: 4.26% Year-to-date Change: 2.2% | |
| MTD Links: Profile News Message Board | |
| Charts:- Daily , Weekly | |
| Add MTD to Watchlist: View: Get Complete MTD Trend Analysis ➞ | |
 | DLR Digital Realty Trust, Inc. |
| Sector: Financials | |
| SubSector: REIT - Office | |
| MarketCap: 27038.6 Millions | |
| Recent Price: 137.49 Smart Investing & Trading Score: 18 | |
| Day Percent Change: 1.20% Day Change: 1.63 | |
| Week Change: 0.48% Year-to-date Change: 2.2% | |
| DLR Links: Profile News Message Board | |
| Charts:- Daily , Weekly | |
| Add DLR to Watchlist: View: Get Complete DLR Trend Analysis ➞ | |
 | SAIC Science Applications International Corporation |
| Sector: Technology | |
| SubSector: Information Technology Services | |
| MarketCap: 3388.78 Millions | |
| Recent Price: 126.93 Smart Investing & Trading Score: 62 | |
| Day Percent Change: 1.44% Day Change: 1.80 | |
| Week Change: 1.59% Year-to-date Change: 2.1% | |
| SAIC Links: Profile News Message Board | |
| Charts:- Daily , Weekly | |
| Add SAIC to Watchlist: View: Get Complete SAIC Trend Analysis ➞ | |
 | CAH Cardinal Health, Inc. |
| Sector: Services & Goods | |
| SubSector: Drugs Wholesale | |
| MarketCap: 14509.9 Millions | |
| Recent Price: 102.91 Smart Investing & Trading Score: 0 | |
| Day Percent Change: 0.08% Day Change: 0.08 | |
| Week Change: -4.88% Year-to-date Change: 2.1% | |
| CAH Links: Profile News Message Board | |
| Charts:- Daily , Weekly | |
| Add CAH to Watchlist: View: Get Complete CAH Trend Analysis ➞ | |
 | CLX The Clorox Company |
| Sector: Consumer Staples | |
| SubSector: Housewares & Accessories | |
| MarketCap: 23688.3 Millions | |
| Recent Price: 145.46 Smart Investing & Trading Score: 60 | |
| Day Percent Change: 0.22% Day Change: 0.32 | |
| Week Change: 1.33% Year-to-date Change: 2.0% | |
| CLX Links: Profile News Message Board | |
| Charts:- Daily , Weekly | |
| Add CLX to Watchlist: View: Get Complete CLX Trend Analysis ➞ | |
 | JKHY Jack Henry & Associates, Inc. |
| Sector: Technology | |
| SubSector: Information Technology Services | |
| MarketCap: 10695.4 Millions | |
| Recent Price: 166.70 Smart Investing & Trading Score: 55 | |
| Day Percent Change: 1.13% Day Change: 1.86 | |
| Week Change: 0.66% Year-to-date Change: 2.0% | |
| JKHY Links: Profile News Message Board | |
| Charts:- Daily , Weekly | |
| Add JKHY to Watchlist: View: Get Complete JKHY Trend Analysis ➞ | |
 | PAYX Paychex, Inc. |
| Sector: Services & Goods | |
| SubSector: Staffing & Outsourcing Services | |
| MarketCap: 20928.8 Millions | |
| Recent Price: 121.38 Smart Investing & Trading Score: 73 | |
| Day Percent Change: 0.12% Day Change: 0.14 | |
| Week Change: 1.55% Year-to-date Change: 1.9% | |
| PAYX Links: Profile News Message Board | |
| Charts:- Daily , Weekly | |
| Add PAYX to Watchlist: View: Get Complete PAYX Trend Analysis ➞ | |
 | TPG TPG Inc. |
| Sector: Financials | |
| SubSector: Asset Management | |
| MarketCap: 8700 Millions | |
| Recent Price: 44.07 Smart Investing & Trading Score: 63 | |
| Day Percent Change: 1.97% Day Change: 0.85 | |
| Week Change: 3.74% Year-to-date Change: 1.9% | |
| TPG Links: Profile News Message Board | |
| Charts:- Daily , Weekly | |
| Add TPG to Watchlist: View: Get Complete TPG Trend Analysis ➞ | |
 | ACM AECOM |
| Sector: Services & Goods | |
| SubSector: Technical Services | |
| MarketCap: 4781.9 Millions | |
| Recent Price: 94.11 Smart Investing & Trading Score: 54 | |
| Day Percent Change: 1.58% Day Change: 1.46 | |
| Week Change: 0.81% Year-to-date Change: 1.8% | |
| ACM Links: Profile News Message Board | |
| Charts:- Daily , Weekly | |
| Add ACM to Watchlist: View: Get Complete ACM Trend Analysis ➞ | |
 | BYD Boyd Gaming Corporation |
| Sector: Services & Goods | |
| SubSector: Resorts & Casinos | |
| MarketCap: 1652.54 Millions | |
| Recent Price: 63.70 Smart Investing & Trading Score: 48 | |
| Day Percent Change: 0.74% Day Change: 0.46 | |
| Week Change: 1.67% Year-to-date Change: 1.8% | |
| BYD Links: Profile News Message Board | |
| Charts:- Daily , Weekly | |
| Add BYD to Watchlist: View: Get Complete BYD Trend Analysis ➞ | |
 | LUV Southwest Airlines Co. |
| Sector: Transports | |
| SubSector: Regional Airlines | |
| MarketCap: 19463.3 Millions | |
| Recent Price: 29.38 Smart Investing & Trading Score: 62 | |
| Day Percent Change: -1.18% Day Change: -0.35 | |
| Week Change: 0% Year-to-date Change: 1.7% | |
| LUV Links: Profile News Message Board | |
| Charts:- Daily , Weekly | |
| Add LUV to Watchlist: View: Get Complete LUV Trend Analysis ➞ | |
 | ARW Arrow Electronics, Inc. |
| Sector: Services & Goods | |
| SubSector: Electronics Wholesale | |
| MarketCap: 4155.03 Millions | |
| Recent Price: 124.36 Smart Investing & Trading Score: 68 | |
| Day Percent Change: 0.88% Day Change: 1.08 | |
| Week Change: 2.18% Year-to-date Change: 1.7% | |
| ARW Links: Profile News Message Board | |
| Charts:- Daily , Weekly | |
| Add ARW to Watchlist: View: Get Complete ARW Trend Analysis ➞ | |
 | AFL Aflac Incorporated |
| Sector: Financials | |
| SubSector: Accident & Health Insurance | |
| MarketCap: 22706 Millions | |
| Recent Price: 83.90 Smart Investing & Trading Score: 62 | |
| Day Percent Change: 0.45% Day Change: 0.38 | |
| Week Change: 0.8% Year-to-date Change: 1.7% | |
| AFL Links: Profile News Message Board | |
| Charts:- Daily , Weekly | |
| Add AFL to Watchlist: View: Get Complete AFL Trend Analysis ➞ | |
 | ATO Atmos Energy Corporation |
| Sector: Utilities | |
| SubSector: Gas Utilities | |
| MarketCap: 11449 Millions | |
| Recent Price: 117.85 Smart Investing & Trading Score: 100 | |
| Day Percent Change: -0.19% Day Change: -0.23 | |
| Week Change: 0.55% Year-to-date Change: 1.7% | |
| ATO Links: Profile News Message Board | |
| Charts:- Daily , Weekly | |
| Add ATO to Watchlist: View: Get Complete ATO Trend Analysis ➞ | |
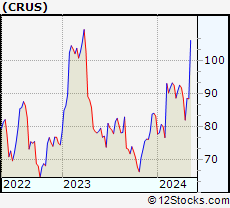 | CRUS Cirrus Logic, Inc. |
| Sector: Technology | |
| SubSector: Semiconductor - Specialized | |
| MarketCap: 3852.6 Millions | |
| Recent Price: 84.50 Smart Investing & Trading Score: 53 | |
| Day Percent Change: 0.04% Day Change: 0.03 | |
| Week Change: 3.02% Year-to-date Change: 1.6% | |
| CRUS Links: Profile News Message Board | |
| Charts:- Daily , Weekly | |
| Add CRUS to Watchlist: View: Get Complete CRUS Trend Analysis ➞ | |
 | OMF OneMain Holdings, Inc. |
| Sector: Financials | |
| SubSector: Credit Services | |
| MarketCap: 2753.38 Millions | |
| Recent Price: 49.97 Smart Investing & Trading Score: 93 | |
| Day Percent Change: 1.65% Day Change: 0.81 | |
| Week Change: 2.61% Year-to-date Change: 1.6% | |
| OMF Links: Profile News Message Board | |
| Charts:- Daily , Weekly | |
| Add OMF to Watchlist: View: Get Complete OMF Trend Analysis ➞ | |
 | CRL Charles River Laboratories International, Inc. |
| Sector: Health Care | |
| SubSector: Medical Laboratories & Research | |
| MarketCap: 5700.5 Millions | |
| Recent Price: 239.75 Smart Investing & Trading Score: 63 | |
| Day Percent Change: 3.09% Day Change: 7.19 | |
| Week Change: 5.72% Year-to-date Change: 1.4% | |
| CRL Links: Profile News Message Board | |
| Charts:- Daily , Weekly | |
| Add CRL to Watchlist: View: Get Complete CRL Trend Analysis ➞ | |
 | KEY KeyCorp |
| Sector: Financials | |
| SubSector: Regional - Midwest Banks | |
| MarketCap: 10045 Millions | |
| Recent Price: 14.60 Smart Investing & Trading Score: 68 | |
| Day Percent Change: -0.27% Day Change: -0.04 | |
| Week Change: -0.21% Year-to-date Change: 1.4% | |
| KEY Links: Profile News Message Board | |
| Charts:- Daily , Weekly | |
| Add KEY to Watchlist: View: Get Complete KEY Trend Analysis ➞ | |
| For tabular summary view of above stock list: Summary View ➞ 0 - 25 , 25 - 50 , 50 - 75 , 75 - 100 , 100 - 125 , 125 - 150 , 150 - 175 , 175 - 200 , 200 - 225 , 225 - 250 , 250 - 275 , 275 - 300 , 300 - 325 , 325 - 350 , 350 - 375 , 375 - 400 , 400 - 425 , 425 - 450 , 450 - 475 , 475 - 500 , 500 - 525 , 525 - 550 , 550 - 575 , 575 - 600 , 600 - 625 , 625 - 650 , 650 - 675 | ||
| Click To Change The Sort Order: By Market Cap or Company Size Performance: Year-to-date, Week and Day | |
| Select Chart Type: | ||
|
Best Stocks Today 12Stocks.com |
© 2024 12Stocks.com Terms & Conditions Privacy Contact Us
All Information Provided Only For Education And Not To Be Used For Investing or Trading. See Terms & Conditions


One More Thing ... Get Best Stocks Delivered Daily!
Never Ever Miss A Move With Our Top Ten Stocks Lists
Find Best Stocks In Any Market - Bull or Bear Market
Take A Peek At Our Top Ten Stocks Lists: Daily, Weekly, Year-to-Date & Top Trends
Find Best Stocks In Any Market - Bull or Bear Market
Take A Peek At Our Top Ten Stocks Lists: Daily, Weekly, Year-to-Date & Top Trends
Midcap Stocks With Best Up Trends [0-bearish to 100-bullish]: Quest Diagnostics[100], Popular [100], HEICO [100], BioMarin Pharmaceutical[100], Wendy s[100], Equity Residential[100], Commerce Bancshares[100], EQT [100], Essex Property[100], Fifth Third[100], AvalonBay Communities[100]
Best Midcap Stocks Year-to-Date:
AppLovin [78.09%], Constellation Energy[59.81%], EMCOR [57.06%], Natera [45.83%], Pure Storage[45.04%], Williams-Sonoma [41.09%], CAVA [40.77%], Wingstop [40.54%], Robinhood Markets[39.59%], DICK S[39.31%], Coupang [39.07%] Best Midcap Stocks This Week:
Coinbase Global[12.08%], Kohl s[11%], Tandem Diabetes[10.37%], Ryder System[10.34%], AMC Entertainment[9.65%], Repligen [9.19%], New York[7.97%], Enphase Energy[7.28%], Natera [7.11%], Wayfair [6.89%], Confluent [6.88%] Best Midcap Stocks Daily:
Ryder System[10.05%], Repligen [8.96%], Sunrun [7.86%], Ginkgo Bioworks[7.58%], Viasat [6.51%], Tandem Diabetes[5.75%], Plug Power[5.62%], Roblox [5.23%], Crane Co[5.01%], Confluent [5.01%], Bruker [4.93%]