
 Login Sign Up


| |||||
 |  | ||||

| 12Stocks.com Market Intelligence |
Best Latin America Stocks
|
|
| Quick Read: Top Latin America Stocks By Performances & Trends: Daily, Weekly, Year-to-Date, Market Cap (Size) & Technical Trends | |||
| Best Latin America Views: Quick Browse View, Summary & Slide Show | |||
| 12Stocks.com Latin America Stocks Performances & Trends Daily | |||||||||
|
| 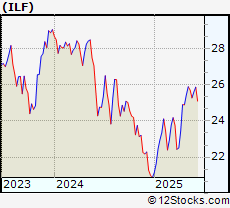 The overall market intelligence score is 40 (0-bearish to 100-bullish) which puts Latin America index in short term bearish to neutral trend. The market intelligence score from previous trading session is 50 and a deterioration of trend continues.
| ||||||||
Here are the market intelligence trend scores of the most requested Latin America stocks at 12Stocks.com (click stock name for detailed review):
| |||||||||||||||||||||||||
| Scroll down this page for most comprehensive review of Latin America stocks by performance, trends, technical analysis, charts, fund plays & more | |||||||||||||||||||||||||


| 12Stocks.com: Top Performing Latin America Index Stocks | ||||||||||||||||||||||||||||||||||||||||||||||||
 The top performing Latin America Index stocks year to date are
Now, more recently, over last week, the top performing Latin America Index stocks on the move are


|
||||||||||||||||||||||||||||||||||||||||||||||||
| 12Stocks.com: Investing in Latin America Index with Stocks | |
|
The following table helps investors and traders sort through current performance and trends (as measured by market intelligence score) of various
stocks in the Latin America Index. Quick View: Move mouse or cursor over stock symbol (ticker) to view short-term technical chart and over stock name to view long term chart. Click on  to add stock symbol to your watchlist and to add stock symbol to your watchlist and  to view watchlist. Click on any ticker or stock name for detailed market intelligence report for that stock. to view watchlist. Click on any ticker or stock name for detailed market intelligence report for that stock. |
12Stocks.com Performance of Stocks in Latin America Index
| Ticker | Stock Name | Watchlist | Category | Recent Price | Market Intelligence Score | Change % | YTD Change% |
| NGD | New Gold |   | Materials | 7.35 | 80 | 0.96 | 180.53% |
| TFII | TFI | | Industrials | 89.58 | 70 | 0.90 | -31.27% |
| RCI | Rogers | | Technology | 35.15 | 60 | 0.89 | 18.76% |
| DSGX | Descartes Systems | | Technology | 92.30 | 10 | 0.86 | -18.68% |
| CCJ | Cameco Corp | | Energy | 84.20 | 50 | 0.85 | 61.43% |
| GIL | Gildan Activewear | | Services & Goods | 59.80 | 100 | 0.83 | 29.13% |
| FMX | Fomento Economico | | Consumer Staples | 96.32 | 50 | 0.80 | 18.34% |
| IRS | Irsa Inversiones | | Financials | 11.66 | 0 | 0.78 | -26.76% |
| AAU | Almaden Minerals | | Materials | 89.11 | 80 | 0.77 | 0.00% |
| BNS | Bank Of | | Financials | 65.06 | 90 | 0.73 | 26.79% |
| TRP | TC Energy | | Energy | 54.28 | 100 | 0.72 | 17.50% |
| CPL | CPFL Energia | | Utilities | 157.44 | 100 | 0.70 | 0.00% |
| NVCN | Neovasc | | Health Care | 1.52 | 0 | 0.66 | 0.00% |
| SLW | Silver Wheaton | | Materials | 118.80 | 60 | 0.65 | 0.00% |
| TSG | Stars | | Services & Goods | 44.13 | 40 | 0.64 | 0.00% |
| B | Barrick Mining | | Materials | 33.92 | 50 | 0.62 | 114.73% |
| BTG | B2gold Corp | | Materials | 5.03 | 70 | 0.60 | 96.73% |
| STB | Student Transportation | | Services & Goods | 33.44 | 80 | 0.60 | 0.00% |
| TSU | TIM Participacoes | | Technology | 65.40 | 60 | 0.58 | 0.00% |
| GV | Visionary | | Consumer Staples | 2.12 | 90 | 0.47 | -7.83% |
| RIC | Richmont Mines | | Materials | 15.20 | 80 | 0.46 | 0.00% |
| SWIR | Sierra Wireless | | Technology | 62.28 | 70 | 0.44 | 0.00% |
| PPP | Primero Mining | | Materials | 10.64 | 0 | 0.38 | 0.00% |
| EQX | Equinox Gold | | Materials | 10.93 | 50 | 0.37 | 105.84% |
| VALE | Vale S.A. | | Materials | 11.02 | 70 | 0.36 | 28.95% |
| To view more stocks, click on Next / Previous arrows or select different range: 0 - 25 , 25 - 50 , 50 - 75 , 75 - 100 , 100 - 125 , 125 - 150 , 150 - 175 , 175 - 200 , 200 - 225 , 225 - 250 , 250 - 275 , 275 - 300 , 300 - 325 | ||
 | Click To Change The Sort Order: By Market Cap or Company Size Performance: Year-to-date, Week and Day |  |
| Detailed Overview Of Latin America Stocks |
| Latin America Technical Overview, Leaders & Laggards, Top Latin America ETF Funds & Detailed Latin America Stocks List, Charts, Trends & More |
| Latin America: Technical Analysis, Trends & YTD Performance | |
 ILF Weekly Chart |
|
| Long Term Trend: Very Good | |
| Medium Term Trend: Very Good | |
 ILF Daily Chart |
|
| Short Term Trend: Not Good | |
| Overall Trend Score: 40 | |
| YTD Performance: 37.1981% | |
| **Trend Scores & Views Are Only For Educational Purposes And Not For Investing | |
| 12Stocks.com: Investing in Latin America Index using Exchange Traded Funds | |
|
The following table shows list of key exchange traded funds (ETF) that
help investors play Latin America stock market. For detailed view, check out our ETF Funds section of our website. Quick View: Move mouse or cursor over ETF symbol (ticker) to view short-term technical chart and over ETF name to view long term chart. Click on ticker or stock name for detailed view. Click on to add stock symbol to your watchlist and to view watchlist. |
12Stocks.com List of ETFs that track Latin America Index
| Ticker | ETF Name | Watchlist | Recent Price | Market Intelligence Score | Change % | Week % | Year-to-date % |
| LBJ | Latin America Bull | | 60.40 | 50 | 0 | 0 | 0% |
| DBBR | Brazil Hedgd Eq | | 54.06 | 70 | -0.478645 | 0.632911 | 0% |
| FBZ | Brazil AlphaDEX | | 11.52 | 30 | 0 | 0 | 29.5955% |
| 12Stocks.com: Charts, Trends, Fundamental Data and Performances of Latin America Stocks | |
|
We now take in-depth look at all Latin America stocks including charts, multi-period performances and overall trends (as measured by market intelligence score). One can sort Latin America stocks (click link to choose) by Daily, Weekly and by Year-to-Date performances. Also, one can sort by size of the company or by market capitalization. |
| Select Your Default Chart Type: | |||||
| |||||
| Click on stock symbol or name for detailed view. Click on to add stock symbol to your watchlist and to view watchlist. Quick View: Move mouse or cursor over "Daily" to quickly view daily technical stock chart and over "Weekly" to view weekly technical stock chart. | |||||

 | NGD New Gold Inc |
| Sector: Materials | |
| SubSector: Gold | |
| MarketCap: 4987.71 Millions | |
| Recent Price: 7.35 Market Intelligence Score: 80 | |
| Day Percent Change: 0.961538% Day Change: -0.21 | |
| Week Change: 7.61347% Year-to-date Change: 180.5% | |
| NGD Links: Profile News Message Board | |
| Charts:- Daily , Weekly | |
| Add NGD to Watchlist: View: Get Complete NGD Trend Analysis ➞ | |
 | TFII TFI International Inc |
| Sector: Industrials | |
| SubSector: Trucking | |
| MarketCap: 8008.11 Millions | |
| Recent Price: 89.58 Market Intelligence Score: 70 | |
| Day Percent Change: 0.901104% Day Change: 0.65 | |
| Week Change: -1.4413% Year-to-date Change: -31.3% | |
| TFII Links: Profile News Message Board | |
| Charts:- Daily , Weekly | |
| Add TFII to Watchlist: View: Get Complete TFII Trend Analysis ➞ | |
 | RCI Rogers Communications Inc |
| Sector: Technology | |
| SubSector: Telecom Services | |
| MarketCap: 19388.8 Millions | |
| Recent Price: 35.15 Market Intelligence Score: 60 | |
| Day Percent Change: 0.889782% Day Change: -0.13 | |
| Week Change: 1.47229% Year-to-date Change: 18.8% | |
| RCI Links: Profile News Message Board | |
| Charts:- Daily , Weekly | |
| Add RCI to Watchlist: View: Get Complete RCI Trend Analysis ➞ | |
 | DSGX Descartes Systems Group Inc |
| Sector: Technology | |
| SubSector: Software - Application | |
| MarketCap: 9246.23 Millions | |
| Recent Price: 92.30 Market Intelligence Score: 10 | |
| Day Percent Change: 0.863294% Day Change: 0.67 | |
| Week Change: -5.87395% Year-to-date Change: -18.7% | |
| DSGX Links: Profile News Message Board | |
| Charts:- Daily , Weekly | |
| Add DSGX to Watchlist: View: Get Complete DSGX Trend Analysis ➞ | |
 | CCJ Cameco Corp |
| Sector: Energy | |
| SubSector: Uranium | |
| MarketCap: 33024.3 Millions | |
| Recent Price: 84.20 Market Intelligence Score: 50 | |
| Day Percent Change: 0.850401% Day Change: 0.1 | |
| Week Change: 1.3359% Year-to-date Change: 61.4% | |
| CCJ Links: Profile News Message Board | |
| Charts:- Daily , Weekly | |
| Add CCJ to Watchlist: View: Get Complete CCJ Trend Analysis ➞ | |
 | GIL Gildan Activewear Inc |
| Sector: Services & Goods | |
| SubSector: Apparel Manufacturing | |
| MarketCap: 8272.83 Millions | |
| Recent Price: 59.80 Market Intelligence Score: 100 | |
| Day Percent Change: 0.826168% Day Change: -0.54 | |
| Week Change: 5.22611% Year-to-date Change: 29.1% | |
| GIL Links: Profile News Message Board | |
| Charts:- Daily , Weekly | |
| Add GIL to Watchlist: View: Get Complete GIL Trend Analysis ➞ | |
 | FMX Fomento Economico Mexicano S.A.B. de C.V. ADR |
| Sector: Consumer Staples | |
| SubSector: Beverages - Brewers | |
| MarketCap: 17575.6 Millions | |
| Recent Price: 96.32 Market Intelligence Score: 50 | |
| Day Percent Change: 0.795312% Day Change: -0.63 | |
| Week Change: -1.53343% Year-to-date Change: 18.3% | |
| FMX Links: Profile News Message Board | |
| Charts:- Daily , Weekly | |
| Add FMX to Watchlist: View: Get Complete FMX Trend Analysis ➞ | |
 | IRS Irsa Inversiones Y Representaciones S.A. ADR |
| Sector: Financials | |
| SubSector: Real Estate Services | |
| MarketCap: 1092.66 Millions | |
| Recent Price: 11.66 Market Intelligence Score: 0 | |
| Day Percent Change: 0.777874% Day Change: 0.01 | |
| Week Change: -11.9335% Year-to-date Change: -26.8% | |
| IRS Links: Profile News Message Board | |
| Charts:- Daily , Weekly | |
| Add IRS to Watchlist: View: Get Complete IRS Trend Analysis ➞ | |
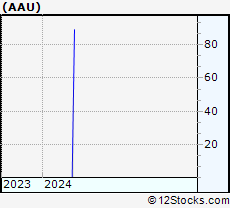 | AAU Almaden Minerals Ltd. |
| Sector: Materials | |
| SubSector: Gold | |
| MarketCap: 29.2619 Millions | |
| Recent Price: 89.11 Market Intelligence Score: 80 | |
| Day Percent Change: 0.76897% Day Change: -9999 | |
| Week Change: 61270.5% Year-to-date Change: 0.0% | |
| AAU Links: Profile News Message Board | |
| Charts:- Daily , Weekly | |
| Add AAU to Watchlist: View: Get Complete AAU Trend Analysis ➞ | |
 | BNS Bank Of Nova Scotia |
| Sector: Financials | |
| SubSector: Banks - Diversified | |
| MarketCap: 79019 Millions | |
| Recent Price: 65.06 Market Intelligence Score: 90 | |
| Day Percent Change: 0.727667% Day Change: -0.17 | |
| Week Change: 1.52934% Year-to-date Change: 26.8% | |
| BNS Links: Profile News Message Board | |
| Charts:- Daily , Weekly | |
| Add BNS to Watchlist: View: Get Complete BNS Trend Analysis ➞ | |
 | TRP TC Energy Corporation |
| Sector: Energy | |
| SubSector: Oil & Gas Midstream | |
| MarketCap: 53934.4 Millions | |
| Recent Price: 54.28 Market Intelligence Score: 100 | |
| Day Percent Change: 0.723696% Day Change: 0.21 | |
| Week Change: 1.36321% Year-to-date Change: 17.5% | |
| TRP Links: Profile News Message Board | |
| Charts:- Daily , Weekly | |
| Add TRP to Watchlist: View: Get Complete TRP Trend Analysis ➞ | |
 | CPL CPFL Energia S.A. |
| Sector: Utilities | |
| SubSector: Foreign Utilities | |
| MarketCap: 8241.06 Millions | |
| Recent Price: 157.44 Market Intelligence Score: 100 | |
| Day Percent Change: 0.697154% Day Change: -9999 | |
| Week Change: 52.5581% Year-to-date Change: 0.0% | |
| CPL Links: Profile News Message Board | |
| Charts:- Daily , Weekly | |
| Add CPL to Watchlist: View: Get Complete CPL Trend Analysis ➞ | |
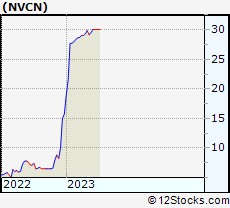 | NVCN Neovasc Inc. |
| Sector: Health Care | |
| SubSector: Medical Appliances & Equipment | |
| MarketCap: 19.208 Millions | |
| Recent Price: 1.52 Market Intelligence Score: 0 | |
| Day Percent Change: 0.662252% Day Change: -9999 | |
| Week Change: -94.9384% Year-to-date Change: 0.0% | |
| NVCN Links: Profile News Message Board | |
| Charts:- Daily , Weekly | |
| Add NVCN to Watchlist: View: Get Complete NVCN Trend Analysis ➞ | |
 | SLW Silver Wheaton Corp. |
| Sector: Materials | |
| SubSector: Silver | |
| MarketCap: 8631.34 Millions | |
| Recent Price: 118.80 Market Intelligence Score: 60 | |
| Day Percent Change: 0.652377% Day Change: -9999 | |
| Week Change: 84.186% Year-to-date Change: 0.0% | |
| SLW Links: Profile News Message Board | |
| Charts:- Daily , Weekly | |
| Add SLW to Watchlist: View: Get Complete SLW Trend Analysis ➞ | |
 | TSG The Stars Group Inc. |
| Sector: Services & Goods | |
| SubSector: Gaming Activities | |
| MarketCap: 4559.49 Millions | |
| Recent Price: 44.13 Market Intelligence Score: 40 | |
| Day Percent Change: 0.638541% Day Change: -9999 | |
| Week Change: -6.12636% Year-to-date Change: 0.0% | |
| TSG Links: Profile News Message Board | |
| Charts:- Daily , Weekly | |
| Add TSG to Watchlist: View: Get Complete TSG Trend Analysis ➞ | |
 | B Barrick Mining Corp |
| Sector: Materials | |
| SubSector: Gold | |
| MarketCap: 48467.2 Millions | |
| Recent Price: 33.92 Market Intelligence Score: 50 | |
| Day Percent Change: 0.622961% Day Change: -0.79 | |
| Week Change: 1.0426% Year-to-date Change: 114.7% | |
| B Links: Profile News Message Board | |
| Charts:- Daily , Weekly | |
| Add B to Watchlist: View: Get Complete B Trend Analysis ➞ | |
 | BTG B2gold Corp |
| Sector: Materials | |
| SubSector: Gold | |
| MarketCap: 5516.87 Millions | |
| Recent Price: 5.03 Market Intelligence Score: 70 | |
| Day Percent Change: 0.6% Day Change: -0.13 | |
| Week Change: 3.71134% Year-to-date Change: 96.7% | |
| BTG Links: Profile News Message Board | |
| Charts:- Daily , Weekly | |
| Add BTG to Watchlist: View: Get Complete BTG Trend Analysis ➞ | |
 | STB Student Transportation Inc. |
| Sector: Services & Goods | |
| SubSector: Consumer Services | |
| MarketCap: 507.67 Millions | |
| Recent Price: 33.44 Market Intelligence Score: 80 | |
| Day Percent Change: 0.601685% Day Change: -9999 | |
| Week Change: 8.64198% Year-to-date Change: 0.0% | |
| STB Links: Profile News Message Board | |
| Charts:- Daily , Weekly | |
| Add STB to Watchlist: View: Get Complete STB Trend Analysis ➞ | |
 | TSU TIM Participacoes S.A. |
| Sector: Technology | |
| SubSector: Wireless Communications | |
| MarketCap: 7768.97 Millions | |
| Recent Price: 65.40 Market Intelligence Score: 60 | |
| Day Percent Change: 0.584436% Day Change: -9999 | |
| Week Change: 2.10773% Year-to-date Change: 0.0% | |
| TSU Links: Profile News Message Board | |
| Charts:- Daily , Weekly | |
| Add TSU to Watchlist: View: Get Complete TSU Trend Analysis ➞ | |
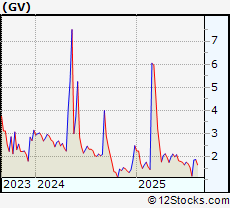 | GV Visionary Holdings Inc |
| Sector: Consumer Staples | |
| SubSector: Education & Training Services | |
| MarketCap: 6.62 Millions | |
| Recent Price: 2.12 Market Intelligence Score: 90 | |
| Day Percent Change: 0.473934% Day Change: -0.01 | |
| Week Change: -0.469484% Year-to-date Change: -7.8% | |
| GV Links: Profile News Message Board | |
| Charts:- Daily , Weekly | |
| Add GV to Watchlist: View: Get Complete GV Trend Analysis ➞ | |
 | RIC Richmont Mines Inc. |
| Sector: Materials | |
| SubSector: Gold | |
| MarketCap: 445.66 Millions | |
| Recent Price: 15.20 Market Intelligence Score: 80 | |
| Day Percent Change: 0.462657% Day Change: -9999 | |
| Week Change: -0.131406% Year-to-date Change: 0.0% | |
| RIC Links: Profile News Message Board | |
| Charts:- Daily , Weekly | |
| Add RIC to Watchlist: View: Get Complete RIC Trend Analysis ➞ | |
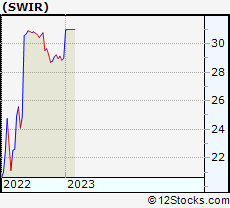 | SWIR Sierra Wireless, Inc. |
| Sector: Technology | |
| SubSector: Communication Equipment | |
| MarketCap: 212.639 Millions | |
| Recent Price: 62.28 Market Intelligence Score: 70 | |
| Day Percent Change: 0.435414% Day Change: -9999 | |
| Week Change: 100.968% Year-to-date Change: 0.0% | |
| SWIR Links: Profile News Message Board | |
| Charts:- Daily , Weekly | |
| Add SWIR to Watchlist: View: Get Complete SWIR Trend Analysis ➞ | |
 | PPP Primero Mining Corp. |
| Sector: Materials | |
| SubSector: Gold | |
| MarketCap: 114.12 Millions | |
| Recent Price: 10.64 Market Intelligence Score: 0 | |
| Day Percent Change: 0.377358% Day Change: -9999 | |
| Week Change: -23.2323% Year-to-date Change: 0.0% | |
| PPP Links: Profile News Message Board | |
| Charts:- Daily , Weekly | |
| Add PPP to Watchlist: View: Get Complete PPP Trend Analysis ➞ | |
 | EQX Equinox Gold Corp |
| Sector: Materials | |
| SubSector: Gold | |
| MarketCap: 7422.92 Millions | |
| Recent Price: 10.93 Market Intelligence Score: 50 | |
| Day Percent Change: 0.367309% Day Change: -0.24 | |
| Week Change: 4.19447% Year-to-date Change: 105.8% | |
| EQX Links: Profile News Message Board | |
| Charts:- Daily , Weekly | |
| Add EQX to Watchlist: View: Get Complete EQX Trend Analysis ➞ | |
 | VALE Vale S.A. ADR |
| Sector: Materials | |
| SubSector: Other Industrial Metals & Mining | |
| MarketCap: 44395.3 Millions | |
| Recent Price: 11.02 Market Intelligence Score: 70 | |
| Day Percent Change: 0.364299% Day Change: -0.08 | |
| Week Change: 1.75439% Year-to-date Change: 29.0% | |
| VALE Links: Profile News Message Board | |
| Charts:- Daily , Weekly | |
| Add VALE to Watchlist: View: Get Complete VALE Trend Analysis ➞ | |
| To view more stocks, click on Next / Previous arrows or select different range: 0 - 25 , 25 - 50 , 50 - 75 , 75 - 100 , 100 - 125 , 125 - 150 , 150 - 175 , 175 - 200 , 200 - 225 , 225 - 250 , 250 - 275 , 275 - 300 , 300 - 325 | ||
| Click To Change The Sort Order: By Market Cap or Company Size Performance: Year-to-date, Week and Day | |
| Select Chart Type: | ||
 Best Stocks Today 12Stocks.com |
© 2025 12Stocks.com Terms & Conditions Privacy Contact Us
All Information Provided Only For Education And Not To Be Used For Investing or Trading. See Terms & Conditions


One More Thing ... Get Best Stocks Delivered Daily!
Never Ever Miss A Move With Our Top Ten Stocks Lists
Find Best Stocks In Any Market - Bull or Bear Market
Take A Peek At Our Top Ten Stocks Lists: Daily, Weekly, Year-to-Date & Top Trends
Find Best Stocks In Any Market - Bull or Bear Market
Take A Peek At Our Top Ten Stocks Lists: Daily, Weekly, Year-to-Date & Top Trends
Latin America Stocks With Best Up Trends [0-bearish to 100-bullish]: Milestone [100], BRP [100], Turquoise Hill[100], Canada Goose[100], Canadian Solar[100], Nevsun Resources[100], Iamgold Corp[100], Bellatrix Exploration[100], Silvercorp Metals[100], Gerdau S.A.[100], Crescent Point[100]
Best Latin America Stocks Year-to-Date:
Americas Gold[892.308%], Avino Silver[437.523%], Tower[254.565%], Gold Royalty[206.452%], EMX Royalty[189.655%], New Gold[180.534%], Celestica [169.593%], Kinross Gold[153.727%], Iamgold Corp[138.172%], Lithium Americas[124.183%], Vasta Platform[119.556%] Best Latin America Stocks This Week:
Companhia Brasileira[18587.4%], Cosan [16415.2%], Crescent Point[4066.17%], Golden Star[1837.95%], Grupo Financiero[1283.52%], Alexco Resource[690.301%], Yamana Gold[625.812%], Novelion [579.167%], Turquoise Hill[433.11%], Enerplus [415.601%], Nevsun Resources[402.516%] Best Latin America Stocks Daily:
Novelion [7.37813%], Ambipar Emergency[6.89655%], Grupo Supervielle[6.39659%], Milestone [6.34146%], Nutrien [5.50945%], Grupo Financiero[4.91926%], Mitel Networks[4.5045%], BRP [4.30981%], Empresa Distribuidora[4.06396%], Pampa Energia[4.0515%], Loma Negra[3.92707%]