
 Login Sign Up


| |||||
 |  | ||||

| 12Stocks.com Market Intelligence |
Best Latin America Stocks
|
|
| Quick Read: Top Latin America Stocks By Performances & Trends: Daily, Weekly, Year-to-Date, Market Cap (Size) & Technical Trends | |||
| Best Latin America Views: Quick Browse View, Summary & Slide Show | |||
| 12Stocks.com Latin America Stocks Performances & Trends Daily | |||||||||
|
|  The overall market intelligence score is 100 (0-bearish to 100-bullish) which puts Latin America index in short term bullish trend. The market intelligence score from previous trading session is 90 and an improvement of trend continues.
| ||||||||
Here are the market intelligence trend scores of the most requested Latin America stocks at 12Stocks.com (click stock name for detailed review):
| |||||||||||||||||||||||||
| Scroll down this page for most comprehensive review of Latin America stocks by performance, trends, technical analysis, charts, fund plays & more | |||||||||||||||||||||||||


| 12Stocks.com: Top Performing Latin America Index Stocks | ||||||||||||||||||||||||||||||||||||||||||||||||
 The top performing Latin America Index stocks year to date are
Now, more recently, over last week, the top performing Latin America Index stocks on the move are


|
||||||||||||||||||||||||||||||||||||||||||||||||
| 12Stocks.com: Investing in Latin America Index with Stocks | |
|
The following table helps investors and traders sort through current performance and trends (as measured by market intelligence score) of various
stocks in the Latin America Index. Quick View: Move mouse or cursor over stock symbol (ticker) to view short-term technical chart and over stock name to view long term chart. Click on  to add stock symbol to your watchlist and to add stock symbol to your watchlist and  to view watchlist. Click on any ticker or stock name for detailed market intelligence report for that stock. to view watchlist. Click on any ticker or stock name for detailed market intelligence report for that stock. |
12Stocks.com Performance of Stocks in Latin America Index
| Ticker | Stock Name | Watchlist | Category | Recent Price | Market Intelligence Score | Change % | YTD Change% |
| AMBI | Ambipar Emergency |   | Industrials | 4.60 | 10 | 2.22% | -14.02% |
| CRESY | Cresud ADR | | Industrials | 8.64 | 10 | 1.41% | -35.43% |
| SRSC | Sears Canada | | Services & Goods | 1.02 | 10 | 0.99% | 0.00% |
| TGS | Transportadora de | | Energy | 21.18 | 10 | 0.43% | -34.63% |
| PWE | Penn West | | Energy | 1.26 | 10 | 0.00% | 0.00% |
| DDMX | DD3 Acquisition | | Transports | 9.42 | 10 | 0.00% | 0.00% |
| WILN | Wi-Lan | | Technology | 14.15 | 10 | -0.07% | 0.00% |
| TEO | Telecom Argentina | | Technology | 7.11 | 10 | -0.14% | -48.48% |
| AQN | Algonquin Power | | Utilities | 5.59 | 10 | -0.18% | 26.12% |
| GIB | CGI | | Technology | 93.08 | 10 | -0.26% | -14.59% |
| WCN | Waste Connections | | Industrials | 175.57 | 10 | -0.28% | 3.86% |
| AGU | Agrium | | Materials | 16.91 | 10 | -0.35% | 0.00% |
| PAM | Pampa Energia | | Utilities | 59.23 | 10 | -0.42% | -36.35% |
| LOMA | Loma Negra | | Materials | 7.54 | 10 | -0.92% | -39.97% |
| BAA | Banro | | Materials | 0.85 | 10 | -1.16% | 0.00% |
| CEPU | Central Puerto | | Utilities | 8.40 | 10 | -1.87% | -46.43% |
| EDN | Empresa Distribuidora | | Utilities | 16.70 | 10 | -2.00% | -64.47% |
| GGAL | Grupo Financiero | | Financials | 29.18 | 10 | -2.57% | -57.26% |
| GOL | Gol Linhas | | Transports | 1.08 | 10 | -2.70% | 0.00% |
| BBAR | BBVA Argentina | | Financials | 8.76 | 10 | -2.77% | -59.76% |
| NTCO | Natura &Co | | Consumer Staples | 6.55 | 10 | -2.96% | 0.00% |
| SUPV | Grupo Supervielle | | Financials | 5.36 | 10 | -3.07% | -67.43% |
| BMA | Banco Macro | | Financials | 42.45 | 10 | -3.08% | -60.88% |
| CPAH | CounterPath | | Technology | 0.90 | 10 | -3.23% | 0.00% |
| APHA | Aphria | | Health Care | 17.23 | 10 | -3.39% | 0.00% |
| To view more stocks, click on Next / Previous arrows or select different range: 0 - 25 , 25 - 50 , 50 - 75 , 75 - 100 , 100 - 125 , 125 - 150 , 150 - 175 , 175 - 200 , 200 - 225 , 225 - 250 , 250 - 275 , 275 - 300 , 300 - 325 | ||
 | Click To Change The Sort Order: By Market Cap or Company Size Performance: Year-to-date, Week and Day |  |
| Detailed Overview Of Latin America Stocks |
| Latin America Technical Overview, Leaders & Laggards, Top Latin America ETF Funds & Detailed Latin America Stocks List, Charts, Trends & More |
| Latin America: Technical Analysis, Trends & YTD Performance | |
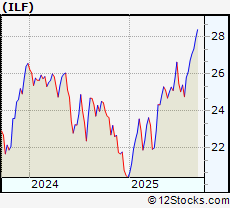
 ILF Weekly Chart |
|
| Long Term Trend: Very Good | |
| Medium Term Trend: Very Good | |
 ILF Daily Chart |
|
| Short Term Trend: Very Good | |
| Overall Trend Score: 100 | |
| YTD Performance: 37.6342% | |
| **Trend Scores & Views Are Only For Educational Purposes And Not For Investing | |
| 12Stocks.com: Investing in Latin America Index using Exchange Traded Funds | |
|
The following table shows list of key exchange traded funds (ETF) that
help investors play Latin America stock market. For detailed view, check out our ETF Funds section of our website. Quick View: Move mouse or cursor over ETF symbol (ticker) to view short-term technical chart and over ETF name to view long term chart. Click on ticker or stock name for detailed view. Click on to add stock symbol to your watchlist and to view watchlist. |
12Stocks.com List of ETFs that track Latin America Index
| Ticker | ETF Name | Watchlist | Recent Price | Market Intelligence Score | Change % | Week % | Year-to-date % |
| LBJ | Latin America Bull | | 60.40 | 50 | 0 | 0 | 0% |
| DBBR | Brazil Hedgd Eq | | 54.06 | 70 | -0.478645 | 0.632911 | 0% |
| FBZ | Brazil AlphaDEX | | 11.52 | 30 | 0 | 0 | 29.5955% |
| 12Stocks.com: Charts, Trends, Fundamental Data and Performances of Latin America Stocks | |
|
We now take in-depth look at all Latin America stocks including charts, multi-period performances and overall trends (as measured by market intelligence score). One can sort Latin America stocks (click link to choose) by Daily, Weekly and by Year-to-Date performances. Also, one can sort by size of the company or by market capitalization. |
| Select Your Default Chart Type: | |||||
| |||||
| Click on stock symbol or name for detailed view. Click on to add stock symbol to your watchlist and to view watchlist. Quick View: Move mouse or cursor over "Daily" to quickly view daily technical stock chart and over "Weekly" to view weekly technical stock chart. | |||||

 | GFA Gafisa S.A. |
| Sector: Industrials | |
| SubSector: Residential Construction | |
| MarketCap: 304.96 Millions | |
| Recent Price: 11.29 Market Intelligence Score: 10 | |
| Day Percent Change: 2.26449% Day Change: -9999 | |
| Week Change: -43.8588% Year-to-date Change: 0.0% | |
| GFA Links: Profile News Message Board | |
| Charts:- Daily , Weekly | |
| Add GFA to Watchlist: View: Get Complete GFA Trend Analysis ➞ | |
 | AMBI Ambipar Emergency Response |
| Sector: Industrials | |
| SubSector: Waste Management | |
| MarketCap: 251.65 Millions | |
| Recent Price: 4.60 Market Intelligence Score: 10 | |
| Day Percent Change: 2.22222% Day Change: -0.07 | |
| Week Change: 1.32159% Year-to-date Change: -14.0% | |
| AMBI Links: Profile News Message Board | |
| Charts:- Daily , Weekly | |
| Add AMBI to Watchlist: View: Get Complete AMBI Trend Analysis ➞ | |
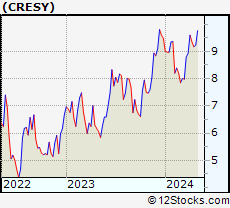 | CRESY Cresud ADR |
| Sector: Industrials | |
| SubSector: Conglomerates | |
| MarketCap: 595.06 Millions | |
| Recent Price: 8.64 Market Intelligence Score: 10 | |
| Day Percent Change: 1.40845% Day Change: 0.16 | |
| Week Change: -10.8359% Year-to-date Change: -35.4% | |
| CRESY Links: Profile News Message Board | |
| Charts:- Daily , Weekly | |
| Add CRESY to Watchlist: View: Get Complete CRESY Trend Analysis ➞ | |
 | SRSC Sears Canada Inc. |
| Sector: Services & Goods | |
| SubSector: Department Stores | |
| MarketCap: 132.44 Millions | |
| Recent Price: 1.02 Market Intelligence Score: 10 | |
| Day Percent Change: 0.990099% Day Change: -9999 | |
| Week Change: -87.218% Year-to-date Change: 0.0% | |
| SRSC Links: Profile News Message Board | |
| Charts:- Daily , Weekly | |
| Add SRSC to Watchlist: View: Get Complete SRSC Trend Analysis ➞ | |
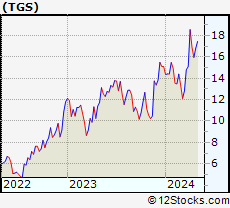 | TGS Transportadora de Gas del Sur ADR |
| Sector: Energy | |
| SubSector: Oil & Gas Integrated | |
| MarketCap: 1837.84 Millions | |
| Recent Price: 21.18 Market Intelligence Score: 10 | |
| Day Percent Change: 0.426743% Day Change: 0.89 | |
| Week Change: -19.8941% Year-to-date Change: -34.6% | |
| TGS Links: Profile News Message Board | |
| Charts:- Daily , Weekly | |
| Add TGS to Watchlist: View: Get Complete TGS Trend Analysis ➞ | |
 | PWE Penn West Petroleum Ltd. |
| Sector: Energy | |
| SubSector: Oil & Gas Drilling & Exploration | |
| MarketCap: 818.85 Millions | |
| Recent Price: 1.26 Market Intelligence Score: 10 | |
| Day Percent Change: 0% Day Change: -9999 | |
| Week Change: 0% Year-to-date Change: 0.0% | |
| PWE Links: Profile News Message Board | |
| Charts:- Daily , Weekly | |
| Add PWE to Watchlist: View: Get Complete PWE Trend Analysis ➞ | |
 | DDMX DD3 Acquisition Corp. |
| Sector: Transports | |
| SubSector: Trucking | |
| MarketCap: 65.7915 Millions | |
| Recent Price: 9.42 Market Intelligence Score: 10 | |
| Day Percent Change: 0% Day Change: -9999 | |
| Week Change: -4.84848% Year-to-date Change: 0.0% | |
| DDMX Links: Profile News Message Board | |
| Charts:- Daily , Weekly | |
| Add DDMX to Watchlist: View: Get Complete DDMX Trend Analysis ➞ | |
 | WILN Wi-Lan Inc. |
| Sector: Technology | |
| SubSector: Wireless Communications | |
| MarketCap: 211.06 Millions | |
| Recent Price: 14.15 Market Intelligence Score: 10 | |
| Day Percent Change: -0.0706215% Day Change: -9999 | |
| Week Change: -18.5377% Year-to-date Change: 0.0% | |
| WILN Links: Profile News Message Board | |
| Charts:- Daily , Weekly | |
| Add WILN to Watchlist: View: Get Complete WILN Trend Analysis ➞ | |
 | TEO Telecom Argentina S.A. ADR |
| Sector: Technology | |
| SubSector: Telecom Services | |
| MarketCap: 1070.2 Millions | |
| Recent Price: 7.11 Market Intelligence Score: 10 | |
| Day Percent Change: -0.140449% Day Change: 0.23 | |
| Week Change: -16.5493% Year-to-date Change: -48.5% | |
| TEO Links: Profile News Message Board | |
| Charts:- Daily , Weekly | |
| Add TEO to Watchlist: View: Get Complete TEO Trend Analysis ➞ | |
 | AQN Algonquin Power & Utilities Corp |
| Sector: Utilities | |
| SubSector: Utilities - Diversified | |
| MarketCap: 4485.08 Millions | |
| Recent Price: 5.59 Market Intelligence Score: 10 | |
| Day Percent Change: -0.178571% Day Change: -0.02 | |
| Week Change: -1.41093% Year-to-date Change: 26.1% | |
| AQN Links: Profile News Message Board | |
| Charts:- Daily , Weekly | |
| Add AQN to Watchlist: View: Get Complete AQN Trend Analysis ➞ | |
 | GIB CGI Inc |
| Sector: Technology | |
| SubSector: Information Technology Services | |
| MarketCap: 21345.4 Millions | |
| Recent Price: 93.08 Market Intelligence Score: 10 | |
| Day Percent Change: -0.25718% Day Change: 0.06 | |
| Week Change: -3.77339% Year-to-date Change: -14.6% | |
| GIB Links: Profile News Message Board | |
| Charts:- Daily , Weekly | |
| Add GIB to Watchlist: View: Get Complete GIB Trend Analysis ➞ | |
 | WCN Waste Connections Inc |
| Sector: Industrials | |
| SubSector: Waste Management | |
| MarketCap: 46164.4 Millions | |
| Recent Price: 175.57 Market Intelligence Score: 10 | |
| Day Percent Change: -0.283978% Day Change: 0.68 | |
| Week Change: -2.08031% Year-to-date Change: 3.9% | |
| WCN Links: Profile News Message Board | |
| Charts:- Daily , Weekly | |
| Add WCN to Watchlist: View: Get Complete WCN Trend Analysis ➞ | |
 | AGU Agrium Inc. |
| Sector: Materials | |
| SubSector: Agricultural Chemicals | |
| MarketCap: 13316.7 Millions | |
| Recent Price: 16.91 Market Intelligence Score: 10 | |
| Day Percent Change: -0.353565% Day Change: -9999 | |
| Week Change: -37.808% Year-to-date Change: 0.0% | |
| AGU Links: Profile News Message Board | |
| Charts:- Daily , Weekly | |
| Add AGU to Watchlist: View: Get Complete AGU Trend Analysis ➞ | |
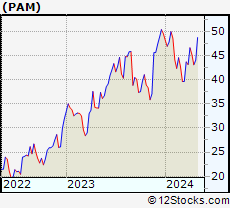 | PAM Pampa Energia SA ADR |
| Sector: Utilities | |
| SubSector: Utilities - Independent Power Producers | |
| MarketCap: 3696.89 Millions | |
| Recent Price: 59.23 Market Intelligence Score: 10 | |
| Day Percent Change: -0.420309% Day Change: 0.26 | |
| Week Change: -12.8586% Year-to-date Change: -36.4% | |
| PAM Links: Profile News Message Board | |
| Charts:- Daily , Weekly | |
| Add PAM to Watchlist: View: Get Complete PAM Trend Analysis ➞ | |
 | LOMA Loma Negra Compania Industrial Argentina Sociedad Anonima ADR |
| Sector: Materials | |
| SubSector: Building Materials | |
| MarketCap: 1072.8 Millions | |
| Recent Price: 7.54 Market Intelligence Score: 10 | |
| Day Percent Change: -0.919842% Day Change: 0.12 | |
| Week Change: -16.2222% Year-to-date Change: -40.0% | |
| LOMA Links: Profile News Message Board | |
| Charts:- Daily , Weekly | |
| Add LOMA to Watchlist: View: Get Complete LOMA Trend Analysis ➞ | |
 | BAA Banro Corporation |
| Sector: Materials | |
| SubSector: Gold | |
| MarketCap: 36.42 Millions | |
| Recent Price: 0.85 Market Intelligence Score: 10 | |
| Day Percent Change: -1.16279% Day Change: -9999 | |
| Week Change: -95.819% Year-to-date Change: 0.0% | |
| BAA Links: Profile News Message Board | |
| Charts:- Daily , Weekly | |
| Add BAA to Watchlist: View: Get Complete BAA Trend Analysis ➞ | |
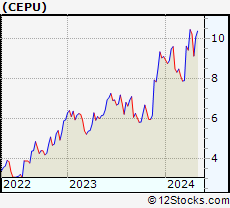 | CEPU Central Puerto ADR |
| Sector: Utilities | |
| SubSector: Utilities - Regulated Electric | |
| MarketCap: 1533.68 Millions | |
| Recent Price: 8.40 Market Intelligence Score: 10 | |
| Day Percent Change: -1.86916% Day Change: 0.12 | |
| Week Change: -17.078% Year-to-date Change: -46.4% | |
| CEPU Links: Profile News Message Board | |
| Charts:- Daily , Weekly | |
| Add CEPU to Watchlist: View: Get Complete CEPU Trend Analysis ➞ | |
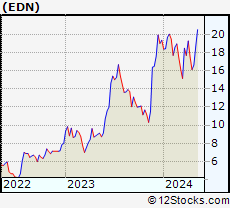 | EDN Empresa Distribuidora y Comercial Norte S.A. ADR |
| Sector: Utilities | |
| SubSector: Utilities - Regulated Electric | |
| MarketCap: 483.1 Millions | |
| Recent Price: 16.70 Market Intelligence Score: 10 | |
| Day Percent Change: -1.99531% Day Change: -0.13 | |
| Week Change: -23.5698% Year-to-date Change: -64.5% | |
| EDN Links: Profile News Message Board | |
| Charts:- Daily , Weekly | |
| Add EDN to Watchlist: View: Get Complete EDN Trend Analysis ➞ | |
 | GGAL Grupo Financiero Galicia ADR |
| Sector: Financials | |
| SubSector: Banks - Regional | |
| MarketCap: 5313.25 Millions | |
| Recent Price: 29.18 Market Intelligence Score: 10 | |
| Day Percent Change: -2.57095% Day Change: -0.16 | |
| Week Change: -27.2319% Year-to-date Change: -57.3% | |
| GGAL Links: Profile News Message Board | |
| Charts:- Daily , Weekly | |
| Add GGAL to Watchlist: View: Get Complete GGAL Trend Analysis ➞ | |
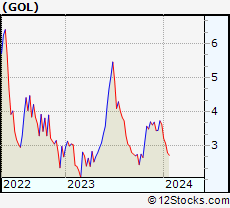 | GOL Gol Linhas Aereas Inteligentes S.A. |
| Sector: Transports | |
| SubSector: Regional Airlines | |
| MarketCap: 5717.7 Millions | |
| Recent Price: 1.08 Market Intelligence Score: 10 | |
| Day Percent Change: -2.7027% Day Change: -9999 | |
| Week Change: -60.221% Year-to-date Change: 0.0% | |
| GOL Links: Profile News Message Board | |
| Charts:- Daily , Weekly | |
| Add GOL to Watchlist: View: Get Complete GOL Trend Analysis ➞ | |
 | BBAR BBVA Argentina ADR |
| Sector: Financials | |
| SubSector: Banks - Regional | |
| MarketCap: 2518.28 Millions | |
| Recent Price: 8.76 Market Intelligence Score: 10 | |
| Day Percent Change: -2.77469% Day Change: -0.79 | |
| Week Change: -29.0688% Year-to-date Change: -59.8% | |
| BBAR Links: Profile News Message Board | |
| Charts:- Daily , Weekly | |
| Add BBAR to Watchlist: View: Get Complete BBAR Trend Analysis ➞ | |
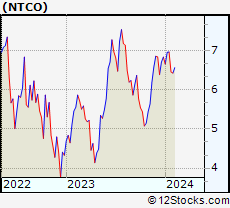 | NTCO Natura &Co Holding S.A. |
| Sector: Consumer Staples | |
| SubSector: Household & Personal Products | |
| MarketCap: 13047 Millions | |
| Recent Price: 6.55 Market Intelligence Score: 10 | |
| Day Percent Change: -2.96296% Day Change: -9999 | |
| Week Change: -8.50677% Year-to-date Change: 0.0% | |
| NTCO Links: Profile News Message Board | |
| Charts:- Daily , Weekly | |
| Add NTCO to Watchlist: View: Get Complete NTCO Trend Analysis ➞ | |
 | SUPV Grupo Supervielle S.A. ADR |
| Sector: Financials | |
| SubSector: Banks - Regional | |
| MarketCap: 632.79 Millions | |
| Recent Price: 5.36 Market Intelligence Score: 10 | |
| Day Percent Change: -3.07414% Day Change: -0.1 | |
| Week Change: -33.0836% Year-to-date Change: -67.4% | |
| SUPV Links: Profile News Message Board | |
| Charts:- Daily , Weekly | |
| Add SUPV to Watchlist: View: Get Complete SUPV Trend Analysis ➞ | |
 | BMA Banco Macro S.A. ADR |
| Sector: Financials | |
| SubSector: Banks - Regional | |
| MarketCap: 3700.73 Millions | |
| Recent Price: 42.45 Market Intelligence Score: 10 | |
| Day Percent Change: -3.08219% Day Change: -0.23 | |
| Week Change: -27.9409% Year-to-date Change: -60.9% | |
| BMA Links: Profile News Message Board | |
| Charts:- Daily , Weekly | |
| Add BMA to Watchlist: View: Get Complete BMA Trend Analysis ➞ | |
 | CPAH CounterPath Corporation |
| Sector: Technology | |
| SubSector: Application Software | |
| MarketCap: 12.7662 Millions | |
| Recent Price: 0.90 Market Intelligence Score: 10 | |
| Day Percent Change: -3.22581% Day Change: -9999 | |
| Week Change: -74.1379% Year-to-date Change: 0.0% | |
| CPAH Links: Profile News Message Board | |
| Charts:- Daily , Weekly | |
| Add CPAH to Watchlist: View: Get Complete CPAH Trend Analysis ➞ | |
| To view more stocks, click on Next / Previous arrows or select different range: 0 - 25 , 25 - 50 , 50 - 75 , 75 - 100 , 100 - 125 , 125 - 150 , 150 - 175 , 175 - 200 , 200 - 225 , 225 - 250 , 250 - 275 , 275 - 300 , 300 - 325 | ||
| Click To Change The Sort Order: By Market Cap or Company Size Performance: Year-to-date, Week and Day | |
| Select Chart Type: | ||
 Best Stocks Today 12Stocks.com |
© 2025 12Stocks.com Terms & Conditions Privacy Contact Us
All Information Provided Only For Education And Not To Be Used For Investing or Trading. See Terms & Conditions


One More Thing ... Get Best Stocks Delivered Daily!
Never Ever Miss A Move With Our Top Ten Stocks Lists
Find Best Stocks In Any Market - Bull or Bear Market
Take A Peek At Our Top Ten Stocks Lists: Daily, Weekly, Year-to-Date & Top Trends
Find Best Stocks In Any Market - Bull or Bear Market
Take A Peek At Our Top Ten Stocks Lists: Daily, Weekly, Year-to-Date & Top Trends
Latin America Stocks With Best Up Trends [0-bearish to 100-bullish]: Lithium Americas[100], NexGen Energy[100], Cameco Corp[100], Denison Mines[100], Seabridge Gold[100], Vasta Platform[100], Platinum [100], Endeavour Silver[100], Open Text[100], Avino Silver[100], Ballard Power[100]
Best Latin America Stocks Year-to-Date:
Americas Gold[660.256%], Avino Silver[375.501%], Tower[241.826%], Gold Royalty[202.419%], Celestica [167.53%], New Gold[157.252%], EMX Royalty[141.379%], Kinross Gold[136.541%], Vasta Platform[115.556%], Sandstorm Gold[114.01%], Iamgold Corp[104.48%] Best Latin America Stocks This Week:
Companhia Brasileira[18587.4%], Cosan [16415.2%], Crescent Point[4066.17%], Golden Star[1837.95%], Grupo Financiero[1283.52%], Alexco Resource[690.301%], Yamana Gold[625.812%], Novelion [579.167%], Turquoise Hill[433.11%], Enerplus [415.601%], Nevsun Resources[402.516%] Best Latin America Stocks Daily:
Grupo Simec[12.2572%], Lithium Americas[11.8881%], NexGen Energy[10.616%], Cameco Corp[10.5108%], Canadian Solar[10.2847%], Denison Mines[8.86076%], Seabridge Gold[7.70048%], Novelion [7.37813%], Vasta Platform[7.06402%], Northern Dynasty[6.26756%], Platinum [6.01093%]