
 Login Sign Up


| |||||
 |  | ||||

| 12Stocks.com Market Intelligence |
Best Latin America Stocks
|
|
| Quick Read: Top Latin America Stocks By Performances & Trends: Daily, Weekly, Year-to-Date, Market Cap (Size) & Technical Trends | |||
| Best Latin America Views: Quick Browse View, Summary & Slide Show | |||
| 12Stocks.com Latin America Stocks Performances & Trends Daily | |||||||||
|
|  The overall market intelligence score is 32 (0-bearish to 100-bullish) which puts Latin America index in short term bearish to neutral trend. The market intelligence score from previous trading session is 0 and hence an improvement of trend.
| ||||||||
| Here are the market intelligence trend scores of the most requested Latin America stocks at 12Stocks.com (click stock name for detailed review): | |
| Scroll down this page for most comprehensive review of Latin America stocks by performance, trends, technical analysis, charts, fund plays & more | |


| 12Stocks.com: Top Performing Latin America Index Stocks | ||||||||||||||||||||||||||||||||||||||||||||||||
 The top performing Latin America Index stocks year to date are
Now, more recently, over last week, the top performing Latin America Index stocks on the move are


|
||||||||||||||||||||||||||||||||||||||||||||||||
| 12Stocks.com: Investing in Latin America Index with Stocks | |
|
The following table helps investors and traders sort through current performance and trends (as measured by market intelligence score) of various
stocks in the Latin America Index. Quick View: Move mouse or cursor over stock symbol (ticker) to view short-term technical chart and over stock name to view long term chart. Click on  to add stock symbol to your watchlist and to add stock symbol to your watchlist and  to view watchlist. Click on any ticker or stock name for detailed market intelligence report for that stock. to view watchlist. Click on any ticker or stock name for detailed market intelligence report for that stock. |
12Stocks.com Performance of Stocks in Latin America Index
| Ticker | Stock Name | Watchlist | Category | Recent Price | Market Intelligence Score | Change % | YTD Change% |
| VOXR | Vox Royalty |   | Materials | 2.01 | 46 | -0.25% | -2.43% |
| PDS | Precision Drilling | | Energy | 66.82 | 44 | -0.85% | 23.08% |
| CNQ | Canadian Natural | | Energy | 76.55 | 44 | -0.36% | 16.83% |
| SID | Companhia Siderurgica | | Materials | 2.82 | 42 | 3.68% | -28.24% |
| ELP | Companhia Paranaense | | Utilities | 7.31 | 42 | 3.25% | -13.80% |
| ENB | Enbridge | | Energy | 34.86 | 42 | 2.83% | -3.22% |
| TD | Toronto-Dominion Bank | | Financials | 58.09 | 42 | 1.47% | -10.11% |
| LULU | Lululemon Athletica | | Consumer Staples | 352.47 | 42 | 1.43% | -31.06% |
| ARCO | Arcos Dorados | | Services & Goods | 10.90 | 42 | 1.30% | -14.11% |
| BMO | Bank of Montreal | | Financials | 92.14 | 42 | 1.24% | -6.87% |
| BCE | BCE | | Technology | 32.59 | 42 | 1.18% | -17.24% |
| LVRO | Lavoro | | Materials | 5.88 | 42 | 0.60% | -33.78% |
| ACHV | Achieve Life | | Health Care | 4.55 | 42 | -0.33% | 8.08% |
| BHC | Bausch Health | | Health Care | 8.69 | 41 | 1.05% | 8.35% |
| GIL | Gildan Activewear | | Consumer Staples | 35.20 | 41 | 0.23% | 6.47% |
| MOGO | Mogo | | Financials | 1.84 | 41 | 0.00% | -0.54% |
| ERJ | Embraer S.A | | Industrials | 23.79 | 41 | -1.78% | 28.94% |
| CRON | Cronos | | Health Care | 2.37 | 41 | -1.66% | 13.40% |
| PAM | Pampa Energia | | Utilities | 43.08 | 40 | 2.84% | -13.00% |
| CINT | CI&T | | Technology | 4.04 | 40 | -1.34% | -24.13% |
| SBS | Companhia de | | Utilities | 15.49 | 38 | -1.59% | 1.71% |
| BNS | Bank of Nova Scotia | | Financials | 46.74 | 37 | 0.37% | -4.00% |
| SIM | Grupo Simec | | Materials | 31.00 | 37 | 0.00% | -0.55% |
| APT | Alpha Pro | | Industrials | 6.16 | 36 | 2.67% | 16.45% |
| LAC | Lithium Americas | | Materials | 4.73 | 36 | 1.50% | -26.09% |
| To view more stocks, click on Next / Previous arrows or select different range: 0 - 25 , 25 - 50 , 50 - 75 , 75 - 100 , 100 - 125 , 125 - 150 , 150 - 175 , 175 - 200 , 200 - 225 | ||
 | Click To Change The Sort Order: By Market Cap or Company Size Performance: Year-to-date, Week and Day |  |
| Detailed Overview Of Latin America Stocks |
| Latin America Technical Overview, Leaders & Laggards, Top Latin America ETF Funds & Detailed Latin America Stocks List, Charts, Trends & More |
| Latin America: Technical Analysis, Trends & YTD Performance | |
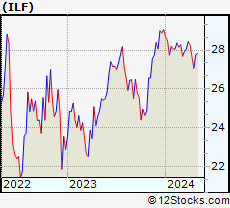
 ILF Weekly Chart |
|
| Long Term Trend: Not Good | |
| Medium Term Trend: Not Good | |
 ILF Daily Chart |
|
| Short Term Trend: Very Good | |
| Overall Trend Score: 32 | |
| YTD Performance: -6.85% | |
| **Trend Scores & Views Are Only For Educational Purposes And Not For Investing | |
| 12Stocks.com: Investing in Latin America Index using Exchange Traded Funds | |
|
The following table shows list of key exchange traded funds (ETF) that
help investors play Latin America stock market. For detailed view, check out our ETF Funds section of our website. Quick View: Move mouse or cursor over ETF symbol (ticker) to view short-term technical chart and over ETF name to view long term chart. Click on ticker or stock name for detailed view. Click on to add stock symbol to your watchlist and to view watchlist. |
12Stocks.com List of ETFs that track Latin America Index
| Ticker | ETF Name | Watchlist | Recent Price | Market Intelligence Score | Change % | Week % | Year-to-date % |
| ILF | Latin America 40 | | 27.07 | 32 | 1.20 | -2.1 | -6.85% |
| EWC | Canada | | 37.11 | 68 | 0.71 | -0.11 | 1.17% |
| FLN | Latin America AlphaDEX | | 19.22 | 10 | 0.68 | -5.78 | -7.55% |
| EWZ | Brazil | | 30.74 | 32 | 2.09 | -1.69 | -12.07% |
| EWW | Mexico | | 64.89 | 18 | -0.05 | -3.75 | -4.36% |
| ARGT | Argentina | | 53.47 | 43 | 1.06 | -3.88 | 4.15% |
| EWZS | Brazil Small-Cap | | 13.00 | 17 | 1.56 | -4.02 | -13.68% |
| BRF | Brazil Small-Cap | | 14.86 | 17 | 1.57 | -4.53 | -15.51% |
| BZQ | Short Brazil | | 12.77 | 73 | -3.70 | 3.74 | 27.32% |
| BRZU | Brazil Bull 3X | | 76.80 | 32 | 4.18 | -3.72 | -25.35% |
| FBZ | Brazil AlphaDEX | | 11.24 | 17 | 1.94 | -5.15 | -8.03% |
| 12Stocks.com: Charts, Trends, Fundamental Data and Performances of Latin America Stocks | |
|
We now take in-depth look at all Latin America stocks including charts, multi-period performances and overall trends (as measured by market intelligence score). One can sort Latin America stocks (click link to choose) by Daily, Weekly and by Year-to-Date performances. Also, one can sort by size of the company or by market capitalization. |
| Select Your Default Chart Type: | |||||
| |||||
| Click on stock symbol or name for detailed view. Click on to add stock symbol to your watchlist and to view watchlist. Quick View: Move mouse or cursor over "Daily" to quickly view daily technical stock chart and over "Weekly" to view weekly technical stock chart. | |||||

 | VOXR Vox Royalty Corp. |
| Sector: Materials | |
| SubSector: Other Precious Metals & Mining | |
| MarketCap: 154 Millions | |
| Recent Price: 2.01 Market Intelligence Score: 46 | |
| Day Percent Change: -0.25% Day Change: -0.01 | |
| Week Change: -2.9% Year-to-date Change: -2.4% | |
| VOXR Links: Profile News Message Board | |
| Charts:- Daily , Weekly | |
| Add VOXR to Watchlist: View: Get Complete VOXR Trend Analysis ➞ | |
 | PDS Precision Drilling Corporation |
| Sector: Energy | |
| SubSector: Oil & Gas Equipment & Services | |
| MarketCap: 103.461 Millions | |
| Recent Price: 66.82 Market Intelligence Score: 44 | |
| Day Percent Change: -0.85% Day Change: -0.57 | |
| Week Change: -8.63% Year-to-date Change: 23.1% | |
| PDS Links: Profile News Message Board | |
| Charts:- Daily , Weekly | |
| Add PDS to Watchlist: View: Get Complete PDS Trend Analysis ➞ | |
 | CNQ Canadian Natural Resources Limited |
| Sector: Energy | |
| SubSector: Independent Oil & Gas | |
| MarketCap: 11925.2 Millions | |
| Recent Price: 76.55 Market Intelligence Score: 44 | |
| Day Percent Change: -0.36% Day Change: -0.28 | |
| Week Change: -3.38% Year-to-date Change: 16.8% | |
| CNQ Links: Profile News Message Board | |
| Charts:- Daily , Weekly | |
| Add CNQ to Watchlist: View: Get Complete CNQ Trend Analysis ➞ | |
 | SID Companhia Siderurgica Nacional |
| Sector: Materials | |
| SubSector: Steel & Iron | |
| MarketCap: 2087.58 Millions | |
| Recent Price: 2.82 Market Intelligence Score: 42 | |
| Day Percent Change: 3.68% Day Change: 0.10 | |
| Week Change: 0.36% Year-to-date Change: -28.2% | |
| SID Links: Profile News Message Board | |
| Charts:- Daily , Weekly | |
| Add SID to Watchlist: View: Get Complete SID Trend Analysis ➞ | |
 | ELP Companhia Paranaense de Energia - COPEL |
| Sector: Utilities | |
| SubSector: Electric Utilities | |
| MarketCap: 3352.84 Millions | |
| Recent Price: 7.31 Market Intelligence Score: 42 | |
| Day Percent Change: 3.25% Day Change: 0.23 | |
| Week Change: 0.97% Year-to-date Change: -13.8% | |
| ELP Links: Profile News Message Board | |
| Charts:- Daily , Weekly | |
| Add ELP to Watchlist: View: Get Complete ELP Trend Analysis ➞ | |
 | ENB Enbridge Inc. |
| Sector: Energy | |
| SubSector: Oil & Gas Pipelines | |
| MarketCap: 62578.4 Millions | |
| Recent Price: 34.86 Market Intelligence Score: 42 | |
| Day Percent Change: 2.83% Day Change: 0.96 | |
| Week Change: 1.99% Year-to-date Change: -3.2% | |
| ENB Links: Profile News Message Board | |
| Charts:- Daily , Weekly | |
| Add ENB to Watchlist: View: Get Complete ENB Trend Analysis ➞ | |
 | TD The Toronto-Dominion Bank |
| Sector: Financials | |
| SubSector: Money Center Banks | |
| MarketCap: 75152.4 Millions | |
| Recent Price: 58.09 Market Intelligence Score: 42 | |
| Day Percent Change: 1.47% Day Change: 0.84 | |
| Week Change: 2.22% Year-to-date Change: -10.1% | |
| TD Links: Profile News Message Board | |
| Charts:- Daily , Weekly | |
| Add TD to Watchlist: View: Get Complete TD Trend Analysis ➞ | |
 | LULU Lululemon Athletica Inc. |
| Sector: Consumer Staples | |
| SubSector: Textile - Apparel Clothing | |
| MarketCap: 24627.8 Millions | |
| Recent Price: 352.47 Market Intelligence Score: 42 | |
| Day Percent Change: 1.43% Day Change: 4.96 | |
| Week Change: 4.86% Year-to-date Change: -31.1% | |
| LULU Links: Profile News Message Board | |
| Charts:- Daily , Weekly | |
| Add LULU to Watchlist: View: Get Complete LULU Trend Analysis ➞ | |
 | ARCO Arcos Dorados Holdings Inc. |
| Sector: Services & Goods | |
| SubSector: Restaurants | |
| MarketCap: 778.87 Millions | |
| Recent Price: 10.90 Market Intelligence Score: 42 | |
| Day Percent Change: 1.30% Day Change: 0.14 | |
| Week Change: -0.91% Year-to-date Change: -14.1% | |
| ARCO Links: Profile News Message Board | |
| Charts:- Daily , Weekly | |
| Add ARCO to Watchlist: View: Get Complete ARCO Trend Analysis ➞ | |
 | BMO Bank of Montreal |
| Sector: Financials | |
| SubSector: Money Center Banks | |
| MarketCap: 32830.2 Millions | |
| Recent Price: 92.14 Market Intelligence Score: 42 | |
| Day Percent Change: 1.24% Day Change: 1.13 | |
| Week Change: -0.95% Year-to-date Change: -6.9% | |
| BMO Links: Profile News Message Board | |
| Charts:- Daily , Weekly | |
| Add BMO to Watchlist: View: Get Complete BMO Trend Analysis ➞ | |
 | BCE BCE Inc. |
| Sector: Technology | |
| SubSector: Telecom Services - Domestic | |
| MarketCap: 37288.3 Millions | |
| Recent Price: 32.59 Market Intelligence Score: 42 | |
| Day Percent Change: 1.18% Day Change: 0.38 | |
| Week Change: 1.49% Year-to-date Change: -17.2% | |
| BCE Links: Profile News Message Board | |
| Charts:- Daily , Weekly | |
| Add BCE to Watchlist: View: Get Complete BCE Trend Analysis ➞ | |
 | LVRO Lavoro Limited |
| Sector: Materials | |
| SubSector: Agricultural Inputs | |
| MarketCap: 686 Millions | |
| Recent Price: 5.88 Market Intelligence Score: 42 | |
| Day Percent Change: 0.60% Day Change: 0.04 | |
| Week Change: -3.45% Year-to-date Change: -33.8% | |
| LVRO Links: Profile News Message Board | |
| Charts:- Daily , Weekly | |
| Add LVRO to Watchlist: View: Get Complete LVRO Trend Analysis ➞ | |
 | ACHV Achieve Life Sciences, Inc. |
| Sector: Health Care | |
| SubSector: Biotechnology | |
| MarketCap: 7.32785 Millions | |
| Recent Price: 4.55 Market Intelligence Score: 42 | |
| Day Percent Change: -0.33% Day Change: -0.02 | |
| Week Change: 4.72% Year-to-date Change: 8.1% | |
| ACHV Links: Profile News Message Board | |
| Charts:- Daily , Weekly | |
| Add ACHV to Watchlist: View: Get Complete ACHV Trend Analysis ➞ | |
 | BHC Bausch Health Companies Inc. |
| Sector: Health Care | |
| SubSector: Drug Delivery | |
| MarketCap: 5485.3 Millions | |
| Recent Price: 8.69 Market Intelligence Score: 41 | |
| Day Percent Change: 1.05% Day Change: 0.09 | |
| Week Change: -0.8% Year-to-date Change: 8.4% | |
| BHC Links: Profile News Message Board | |
| Charts:- Daily , Weekly | |
| Add BHC to Watchlist: View: Get Complete BHC Trend Analysis ➞ | |
 | GIL Gildan Activewear Inc. |
| Sector: Consumer Staples | |
| SubSector: Textile - Apparel Clothing | |
| MarketCap: 2411.65 Millions | |
| Recent Price: 35.20 Market Intelligence Score: 41 | |
| Day Percent Change: 0.23% Day Change: 0.08 | |
| Week Change: -1.1% Year-to-date Change: 6.5% | |
| GIL Links: Profile News Message Board | |
| Charts:- Daily , Weekly | |
| Add GIL to Watchlist: View: Get Complete GIL Trend Analysis ➞ | |
 | MOGO Mogo Inc. |
| Sector: Financials | |
| SubSector: Credit Services | |
| MarketCap: 21.9208 Millions | |
| Recent Price: 1.84 Market Intelligence Score: 41 | |
| Day Percent Change: 0.00% Day Change: 0.00 | |
| Week Change: -6.12% Year-to-date Change: -0.5% | |
| MOGO Links: Profile News Message Board | |
| Charts:- Daily , Weekly | |
| Add MOGO to Watchlist: View: Get Complete MOGO Trend Analysis ➞ | |
 | ERJ Embraer S.A. |
| Sector: Industrials | |
| SubSector: Aerospace/Defense Products & Services | |
| MarketCap: 1623.71 Millions | |
| Recent Price: 23.79 Market Intelligence Score: 41 | |
| Day Percent Change: -1.78% Day Change: -0.43 | |
| Week Change: -4.27% Year-to-date Change: 28.9% | |
| ERJ Links: Profile News Message Board | |
| Charts:- Daily , Weekly | |
| Add ERJ to Watchlist: View: Get Complete ERJ Trend Analysis ➞ | |
 | CRON Cronos Group Inc. |
| Sector: Health Care | |
| SubSector: Biotechnology | |
| MarketCap: 1935.95 Millions | |
| Recent Price: 2.37 Market Intelligence Score: 41 | |
| Day Percent Change: -1.66% Day Change: -0.04 | |
| Week Change: -6.69% Year-to-date Change: 13.4% | |
| CRON Links: Profile News Message Board | |
| Charts:- Daily , Weekly | |
| Add CRON to Watchlist: View: Get Complete CRON Trend Analysis ➞ | |
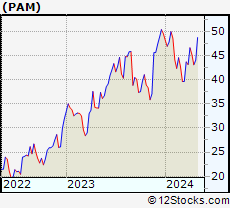 | PAM Pampa Energia S.A. |
| Sector: Utilities | |
| SubSector: Electric Utilities | |
| MarketCap: 1004.14 Millions | |
| Recent Price: 43.08 Market Intelligence Score: 40 | |
| Day Percent Change: 2.84% Day Change: 1.19 | |
| Week Change: -4.65% Year-to-date Change: -13.0% | |
| PAM Links: Profile News Message Board | |
| Charts:- Daily , Weekly | |
| Add PAM to Watchlist: View: Get Complete PAM Trend Analysis ➞ | |
 | CINT CI&T Inc |
| Sector: Technology | |
| SubSector: Software - Infrastructure | |
| MarketCap: 806 Millions | |
| Recent Price: 4.04 Market Intelligence Score: 40 | |
| Day Percent Change: -1.34% Day Change: -0.05 | |
| Week Change: -14.04% Year-to-date Change: -24.1% | |
| CINT Links: Profile News Message Board | |
| Charts:- Daily , Weekly | |
| Add CINT to Watchlist: View: Get Complete CINT Trend Analysis ➞ | |
 | SBS Companhia de Saneamento Basico do Estado de Sao Paulo - SABESP |
| Sector: Utilities | |
| SubSector: Water Utilities | |
| MarketCap: 5498.72 Millions | |
| Recent Price: 15.49 Market Intelligence Score: 38 | |
| Day Percent Change: -1.59% Day Change: -0.25 | |
| Week Change: -1.9% Year-to-date Change: 1.7% | |
| SBS Links: Profile News Message Board | |
| Charts:- Daily , Weekly | |
| Add SBS to Watchlist: View: Get Complete SBS Trend Analysis ➞ | |
 | BNS The Bank of Nova Scotia |
| Sector: Financials | |
| SubSector: Money Center Banks | |
| MarketCap: 48742.1 Millions | |
| Recent Price: 46.74 Market Intelligence Score: 37 | |
| Day Percent Change: 0.37% Day Change: 0.17 | |
| Week Change: -3.01% Year-to-date Change: -4.0% | |
| BNS Links: Profile News Message Board | |
| Charts:- Daily , Weekly | |
| Add BNS to Watchlist: View: Get Complete BNS Trend Analysis ➞ | |
 | SIM Grupo Simec, S.A.B. de C.V. |
| Sector: Materials | |
| SubSector: Steel & Iron | |
| MarketCap: 1418.28 Millions | |
| Recent Price: 31.00 Market Intelligence Score: 37 | |
| Day Percent Change: 0.00% Day Change: 0.00 | |
| Week Change: -6.06% Year-to-date Change: -0.6% | |
| SIM Links: Profile News Message Board | |
| Charts:- Daily , Weekly | |
| Add SIM to Watchlist: View: Get Complete SIM Trend Analysis ➞ | |
 | APT Alpha Pro Tech, Ltd. |
| Sector: Industrials | |
| SubSector: General Building Materials | |
| MarketCap: 125.953 Millions | |
| Recent Price: 6.16 Market Intelligence Score: 36 | |
| Day Percent Change: 2.67% Day Change: 0.16 | |
| Week Change: 3.36% Year-to-date Change: 16.5% | |
| APT Links: Profile News Message Board | |
| Charts:- Daily , Weekly | |
| Add APT to Watchlist: View: Get Complete APT Trend Analysis ➞ | |
 | LAC Lithium Americas Corp. |
| Sector: Materials | |
| SubSector: Industrial Metals & Minerals | |
| MarketCap: 192.01 Millions | |
| Recent Price: 4.73 Market Intelligence Score: 36 | |
| Day Percent Change: 1.50% Day Change: 0.07 | |
| Week Change: -35.56% Year-to-date Change: -26.1% | |
| LAC Links: Profile News Message Board | |
| Charts:- Daily , Weekly | |
| Add LAC to Watchlist: View: Get Complete LAC Trend Analysis ➞ | |
| To view more stocks, click on Next / Previous arrows or select different range: 0 - 25 , 25 - 50 , 50 - 75 , 75 - 100 , 100 - 125 , 125 - 150 , 150 - 175 , 175 - 200 , 200 - 225 | ||
| Click To Change The Sort Order: By Market Cap or Company Size Performance: Year-to-date, Week and Day | |
| Select Chart Type: | ||
 Best Stocks Today 12Stocks.com |
© 2024 12Stocks.com Terms & Conditions Privacy Contact Us
All Information Provided Only For Education And Not To Be Used For Investing or Trading. See Terms & Conditions


One More Thing ... Get Best Stocks Delivered Daily!
Never Ever Miss A Move With Our Top Ten Stocks Lists
Find Best Stocks In Any Market - Bull or Bear Market
Take A Peek At Our Top Ten Stocks Lists: Daily, Weekly, Year-to-Date & Top Trends
Find Best Stocks In Any Market - Bull or Bear Market
Take A Peek At Our Top Ten Stocks Lists: Daily, Weekly, Year-to-Date & Top Trends
Latin America Stocks With Best Up Trends [0-bearish to 100-bullish]: SilverCrest Metals[100], Alamos Gold[100], Kinross Gold[93], Methanex [93], Agnico Eagle[93], Pan American[90], Crescent Point[88], IRSA Inversiones[88], Sandstorm Gold[88], Suncor Energy[88], Cenovus Energy[88]
Best Latin America Stocks Year-to-Date:
Aurora Cannabis[1256.57%], Fusion [121.04%], D-Wave Quantum[81.22%], Banco Macro[73.59%], Grupo Financiero[64.84%], Banco BBVA[57.54%], McEwen Mining[55.62%], Canopy Growth[55.38%], IAMGOLD [44.66%], OrganiGram [43.51%], Hudbay Minerals[41.12%] Best Latin America Stocks This Week:
Controladora Vuela[10.64%], SilverCrest Metals[9.57%], TransAlta [6.44%], Canada Goose[5.84%], Lululemon Athletica[4.86%], Petroleo Brasileiro[4.77%], Kinross Gold[4.48%], IMAX [4.26%], Agnico Eagle[3.89%], Ready Capital[3.61%], Sprott Physical[3.08%] Best Latin America Stocks Daily:
Vision Marine[7.40%], Banco BBVA[6.20%], Petroleo Brasileiro[5.71%], Cresud Sociedad[4.44%], SilverCrest Metals[4.36%], Kinross Gold[3.99%], SSR Mining[3.99%], Grupo Supervielle[3.77%], Aurinia [3.74%], Companhia Siderurgica[3.68%], Ambipar Emergency[3.48%]