
 Login Sign Up


| |||||
 |  | ||||

| 12Stocks.com Market Intelligence |
Best Latin America Stocks
|
|
| Quick Read: Top Latin America Stocks By Performances & Trends: Daily, Weekly, Year-to-Date, Market Cap (Size) & Technical Trends | |||
| Best Latin America Views: Quick Browse View, Summary & Slide Show | |||
| 12Stocks.com Latin America Stocks Performances & Trends Daily | |||||||||
|
|  The overall market intelligence score is 18 (0-bearish to 100-bullish) which puts Latin America index in short term bearish trend. The market intelligence score from previous trading session is 32 and hence a deterioration of trend.
| ||||||||
| Here are the market intelligence trend scores of the most requested Latin America stocks at 12Stocks.com (click stock name for detailed review): | |
| Scroll down this page for most comprehensive review of Latin America stocks by performance, trends, technical analysis, charts, fund plays & more | |


| 12Stocks.com: Top Performing Latin America Index Stocks | ||||||||||||||||||||||||||||||||||||||||||||||||
 The top performing Latin America Index stocks year to date are
Now, more recently, over last week, the top performing Latin America Index stocks on the move are


|
||||||||||||||||||||||||||||||||||||||||||||||||
| 12Stocks.com: Investing in Latin America Index with Stocks | |
|
The following table helps investors and traders sort through current performance and trends (as measured by market intelligence score) of various
stocks in the Latin America Index. Quick View: Move mouse or cursor over stock symbol (ticker) to view short-term technical chart and over stock name to view long term chart. Click on  to add stock symbol to your watchlist and to add stock symbol to your watchlist and  to view watchlist. Click on any ticker or stock name for detailed market intelligence report for that stock. to view watchlist. Click on any ticker or stock name for detailed market intelligence report for that stock. |
12Stocks.com Performance of Stocks in Latin America Index
| Ticker | Stock Name | Watchlist | Category | Recent Price | Market Intelligence Score | Change % | YTD Change% |
| BBAR | Banco BBVA |   | Financials | 8.96 | 63 | 1.24% | 64.71% |
| SNDL | Sundial Growers | | Health Care | 1.96 | 63 | -2.00% | 19.51% |
| IMAX | IMAX | | Services & Goods | 17.46 | 63 | -1.13% | 16.25% |
| MFC | Manulife Financial | | Financials | 23.37 | 63 | -0.47% | 5.75% |
| IAG | IAMGOLD | | Materials | 3.71 | 61 | 3.06% | 46.64% |
| NFGC | New Found | | Materials | 3.71 | 61 | -2.11% | 5.40% |
| GIL | Gildan Activewear | | Consumer Staples | 35.07 | 61 | -1.60% | 6.08% |
| NGD | New Gold | | Materials | 1.81 | 61 | 5.23% | 23.97% |
| EGO | Eldorado Gold | | Materials | 14.78 | 61 | 3.07% | 13.96% |
| IMO | Imperial Oil | | Energy | 71.27 | 61 | 0.91% | 24.62% |
| NVEI | Nuvei | | Technology | 32.24 | 61 | 0.55% | 22.73% |
| MEOH | Methanex | | Materials | 47.77 | 61 | 0.13% | 0.87% |
| KFS | Kingsway Financial | | Financials | 8.53 | 60 | -1.95% | 1.55% |
| TU | TELUS | | Technology | 16.10 | 60 | 0.12% | -9.50% |
| TD | Toronto-Dominion Bank | | Financials | 59.11 | 59 | 0.75% | -8.53% |
| DOOO | BRP | | Consumer Staples | 69.11 | 59 | -0.23% | -3.60% |
| GGAL | Grupo Financiero | | Financials | 29.49 | 58 | 1.44% | 70.81% |
| SUPV | Grupo Supervielle | | Financials | 5.75 | 58 | 0.52% | 41.63% |
| NAK | Northern Dynasty | | Materials | 0.29 | 58 | -0.92% | -9.59% |
| VALE | Vale S.A | | Materials | 12.06 | 57 | -2.51% | -23.96% |
| LULU | Lululemon Athletica | | Consumer Staples | 360.00 | 57 | -1.26% | -29.59% |
| NU | Nu | | Financials | 10.87 | 56 | 1.87% | 30.34% |
| YPF | YPF Sociedad | | Energy | 20.24 | 56 | 0.40% | 17.74% |
| CLS | Celestica | | Technology | 43.25 | 56 | -1.93% | 47.71% |
| RBA | Ritchie Bros. | | Services & Goods | 73.33 | 56 | -0.05% | 9.63% |
| To view more stocks, click on Next / Previous arrows or select different range: 0 - 25 , 25 - 50 , 50 - 75 , 75 - 100 , 100 - 125 , 125 - 150 , 150 - 175 , 175 - 200 , 200 - 225 | ||
 | Click To Change The Sort Order: By Market Cap or Company Size Performance: Year-to-date, Week and Day |  |
| Detailed Overview Of Latin America Stocks |
| Latin America Technical Overview, Leaders & Laggards, Top Latin America ETF Funds & Detailed Latin America Stocks List, Charts, Trends & More |
| Latin America: Technical Analysis, Trends & YTD Performance | |
 ILF Weekly Chart |
|
| Long Term Trend: Not Good | |
| Medium Term Trend: Not Good | |
 ILF Daily Chart |
|
| Short Term Trend: Deteriorating | |
| Overall Trend Score: 18 | |
| YTD Performance: -6.23% | |
| **Trend Scores & Views Are Only For Educational Purposes And Not For Investing | |
| 12Stocks.com: Investing in Latin America Index using Exchange Traded Funds | |
|
The following table shows list of key exchange traded funds (ETF) that
help investors play Latin America stock market. For detailed view, check out our ETF Funds section of our website. Quick View: Move mouse or cursor over ETF symbol (ticker) to view short-term technical chart and over ETF name to view long term chart. Click on ticker or stock name for detailed view. Click on to add stock symbol to your watchlist and to view watchlist. |
12Stocks.com List of ETFs that track Latin America Index
| Ticker | ETF Name | Watchlist | Recent Price | Market Intelligence Score | Change % | Week % | Year-to-date % |
| ILF | Latin America 40 | | 27.25 | 18 | -0.22 | 0.66 | -6.23% |
| EWC | Canada | | 37.50 | 61 | 0.37 | 1.05 | 2.24% |
| FLN | Latin America AlphaDEX | | 19.37 | 31 | -0.51 | 0.78 | -6.83% |
| EWZ | Brazil | | 30.81 | 35 | -0.58 | 0.23 | -11.87% |
| EWW | Mexico | | 65.80 | 18 | 0.05 | 1.4 | -3.02% |
| ARGT | Argentina | | 54.62 | 71 | 0.18 | 2.15 | 6.39% |
| EWZS | Brazil Small-Cap | | 13.06 | 32 | -0.87 | 0.42 | -13.31% |
| BRF | Brazil Small-Cap | | 14.88 | 25 | -0.93 | 0.13 | -15.4% |
| BZQ | Short Brazil | | 12.63 | 63 | 0.84 | -0.8 | 25.92% |
| BRZU | Brazil Bull 3X | | 77.07 | 27 | -1.41 | 0.35 | -25.09% |
| FBZ | Brazil AlphaDEX | | 11.17 | 10 | -0.71 | -0.62 | -8.61% |
| 12Stocks.com: Charts, Trends, Fundamental Data and Performances of Latin America Stocks | |
|
We now take in-depth look at all Latin America stocks including charts, multi-period performances and overall trends (as measured by market intelligence score). One can sort Latin America stocks (click link to choose) by Daily, Weekly and by Year-to-Date performances. Also, one can sort by size of the company or by market capitalization. |
| Select Your Default Chart Type: | |||||
| |||||
| Click on stock symbol or name for detailed view. Click on to add stock symbol to your watchlist and to view watchlist. Quick View: Move mouse or cursor over "Daily" to quickly view daily technical stock chart and over "Weekly" to view weekly technical stock chart. | |||||

 | BBAR Banco BBVA Argentina S.A. |
| Sector: Financials | |
| SubSector: Foreign Regional Banks | |
| MarketCap: 895.479 Millions | |
| Recent Price: 8.96 Market Intelligence Score: 63 | |
| Day Percent Change: 1.24% Day Change: 0.11 | |
| Week Change: 4.55% Year-to-date Change: 64.7% | |
| BBAR Links: Profile News Message Board | |
| Charts:- Daily , Weekly | |
| Add BBAR to Watchlist: View: Get Complete BBAR Trend Analysis ➞ | |
 | SNDL Sundial Growers Inc. |
| Sector: Health Care | |
| SubSector: Drug Manufacturers - Other | |
| MarketCap: 94.4033 Millions | |
| Recent Price: 1.96 Market Intelligence Score: 63 | |
| Day Percent Change: -2.00% Day Change: -0.04 | |
| Week Change: 4.26% Year-to-date Change: 19.5% | |
| SNDL Links: Profile News Message Board | |
| Charts:- Daily , Weekly | |
| Add SNDL to Watchlist: View: Get Complete SNDL Trend Analysis ➞ | |
 | IMAX IMAX Corporation |
| Sector: Services & Goods | |
| SubSector: Entertainment - Diversified | |
| MarketCap: 874.237 Millions | |
| Recent Price: 17.46 Market Intelligence Score: 63 | |
| Day Percent Change: -1.13% Day Change: -0.20 | |
| Week Change: 1.93% Year-to-date Change: 16.3% | |
| IMAX Links: Profile News Message Board | |
| Charts:- Daily , Weekly | |
| Add IMAX to Watchlist: View: Get Complete IMAX Trend Analysis ➞ | |
 | MFC Manulife Financial Corporation |
| Sector: Financials | |
| SubSector: Life Insurance | |
| MarketCap: 22188.7 Millions | |
| Recent Price: 23.37 Market Intelligence Score: 63 | |
| Day Percent Change: -0.47% Day Change: -0.11 | |
| Week Change: 1.3% Year-to-date Change: 5.8% | |
| MFC Links: Profile News Message Board | |
| Charts:- Daily , Weekly | |
| Add MFC to Watchlist: View: Get Complete MFC Trend Analysis ➞ | |
 | IAG IAMGOLD Corporation |
| Sector: Materials | |
| SubSector: Gold | |
| MarketCap: 1158.09 Millions | |
| Recent Price: 3.71 Market Intelligence Score: 61 | |
| Day Percent Change: 3.06% Day Change: 0.11 | |
| Week Change: 1.37% Year-to-date Change: 46.6% | |
| IAG Links: Profile News Message Board | |
| Charts:- Daily , Weekly | |
| Add IAG to Watchlist: View: Get Complete IAG Trend Analysis ➞ | |
 | NFGC New Found Gold Corp. |
| Sector: Materials | |
| SubSector: Gold | |
| MarketCap: 868 Millions | |
| Recent Price: 3.71 Market Intelligence Score: 61 | |
| Day Percent Change: -2.11% Day Change: -0.08 | |
| Week Change: 0.82% Year-to-date Change: 5.4% | |
| NFGC Links: Profile News Message Board | |
| Charts:- Daily , Weekly | |
| Add NFGC to Watchlist: View: Get Complete NFGC Trend Analysis ➞ | |
 | GIL Gildan Activewear Inc. |
| Sector: Consumer Staples | |
| SubSector: Textile - Apparel Clothing | |
| MarketCap: 2411.65 Millions | |
| Recent Price: 35.07 Market Intelligence Score: 61 | |
| Day Percent Change: -1.60% Day Change: -0.57 | |
| Week Change: -0.37% Year-to-date Change: 6.1% | |
| GIL Links: Profile News Message Board | |
| Charts:- Daily , Weekly | |
| Add GIL to Watchlist: View: Get Complete GIL Trend Analysis ➞ | |
 | NGD New Gold Inc. |
| Sector: Materials | |
| SubSector: Gold | |
| MarketCap: 398.119 Millions | |
| Recent Price: 1.81 Market Intelligence Score: 61 | |
| Day Percent Change: 5.23% Day Change: 0.09 | |
| Week Change: 3.43% Year-to-date Change: 24.0% | |
| NGD Links: Profile News Message Board | |
| Charts:- Daily , Weekly | |
| Add NGD to Watchlist: View: Get Complete NGD Trend Analysis ➞ | |
 | EGO Eldorado Gold Corporation |
| Sector: Materials | |
| SubSector: Gold | |
| MarketCap: 982.519 Millions | |
| Recent Price: 14.78 Market Intelligence Score: 61 | |
| Day Percent Change: 3.07% Day Change: 0.44 | |
| Week Change: -1.73% Year-to-date Change: 14.0% | |
| EGO Links: Profile News Message Board | |
| Charts:- Daily , Weekly | |
| Add EGO to Watchlist: View: Get Complete EGO Trend Analysis ➞ | |
 | IMO Imperial Oil Limited |
| Sector: Energy | |
| SubSector: Major Integrated Oil & Gas | |
| MarketCap: 8171.25 Millions | |
| Recent Price: 71.27 Market Intelligence Score: 61 | |
| Day Percent Change: 0.91% Day Change: 0.64 | |
| Week Change: 2.64% Year-to-date Change: 24.6% | |
| IMO Links: Profile News Message Board | |
| Charts:- Daily , Weekly | |
| Add IMO to Watchlist: View: Get Complete IMO Trend Analysis ➞ | |
 | NVEI Nuvei Corporation |
| Sector: Technology | |
| SubSector: Software - Infrastructure | |
| MarketCap: 5490 Millions | |
| Recent Price: 32.24 Market Intelligence Score: 61 | |
| Day Percent Change: 0.55% Day Change: 0.18 | |
| Week Change: 0.53% Year-to-date Change: 22.7% | |
| NVEI Links: Profile News Message Board | |
| Charts:- Daily , Weekly | |
| Add NVEI to Watchlist: View: Get Complete NVEI Trend Analysis ➞ | |
 | MEOH Methanex Corporation |
| Sector: Materials | |
| SubSector: Specialty Chemicals | |
| MarketCap: 894.357 Millions | |
| Recent Price: 47.77 Market Intelligence Score: 61 | |
| Day Percent Change: 0.13% Day Change: 0.06 | |
| Week Change: -0.29% Year-to-date Change: 0.9% | |
| MEOH Links: Profile News Message Board | |
| Charts:- Daily , Weekly | |
| Add MEOH to Watchlist: View: Get Complete MEOH Trend Analysis ➞ | |
 | KFS Kingsway Financial Services Inc. |
| Sector: Financials | |
| SubSector: Property & Casualty Insurance | |
| MarketCap: 47.5812 Millions | |
| Recent Price: 8.53 Market Intelligence Score: 60 | |
| Day Percent Change: -1.95% Day Change: -0.17 | |
| Week Change: -1.16% Year-to-date Change: 1.6% | |
| KFS Links: Profile News Message Board | |
| Charts:- Daily , Weekly | |
| Add KFS to Watchlist: View: Get Complete KFS Trend Analysis ➞ | |
 | TU TELUS Corporation |
| Sector: Technology | |
| SubSector: Wireless Communications | |
| MarketCap: 10864.7 Millions | |
| Recent Price: 16.10 Market Intelligence Score: 60 | |
| Day Percent Change: 0.12% Day Change: 0.02 | |
| Week Change: 1.13% Year-to-date Change: -9.5% | |
| TU Links: Profile News Message Board | |
| Charts:- Daily , Weekly | |
| Add TU to Watchlist: View: Get Complete TU Trend Analysis ➞ | |
 | TD The Toronto-Dominion Bank |
| Sector: Financials | |
| SubSector: Money Center Banks | |
| MarketCap: 75152.4 Millions | |
| Recent Price: 59.11 Market Intelligence Score: 59 | |
| Day Percent Change: 0.75% Day Change: 0.44 | |
| Week Change: 1.76% Year-to-date Change: -8.5% | |
| TD Links: Profile News Message Board | |
| Charts:- Daily , Weekly | |
| Add TD to Watchlist: View: Get Complete TD Trend Analysis ➞ | |
 | DOOO BRP Inc. |
| Sector: Consumer Staples | |
| SubSector: Recreational Vehicles | |
| MarketCap: 638.559 Millions | |
| Recent Price: 69.11 Market Intelligence Score: 59 | |
| Day Percent Change: -0.23% Day Change: -0.16 | |
| Week Change: -0.48% Year-to-date Change: -3.6% | |
| DOOO Links: Profile News Message Board | |
| Charts:- Daily , Weekly | |
| Add DOOO to Watchlist: View: Get Complete DOOO Trend Analysis ➞ | |
 | GGAL Grupo Financiero Galicia S.A. |
| Sector: Financials | |
| SubSector: Foreign Regional Banks | |
| MarketCap: 1274.69 Millions | |
| Recent Price: 29.49 Market Intelligence Score: 58 | |
| Day Percent Change: 1.44% Day Change: 0.42 | |
| Week Change: 3.62% Year-to-date Change: 70.8% | |
| GGAL Links: Profile News Message Board | |
| Charts:- Daily , Weekly | |
| Add GGAL to Watchlist: View: Get Complete GGAL Trend Analysis ➞ | |
 | SUPV Grupo Supervielle S.A. |
| Sector: Financials | |
| SubSector: Foreign Regional Banks | |
| MarketCap: 224.779 Millions | |
| Recent Price: 5.75 Market Intelligence Score: 58 | |
| Day Percent Change: 0.52% Day Change: 0.03 | |
| Week Change: 4.55% Year-to-date Change: 41.6% | |
| SUPV Links: Profile News Message Board | |
| Charts:- Daily , Weekly | |
| Add SUPV to Watchlist: View: Get Complete SUPV Trend Analysis ➞ | |
 | NAK Northern Dynasty Minerals Ltd. |
| Sector: Materials | |
| SubSector: Industrial Metals & Minerals | |
| MarketCap: 167.01 Millions | |
| Recent Price: 0.29 Market Intelligence Score: 58 | |
| Day Percent Change: -0.92% Day Change: 0.00 | |
| Week Change: -0.1% Year-to-date Change: -9.6% | |
| NAK Links: Profile News Message Board | |
| Charts:- Daily , Weekly | |
| Add NAK to Watchlist: View: Get Complete NAK Trend Analysis ➞ | |
 | VALE Vale S.A. |
| Sector: Materials | |
| SubSector: Industrial Metals & Minerals | |
| MarketCap: 43601 Millions | |
| Recent Price: 12.06 Market Intelligence Score: 57 | |
| Day Percent Change: -2.51% Day Change: -0.31 | |
| Week Change: -0.99% Year-to-date Change: -24.0% | |
| VALE Links: Profile News Message Board | |
| Charts:- Daily , Weekly | |
| Add VALE to Watchlist: View: Get Complete VALE Trend Analysis ➞ | |
 | LULU Lululemon Athletica Inc. |
| Sector: Consumer Staples | |
| SubSector: Textile - Apparel Clothing | |
| MarketCap: 24627.8 Millions | |
| Recent Price: 360.00 Market Intelligence Score: 57 | |
| Day Percent Change: -1.26% Day Change: -4.59 | |
| Week Change: 2.14% Year-to-date Change: -29.6% | |
| LULU Links: Profile News Message Board | |
| Charts:- Daily , Weekly | |
| Add LULU to Watchlist: View: Get Complete LULU Trend Analysis ➞ | |
 | NU Nu Holdings Ltd. |
| Sector: Financials | |
| SubSector: Banks - Diversified | |
| MarketCap: 37240 Millions | |
| Recent Price: 10.87 Market Intelligence Score: 56 | |
| Day Percent Change: 1.87% Day Change: 0.20 | |
| Week Change: 3.72% Year-to-date Change: 30.3% | |
| NU Links: Profile News Message Board | |
| Charts:- Daily , Weekly | |
| Add NU to Watchlist: View: Get Complete NU Trend Analysis ➞ | |
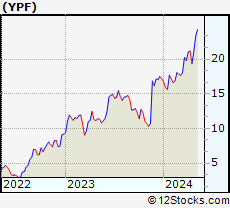 | YPF YPF Sociedad Anonima |
| Sector: Energy | |
| SubSector: Major Integrated Oil & Gas | |
| MarketCap: 2272.35 Millions | |
| Recent Price: 20.24 Market Intelligence Score: 56 | |
| Day Percent Change: 0.40% Day Change: 0.08 | |
| Week Change: 4.65% Year-to-date Change: 17.7% | |
| YPF Links: Profile News Message Board | |
| Charts:- Daily , Weekly | |
| Add YPF to Watchlist: View: Get Complete YPF Trend Analysis ➞ | |
 | CLS Celestica Inc. |
| Sector: Technology | |
| SubSector: Printed Circuit Boards | |
| MarketCap: 474.235 Millions | |
| Recent Price: 43.25 Market Intelligence Score: 56 | |
| Day Percent Change: -1.93% Day Change: -0.85 | |
| Week Change: 6.19% Year-to-date Change: 47.7% | |
| CLS Links: Profile News Message Board | |
| Charts:- Daily , Weekly | |
| Add CLS to Watchlist: View: Get Complete CLS Trend Analysis ➞ | |
 | RBA Ritchie Bros. Auctioneers Incorporated |
| Sector: Services & Goods | |
| SubSector: Business Services | |
| MarketCap: 3491.02 Millions | |
| Recent Price: 73.33 Market Intelligence Score: 56 | |
| Day Percent Change: -0.05% Day Change: -0.04 | |
| Week Change: 0.99% Year-to-date Change: 9.6% | |
| RBA Links: Profile News Message Board | |
| Charts:- Daily , Weekly | |
| Add RBA to Watchlist: View: Get Complete RBA Trend Analysis ➞ | |
| To view more stocks, click on Next / Previous arrows or select different range: 0 - 25 , 25 - 50 , 50 - 75 , 75 - 100 , 100 - 125 , 125 - 150 , 150 - 175 , 175 - 200 , 200 - 225 | ||
| Click To Change The Sort Order: By Market Cap or Company Size Performance: Year-to-date, Week and Day | |
| Select Chart Type: | ||
 Best Stocks Today 12Stocks.com |
© 2024 12Stocks.com Terms & Conditions Privacy Contact Us
All Information Provided Only For Education And Not To Be Used For Investing or Trading. See Terms & Conditions


One More Thing ... Get Best Stocks Delivered Daily!
Never Ever Miss A Move With Our Top Ten Stocks Lists
Find Best Stocks In Any Market - Bull or Bear Market
Take A Peek At Our Top Ten Stocks Lists: Daily, Weekly, Year-to-Date & Top Trends
Find Best Stocks In Any Market - Bull or Bear Market
Take A Peek At Our Top Ten Stocks Lists: Daily, Weekly, Year-to-Date & Top Trends
Latin America Stocks With Best Up Trends [0-bearish to 100-bullish]: SilverCrest Metals[100], Grupo Aeroportuario[100], Mercer [100], Descartes Systems[100], Hudbay Minerals[95], Triple Flag[95], Grupo Aeroportuario[93], SunOpta [93], Despegar.com [90], Controladora Vuela[88], BRF S.A[88]
Best Latin America Stocks Year-to-Date:
Aurora Cannabis[1311.17%], Fusion [123.13%], Banco Macro[71.01%], Grupo Financiero[70.81%], Canopy Growth[70.06%], D-Wave Quantum[68.68%], McEwen Mining[65.6%], Banco BBVA[64.71%], Celestica [47.71%], Hudbay Minerals[47.1%], IAMGOLD [46.64%] Best Latin America Stocks This Week:
Grupo Aeroportuario[15.25%], Grupo Aeroportuario[13.53%], Grupo Aeroportuario[12.82%], Controladora Vuela[12.56%], SunOpta [9.9%], Despegar.com [9.61%], Canopy Growth[9.45%], Afya [8.75%], Central Puerto[7.78%], SilverCrest Metals[7.72%], Trilogy Metals[7.58%] Best Latin America Stocks Daily:
McEwen Mining[9.34%], Teck Resources[9.02%], New Gold[5.23%], Grupo Aeroportuario[5.18%], Hudbay Minerals[4.91%], Afya [4.69%], Trilogy Metals[4.56%], SilverCrest Metals[4.42%], Endeavour Silver[3.33%], Coca-Cola FEMSA[3.22%], TransAlta [3.17%]