
 Login Sign Up


| |||||
 |  | ||||

| 12Stocks.com Market Intelligence |
Best Latin America Stocks
|
|
| Quick Read: Top Latin America Stocks By Performances & Trends: Daily, Weekly, Year-to-Date, Market Cap (Size) & Technical Trends | |||
| Best Latin America Views: Quick Browse View, Summary & Slide Show | |||
| 12Stocks.com Latin America Stocks Performances & Trends Daily | |||||||||
|
|  The overall market intelligence score is 35 (0-bearish to 100-bullish) which puts Latin America index in short term bearish to neutral trend. The market intelligence score from previous trading session is 25 and hence an improvement of trend.
| ||||||||
| Here are the market intelligence trend scores of the most requested Latin America stocks at 12Stocks.com (click stock name for detailed review): | |
| Scroll down this page for most comprehensive review of Latin America stocks by performance, trends, technical analysis, charts, fund plays & more | |


| 12Stocks.com: Top Performing Latin America Index Stocks | ||||||||||||||||||||||||||||||||||||||||||||||||
 The top performing Latin America Index stocks year to date are
Now, more recently, over last week, the top performing Latin America Index stocks on the move are


|
||||||||||||||||||||||||||||||||||||||||||||||||
| 12Stocks.com: Investing in Latin America Index with Stocks | |
|
The following table helps investors and traders sort through current performance and trends (as measured by market intelligence score) of various
stocks in the Latin America Index. Quick View: Move mouse or cursor over stock symbol (ticker) to view short-term technical chart and over stock name to view long term chart. Click on  to add stock symbol to your watchlist and to add stock symbol to your watchlist and  to view watchlist. Click on any ticker or stock name for detailed market intelligence report for that stock. to view watchlist. Click on any ticker or stock name for detailed market intelligence report for that stock. |
12Stocks.com Performance of Stocks in Latin America Index
| Ticker | Stock Name | Watchlist | Category | Recent Price | Market Intelligence Score | Change % | YTD Change% |
| BAM | Brookfield Asset |   | Financials | 38.19 | 0 | 0.00% | -4.93% |
| WPRT | Westport Fuel | | Consumer Staples | 5.21 | 0 | -7.13% | -21.30% |
| BLCO | Bausch + | | Health Care | 14.13 | 0 | -2.85% | -16.91% |
| MOGO | Mogo | | Financials | 1.83 | 0 | -1.88% | -1.08% |
| GIB | CGI | | Technology | 99.41 | 0 | -1.79% | -7.28% |
| BIOX | Bioceres Crop | | Industrials | 11.63 | 0 | -1.48% | -15.33% |
| CP | Canadian Pacific | | Transports | 77.57 | 0 | -1.10% | -1.88% |
| TMQ | Trilogy Metals | | Materials | 0.40 | 0 | -0.52% | -6.95% |
| CNI | Canadian National | | Transports | 121.01 | 0 | -0.35% | -3.68% |
| RBA | Ritchie Bros. | | Services & Goods | 71.37 | 0 | -0.29% | 6.70% |
| To view more stocks, click on Next / Previous arrows or select different range: 0 - 25 , 25 - 50 , 50 - 75 , 75 - 100 , 100 - 125 , 125 - 150 , 150 - 175 , 175 - 200 , 200 - 225 | ||
 | Click To Change The Sort Order: By Market Cap or Company Size Performance: Year-to-date, Week and Day |  |
| Detailed Overview Of Latin America Stocks |
| Latin America Technical Overview, Leaders & Laggards, Top Latin America ETF Funds & Detailed Latin America Stocks List, Charts, Trends & More |
| Latin America: Technical Analysis, Trends & YTD Performance | |
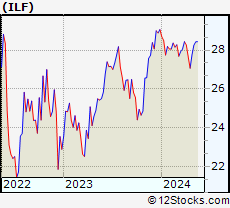
 ILF Weekly Chart |
|
| Long Term Trend: Not Good | |
| Medium Term Trend: Very Good | |
 ILF Daily Chart |
|
| Short Term Trend: Deteriorating | |
| Overall Trend Score: 35 | |
| YTD Performance: -5.54% | |
| **Trend Scores & Views Are Only For Educational Purposes And Not For Investing | |
| 12Stocks.com: Investing in Latin America Index using Exchange Traded Funds | |
|
The following table shows list of key exchange traded funds (ETF) that
help investors play Latin America stock market. For detailed view, check out our ETF Funds section of our website. Quick View: Move mouse or cursor over ETF symbol (ticker) to view short-term technical chart and over ETF name to view long term chart. Click on ticker or stock name for detailed view. Click on to add stock symbol to your watchlist and to view watchlist. |
12Stocks.com List of ETFs that track Latin America Index
| Ticker | ETF Name | Watchlist | Recent Price | Market Intelligence Score | Change % | Week % | Year-to-date % |
| ILF | Latin America 40 | | 27.45 | 35 | 0.26 | -1.12 | -5.54% |
| EWC | Canada | | 36.94 | 39 | 0.05 | -1.83 | 0.71% |
| FLN | Latin America AlphaDEX | | 19.48 | 17 | 0.23 | -1.09 | -6.33% |
| EWZ | Brazil | | 31.15 | 57 | 0.39 | -1.24 | -10.9% |
| EWW | Mexico | | 65.93 | 51 | 0.69 | -1.38 | -2.83% |
| ARGT | Argentina | | 57.42 | 37 | 0.00 | 1.94 | 11.84% |
| EWZS | Brazil Small-Cap | | 13.23 | 24 | 0.92 | -1.78 | -12.15% |
| BRF | Brazil Small-Cap | | 15.00 | 7 | -0.27 | -2.91 | -14.71% |
| BZQ | Short Brazil | | 12.29 | 81 | -1.21 | 1.82 | 22.53% |
| BRZU | Brazil Bull 3X | | 79.04 | 17 | 1.26 | -1.94 | -23.17% |
| FBZ | Brazil AlphaDEX | | 11.22 | 15 | -0.10 | -2.18 | -8.2% |
| 12Stocks.com: Charts, Trends, Fundamental Data and Performances of Latin America Stocks | |
|
We now take in-depth look at all Latin America stocks including charts, multi-period performances and overall trends (as measured by market intelligence score). One can sort Latin America stocks (click link to choose) by Daily, Weekly and by Year-to-Date performances. Also, one can sort by size of the company or by market capitalization. |
| Select Your Default Chart Type: | |||||
| |||||
| Click on stock symbol or name for detailed view. Click on to add stock symbol to your watchlist and to view watchlist. Quick View: Move mouse or cursor over "Daily" to quickly view daily technical stock chart and over "Weekly" to view weekly technical stock chart. | |||||

 | BAM Brookfield Asset Management Inc. |
| Sector: Financials | |
| SubSector: Real Estate Development | |
| MarketCap: 47134.9 Millions | |
| Recent Price: 38.19 Market Intelligence Score: 0 | |
| Day Percent Change: 0.00% Day Change: 0.00 | |
| Week Change: -3.8% Year-to-date Change: -4.9% | |
| BAM Links: Profile News Message Board | |
| Charts:- Daily , Weekly | |
| Add BAM to Watchlist: View: Get Complete BAM Trend Analysis ➞ | |
 | WPRT Westport Fuel Systems Inc. |
| Sector: Consumer Staples | |
| SubSector: Auto Parts | |
| MarketCap: 108.939 Millions | |
| Recent Price: 5.21 Market Intelligence Score: 0 | |
| Day Percent Change: -7.13% Day Change: -0.40 | |
| Week Change: -7.95% Year-to-date Change: -21.3% | |
| WPRT Links: Profile News Message Board | |
| Charts:- Daily , Weekly | |
| Add WPRT to Watchlist: View: Get Complete WPRT Trend Analysis ➞ | |
 | BLCO Bausch + Lomb Corporation |
| Sector: Health Care | |
| SubSector: Medical Instruments & Supplies | |
| MarketCap: 7100 Millions | |
| Recent Price: 14.13 Market Intelligence Score: 0 | |
| Day Percent Change: -2.85% Day Change: -0.41 | |
| Week Change: -4.5% Year-to-date Change: -16.9% | |
| BLCO Links: Profile News Message Board | |
| Charts:- Daily , Weekly | |
| Add BLCO to Watchlist: View: Get Complete BLCO Trend Analysis ➞ | |
 | MOGO Mogo Inc. |
| Sector: Financials | |
| SubSector: Credit Services | |
| MarketCap: 21.9208 Millions | |
| Recent Price: 1.83 Market Intelligence Score: 0 | |
| Day Percent Change: -1.88% Day Change: -0.03 | |
| Week Change: -2.14% Year-to-date Change: -1.1% | |
| MOGO Links: Profile News Message Board | |
| Charts:- Daily , Weekly | |
| Add MOGO to Watchlist: View: Get Complete MOGO Trend Analysis ➞ | |
 | GIB CGI Inc. |
| Sector: Technology | |
| SubSector: Information Technology Services | |
| MarketCap: 13185.3 Millions | |
| Recent Price: 99.41 Market Intelligence Score: 0 | |
| Day Percent Change: -1.79% Day Change: -1.81 | |
| Week Change: -3.62% Year-to-date Change: -7.3% | |
| GIB Links: Profile News Message Board | |
| Charts:- Daily , Weekly | |
| Add GIB to Watchlist: View: Get Complete GIB Trend Analysis ➞ | |
 | BIOX Bioceres Crop Solutions Corp. |
| Sector: Industrials | |
| SubSector: Conglomerates | |
| MarketCap: 198.348 Millions | |
| Recent Price: 11.63 Market Intelligence Score: 0 | |
| Day Percent Change: -1.48% Day Change: -0.18 | |
| Week Change: -3.53% Year-to-date Change: -15.3% | |
| BIOX Links: Profile News Message Board | |
| Charts:- Daily , Weekly | |
| Add BIOX to Watchlist: View: Get Complete BIOX Trend Analysis ➞ | |
 | CP Canadian Pacific Railway Limited |
| Sector: Transports | |
| SubSector: Railroads | |
| MarketCap: 25428.5 Millions | |
| Recent Price: 77.57 Market Intelligence Score: 0 | |
| Day Percent Change: -1.10% Day Change: -0.86 | |
| Week Change: -5.03% Year-to-date Change: -1.9% | |
| CP Links: Profile News Message Board | |
| Charts:- Daily , Weekly | |
| Add CP to Watchlist: View: Get Complete CP Trend Analysis ➞ | |
 | TMQ Trilogy Metals Inc. |
| Sector: Materials | |
| SubSector: Industrial Metals & Minerals | |
| MarketCap: 151.21 Millions | |
| Recent Price: 0.40 Market Intelligence Score: 0 | |
| Day Percent Change: -0.52% Day Change: 0.00 | |
| Week Change: -2.41% Year-to-date Change: -7.0% | |
| TMQ Links: Profile News Message Board | |
| Charts:- Daily , Weekly | |
| Add TMQ to Watchlist: View: Get Complete TMQ Trend Analysis ➞ | |
 | CNI Canadian National Railway Company |
| Sector: Transports | |
| SubSector: Railroads | |
| MarketCap: 54114.1 Millions | |
| Recent Price: 121.01 Market Intelligence Score: 0 | |
| Day Percent Change: -0.35% Day Change: -0.43 | |
| Week Change: -3.37% Year-to-date Change: -3.7% | |
| CNI Links: Profile News Message Board | |
| Charts:- Daily , Weekly | |
| Add CNI to Watchlist: View: Get Complete CNI Trend Analysis ➞ | |
 | RBA Ritchie Bros. Auctioneers Incorporated |
| Sector: Services & Goods | |
| SubSector: Business Services | |
| MarketCap: 3491.02 Millions | |
| Recent Price: 71.37 Market Intelligence Score: 0 | |
| Day Percent Change: -0.29% Day Change: -0.21 | |
| Week Change: -2.47% Year-to-date Change: 6.7% | |
| RBA Links: Profile News Message Board | |
| Charts:- Daily , Weekly | |
| Add RBA to Watchlist: View: Get Complete RBA Trend Analysis ➞ | |
| To view more stocks, click on Next / Previous arrows or select different range: 0 - 25 , 25 - 50 , 50 - 75 , 75 - 100 , 100 - 125 , 125 - 150 , 150 - 175 , 175 - 200 , 200 - 225 | ||
| Click To Change The Sort Order: By Market Cap or Company Size Performance: Year-to-date, Week and Day | |
| Select Chart Type: | ||
 Best Stocks Today 12Stocks.com |
© 2024 12Stocks.com Terms & Conditions Privacy Contact Us
All Information Provided Only For Education And Not To Be Used For Investing or Trading. See Terms & Conditions


One More Thing ... Get Best Stocks Delivered Daily!
Never Ever Miss A Move With Our Top Ten Stocks Lists
Find Best Stocks In Any Market - Bull or Bear Market
Take A Peek At Our Top Ten Stocks Lists: Daily, Weekly, Year-to-Date & Top Trends
Find Best Stocks In Any Market - Bull or Bear Market
Take A Peek At Our Top Ten Stocks Lists: Daily, Weekly, Year-to-Date & Top Trends
Latin America Stocks With Best Up Trends [0-bearish to 100-bullish]: Brookfield Renewable[100], New Gold[100], Transportadora de[100], CAE [100], Descartes Systems[100], Mercer [100], City Office[100], Grupo Financiero[100], Algonquin Power[95], Sandstorm Gold[95], YPF Sociedad[95]
Best Latin America Stocks Year-to-Date:
Aurora Cannabis[1443.47%], Canopy Growth[124.27%], Fusion [123.13%], Banco Macro[90.49%], Grupo Financiero[87.43%], Banco BBVA[77.94%], D-Wave Quantum[60.7%], McEwen Mining[60.19%], Grupo Supervielle[58.37%], Hudbay Minerals[50.91%], OrganiGram [45.8%] Best Latin America Stocks This Week:
Canopy Growth[28.62%], Tilray [12.92%], Aurora Cannabis[9.7%], Brookfield Renewable[9.18%], Canadian Solar[7.92%], Transportadora de[7.67%], Grupo Supervielle[6.63%], Banco Macro[6.4%], Xenon [6.16%], Zymeworks [6.05%], Aurinia [6.01%] Best Latin America Stocks Daily:
Brookfield Renewable[10.90%], New Gold[8.62%], Repare [7.74%], Lavoro [5.27%], NovaGold Resources[4.48%], Lion Electric[4.44%], Fortuna Silver[3.30%], Denison Mines[3.03%], Transportadora de[2.96%], D-Wave Quantum[2.92%], Cameco [2.83%]