
 Login Sign Up


| |||||
 |  | ||||

| 12Stocks.com Market Intelligence |
Best Healthcare Stocks
 | "Discover best trending healthcare stocks with 12Stocks.com." |
| - Subu Vdaygiri, Founder, 12Stocks.com |
| In a hurry? Healthcare Stocks Lists: Performance Trends Table, Stock Charts
Sort Healthcare stocks: Daily, Weekly, Year-to-Date, Market Cap & Trends. Filter Healthcare stocks list by size:All Healthcare Large Mid-Range Small |
| 12Stocks.com Healthcare Stocks Performances & Trends Daily | |||||||||
|
|  The overall Smart Investing & Trading Score is 38 (0-bearish to 100-bullish) which puts Healthcare sector in short term bearish to neutral trend. The Smart Investing & Trading Score from previous trading session is 52 and hence a deterioration of trend.
| ||||||||
Here are the Smart Investing & Trading Scores of the most requested Healthcare stocks at 12Stocks.com (click stock name for detailed review):
|


| 12Stocks.com: Investing in Healthcare sector with Stocks | |
|
The following table helps investors and traders sort through current performance and trends (as measured by Smart Investing & Trading Score) of various
stocks in the Healthcare sector. Quick View: Move mouse or cursor over stock symbol (ticker) to view short-term Technical chart and over stock name to view long term chart. Click on  to add stock symbol to your watchlist and to add stock symbol to your watchlist and  to view watchlist. Click on any ticker or stock name for detailed market intelligence report for that stock. to view watchlist. Click on any ticker or stock name for detailed market intelligence report for that stock. |
12Stocks.com Performance of Stocks in Healthcare Sector
| Ticker | Stock Name | Watchlist | Category | Recent Price | Smart Investing & Trading Score | Change % | Weekly Change% |
| PROK | ProKidney |   | Biotechnology | 2.71 | 68 | 7.75% | 32.84% |
| TNDM | Tandem Diabetes | | Instruments | 35.56 | 100 | 1.25% | 16.86% |
| HCM | Hutchison China | | Pharmaceutical | 18.99 | 85 | 3.15% | 15.16% |
| ZLAB | Zai Lab | | Biotechnology | 15.74 | 22 | 0.51% | 11.79% |
| OSCR | Oscar Health | | Healthcare Plans | 17.89 | 90 | 2.58% | 11.74% |
| SANA | Sana Biotechnology | | Biotechnology | 8.50 | 63 | 4.68% | 11.70% |
| TWST | Twist Bioscience | | Laboratories | 31.05 | 27 | 0.98% | 11.21% |
| SWTX | SpringWorks | | Biotechnology | 44.17 | 30 | 1.82% | 10.22% |
| SRPT | Sarepta | | Biotechnology | 127.39 | 75 | 2.53% | 10.18% |
| CGC | Canopy Growth | | Pharmaceutical | 8.69 | 80 | -3.12% | 9.45% |
| AMRX | Amneal | | Pharmaceutical | 5.92 | 37 | -2.15% | 9.23% |
| ADPT | Adaptive Biotechnologies | | Biotechnology | 2.61 | 55 | 0.38% | 8.75% |
| HAE | Haemonetics | | Instruments | 87.66 | 100 | 1.67% | 7.90% |
| LFST | LifeStance Health | | Medical Care Facilities | 6.16 | 75 | 3.18% | 7.88% |
| AGIO | Agios | | Biotechnology | 31.67 | 100 | 0.00% | 7.25% |
| GPCR | Structure | | Biotechnology | 38.98 | 27 | 8.13% | 7.21% |
| NTRA | Natera | | Laboratories | 91.28 | 61 | -0.24% | 7.04% |
| GH | Guardant Health | | Laboratories | 17.16 | 30 | -5.19% | 6.72% |
| RXRX | Recursion | | Biotechnology | 7.84 | 25 | -1.38% | 6.67% |
| NKTR | Nektar | | Biotechnology | 1.32 | 78 | -4.35% | 6.45% |
| IGMS | IGM Biosciences | | Biotechnology | 7.62 | 15 | -4.27% | 5.83% |
| WRBY | Warby Parker | | Instruments | 12.75 | 74 | -2.67% | 5.81% |
| CRON | Cronos | | Biotechnology | 2.50 | 53 | 0.81% | 5.49% |
| OLK | Olink Holding | | Diagnostics & Research | 23.07 | 42 | 2.62% | 5.49% |
| RGEN | Repligen | | Biotechnology | 165.66 | 35 | -1.31% | 5.42% |
| For chart view version of above stock list: Chart View ➞ 0 - 25 , 25 - 50 , 50 - 75 , 75 - 100 , 100 - 125 , 125 - 150 , 150 - 175 | ||
 | Click To Change The Sort Order: By Market Cap or Company Size Performance: Year-to-date, Week and Day |  |
|
Get the most comprehensive stock market coverage daily at 12Stocks.com ➞ Best Stocks Today ➞ Best Stocks Weekly ➞ Best Stocks Year-to-Date ➞ Best Stocks Trends ➞  Best Stocks Today 12Stocks.com Best Nasdaq Stocks ➞ Best S&P 500 Stocks ➞ Best Tech Stocks ➞ Best Biotech Stocks ➞ |
| Detailed Overview of Healthcare Stocks |
| Healthcare Technical Overview, Leaders & Laggards, Top Healthcare ETF Funds & Detailed Healthcare Stocks List, Charts, Trends & More |
| Healthcare Sector: Technical Analysis, Trends & YTD Performance | |
| Healthcare sector is composed of stocks
from pharmaceutical, biotech, diagnostics labs, insurance providers
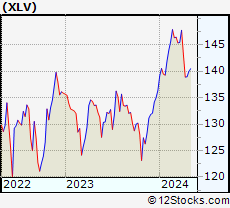
and healthcare services. Healthcare sector, as represented by XLV, an exchange-traded fund [ETF] that holds basket of Healthcare stocks (e.g, Merck, Amgen) is up by 2.6% and is currently underperforming the overall market by -2.56% year-to-date. Below is a quick view of Technical charts and trends: |
|
 XLV Weekly Chart |
|
| Long Term Trend: Not Good | |
| Medium Term Trend: Not Good | |
 XLV Daily Chart |
|
| Short Term Trend: Very Good | |
| Overall Trend Score: 38 | |
| YTD Performance: 2.6% | |
| **Trend Scores & Views Are Only For Educational Purposes And Not For Investing | |
| 12Stocks.com: Top Performing Healthcare Sector Stocks | ||||||||||||||||||||||||||||||||||||||||||||||||
 The top performing Healthcare sector stocks year to date are
Now, more recently, over last week, the top performing Healthcare sector stocks on the move are


|
||||||||||||||||||||||||||||||||||||||||||||||||
| 12Stocks.com: Investing in Healthcare Sector using Exchange Traded Funds | |
|
The following table shows list of key exchange traded funds (ETF) that
help investors track Healthcare Index. For detailed view, check out our ETF Funds section of our website. Quick View: Move mouse or cursor over ETF symbol (ticker) to view short-term Technical chart and over ETF name to view long term chart. Click on ticker or stock name for detailed view. Click on to add stock symbol to your watchlist and to view watchlist. |
12Stocks.com List of ETFs that track Healthcare Index
| Ticker | ETF Name | Watchlist | Recent Price | Smart Investing & Trading Score | Change % | Week % | Year-to-date % |
| XLV | Health Care | | 139.92 | 38 | -0.67 | 0.7 | 2.6% |
| XBI | Biotech | | 82.22 | 25 | -2.05 | -0.74 | -7.92% |
| IBB | Biotechnology | | 125.67 | 18 | -1.64 | 0.76 | -7.49% |
| BBH | Biotech | | 154.61 | 49 | -1.73 | 1.48 | -6.47% |
| VHT | Health Care | | 255.24 | 45 | -0.79 | 0.75 | 1.81% |
| IYH | Healthcare | | 58.68 | 45 | -0.69 | 0.89 | 2.5% |
| IHF | Healthcare Providers | | 52.11 | 55 | -0.29 | -0.19 | -0.76% |
| IHI | Medical Devices | | 55.27 | 43 | -0.66 | 1.67 | 2.41% |
| BIB | Biotechnology | | 48.83 | 32 | -2.69 | 1.31 | -14.41% |
| BIS | Short Biotech | | 20.59 | 61 | 2.49 | -1.46 | 13.95% |
| XHE | Health Care Equipment | | 81.77 | 28 | -1.73 | 0.62 | -2.96% |
| CURE | Healthcare Bull 3X | | 105.32 | 25 | -2.35 | 1.92 | 3.52% |
| LABU | Biotech Bull 3X | | 83.72 | 25 | -6.35 | -2.71 | -31.36% |
| LABD | Biotech Bear 3X | | 11.03 | 75 | 6.36 | 2.13 | 13.83% |
| PSCH | SmallCap Health Care | | 40.31 | 35 | -1.98 | 0.32 | -5.82% |
| XHS | Health Care Services | | 87.68 | 68 | -1.15 | 0.68 | -1.43% |
| PTH | DWA Healthcare Momentum | | 39.60 | 46 | -0.08 | 0.18 | 1.18% |
| BTEC | Principal Healthcare Innovators | | 34.21 | 32 | 0.02 | 1.04 | -5.83% |
| RXL | Health Care | | 94.52 | 17 | -1.55 | 1.39 | 3.41% |
| RXD | Short Health Care | | 11.46 | 71 | 0.98 | -1.59 | -3.94% |
| 12Stocks.com: Charts, Trends, Fundamental Data and Performances of Healthcare Stocks | |
|
We now take in-depth look at all Healthcare stocks including charts, multi-period performances and overall trends (as measured by Smart Investing & Trading Score). One can sort Healthcare stocks (click link to choose) by Daily, Weekly and by Year-to-Date performances. Also, one can sort by size of the company or by market capitalization. |
| Select Your Default Chart Type: | |||||
| |||||
| Click on stock symbol or name for detailed view. Click on to add stock symbol to your watchlist and to view watchlist. Quick View: Move mouse or cursor over "Daily" to quickly view daily Technical stock chart and over "Weekly" to view weekly Technical stock chart. | |||||

 | PROK ProKidney Corp. |
| Sector: Health Care | |
| SubSector: Biotechnology | |
| MarketCap: 2470 Millions | |
| Recent Price: 2.71 Smart Investing & Trading Score: 68 | |
| Day Percent Change: 7.75% Day Change: 0.19 | |
| Week Change: 32.84% Year-to-date Change: 55.3% | |
| PROK Links: Profile News Message Board | |
| Charts:- Daily , Weekly | |
| Add PROK to Watchlist: View: Get Complete PROK Trend Analysis ➞ | |
 | TNDM Tandem Diabetes Care, Inc. |
| Sector: Health Care | |
| SubSector: Medical Instruments & Supplies | |
| MarketCap: 3359.1 Millions | |
| Recent Price: 35.56 Smart Investing & Trading Score: 100 | |
| Day Percent Change: 1.25% Day Change: 0.44 | |
| Week Change: 16.86% Year-to-date Change: 20.2% | |
| TNDM Links: Profile News Message Board | |
| Charts:- Daily , Weekly | |
| Add TNDM to Watchlist: View: Get Complete TNDM Trend Analysis ➞ | |
 | HCM Hutchison China MediTech Limited |
| Sector: Health Care | |
| SubSector: Drug Manufacturers - Major | |
| MarketCap: 2324.43 Millions | |
| Recent Price: 18.99 Smart Investing & Trading Score: 85 | |
| Day Percent Change: 3.15% Day Change: 0.58 | |
| Week Change: 15.16% Year-to-date Change: 4.9% | |
| HCM Links: Profile News Message Board | |
| Charts:- Daily , Weekly | |
| Add HCM to Watchlist: View: Get Complete HCM Trend Analysis ➞ | |
 | ZLAB Zai Lab Limited |
| Sector: Health Care | |
| SubSector: Biotechnology | |
| MarketCap: 3970.35 Millions | |
| Recent Price: 15.74 Smart Investing & Trading Score: 22 | |
| Day Percent Change: 0.51% Day Change: 0.08 | |
| Week Change: 11.79% Year-to-date Change: -42.4% | |
| ZLAB Links: Profile News Message Board | |
| Charts:- Daily , Weekly | |
| Add ZLAB to Watchlist: View: Get Complete ZLAB Trend Analysis ➞ | |
 | OSCR Oscar Health, Inc. |
| Sector: Health Care | |
| SubSector: Healthcare Plans | |
| MarketCap: 1790 Millions | |
| Recent Price: 17.89 Smart Investing & Trading Score: 90 | |
| Day Percent Change: 2.58% Day Change: 0.45 | |
| Week Change: 11.74% Year-to-date Change: 96.5% | |
| OSCR Links: Profile News Message Board | |
| Charts:- Daily , Weekly | |
| Add OSCR to Watchlist: View: Get Complete OSCR Trend Analysis ➞ | |
 | SANA Sana Biotechnology, Inc. |
| Sector: Health Care | |
| SubSector: Biotechnology | |
| MarketCap: 1210 Millions | |
| Recent Price: 8.50 Smart Investing & Trading Score: 63 | |
| Day Percent Change: 4.68% Day Change: 0.38 | |
| Week Change: 11.7% Year-to-date Change: 105.6% | |
| SANA Links: Profile News Message Board | |
| Charts:- Daily , Weekly | |
| Add SANA to Watchlist: View: Get Complete SANA Trend Analysis ➞ | |
 | TWST Twist Bioscience Corporation |
| Sector: Health Care | |
| SubSector: Medical Laboratories & Research | |
| MarketCap: 1065 Millions | |
| Recent Price: 31.05 Smart Investing & Trading Score: 27 | |
| Day Percent Change: 0.98% Day Change: 0.30 | |
| Week Change: 11.21% Year-to-date Change: -15.8% | |
| TWST Links: Profile News Message Board | |
| Charts:- Daily , Weekly | |
| Add TWST to Watchlist: View: Get Complete TWST Trend Analysis ➞ | |
 | SWTX SpringWorks Therapeutics, Inc. |
| Sector: Health Care | |
| SubSector: Biotechnology | |
| MarketCap: 1311.85 Millions | |
| Recent Price: 44.17 Smart Investing & Trading Score: 30 | |
| Day Percent Change: 1.82% Day Change: 0.79 | |
| Week Change: 10.22% Year-to-date Change: 21.0% | |
| SWTX Links: Profile News Message Board | |
| Charts:- Daily , Weekly | |
| Add SWTX to Watchlist: View: Get Complete SWTX Trend Analysis ➞ | |
 | SRPT Sarepta Therapeutics, Inc. |
| Sector: Health Care | |
| SubSector: Biotechnology | |
| MarketCap: 7388.05 Millions | |
| Recent Price: 127.39 Smart Investing & Trading Score: 75 | |
| Day Percent Change: 2.53% Day Change: 3.14 | |
| Week Change: 10.18% Year-to-date Change: 32.1% | |
| SRPT Links: Profile News Message Board | |
| Charts:- Daily , Weekly | |
| Add SRPT to Watchlist: View: Get Complete SRPT Trend Analysis ➞ | |
 | CGC Canopy Growth Corporation |
| Sector: Health Care | |
| SubSector: Drug Manufacturers - Other | |
| MarketCap: 4136.33 Millions | |
| Recent Price: 8.69 Smart Investing & Trading Score: 80 | |
| Day Percent Change: -3.12% Day Change: -0.28 | |
| Week Change: 9.45% Year-to-date Change: 70.1% | |
| CGC Links: Profile News Message Board | |
| Charts:- Daily , Weekly | |
| Add CGC to Watchlist: View: Get Complete CGC Trend Analysis ➞ | |
 | AMRX Amneal Pharmaceuticals, Inc. |
| Sector: Health Care | |
| SubSector: Drug Related Products | |
| MarketCap: 1218.13 Millions | |
| Recent Price: 5.92 Smart Investing & Trading Score: 37 | |
| Day Percent Change: -2.15% Day Change: -0.13 | |
| Week Change: 9.23% Year-to-date Change: -2.5% | |
| AMRX Links: Profile News Message Board | |
| Charts:- Daily , Weekly | |
| Add AMRX to Watchlist: View: Get Complete AMRX Trend Analysis ➞ | |
 | ADPT Adaptive Biotechnologies Corporation |
| Sector: Health Care | |
| SubSector: Biotechnology | |
| MarketCap: 3525.75 Millions | |
| Recent Price: 2.61 Smart Investing & Trading Score: 55 | |
| Day Percent Change: 0.38% Day Change: 0.01 | |
| Week Change: 8.75% Year-to-date Change: -46.7% | |
| ADPT Links: Profile News Message Board | |
| Charts:- Daily , Weekly | |
| Add ADPT to Watchlist: View: Get Complete ADPT Trend Analysis ➞ | |
 | HAE Haemonetics Corporation |
| Sector: Health Care | |
| SubSector: Medical Instruments & Supplies | |
| MarketCap: 4500.7 Millions | |
| Recent Price: 87.66 Smart Investing & Trading Score: 100 | |
| Day Percent Change: 1.67% Day Change: 1.44 | |
| Week Change: 7.9% Year-to-date Change: 2.5% | |
| HAE Links: Profile News Message Board | |
| Charts:- Daily , Weekly | |
| Add HAE to Watchlist: View: Get Complete HAE Trend Analysis ➞ | |
 | LFST LifeStance Health Group, Inc. |
| Sector: Health Care | |
| SubSector: Medical Care Facilities | |
| MarketCap: 3460 Millions | |
| Recent Price: 6.16 Smart Investing & Trading Score: 75 | |
| Day Percent Change: 3.18% Day Change: 0.19 | |
| Week Change: 7.88% Year-to-date Change: -22.2% | |
| LFST Links: Profile News Message Board | |
| Charts:- Daily , Weekly | |
| Add LFST to Watchlist: View: Get Complete LFST Trend Analysis ➞ | |
 | AGIO Agios Pharmaceuticals, Inc. |
| Sector: Health Care | |
| SubSector: Biotechnology | |
| MarketCap: 2613.35 Millions | |
| Recent Price: 31.67 Smart Investing & Trading Score: 100 | |
| Day Percent Change: 0.00% Day Change: 0.00 | |
| Week Change: 7.25% Year-to-date Change: 42.2% | |
| AGIO Links: Profile News Message Board | |
| Charts:- Daily , Weekly | |
| Add AGIO to Watchlist: View: Get Complete AGIO Trend Analysis ➞ | |
 | GPCR Structure Therapeutics Inc. |
| Sector: Health Care | |
| SubSector: Biotechnology | |
| MarketCap: 1530 Millions | |
| Recent Price: 38.98 Smart Investing & Trading Score: 27 | |
| Day Percent Change: 8.13% Day Change: 2.93 | |
| Week Change: 7.21% Year-to-date Change: 2.4% | |
| GPCR Links: Profile News Message Board | |
| Charts:- Daily , Weekly | |
| Add GPCR to Watchlist: View: Get Complete GPCR Trend Analysis ➞ | |
 | NTRA Natera, Inc. |
| Sector: Health Care | |
| SubSector: Medical Laboratories & Research | |
| MarketCap: 2152.1 Millions | |
| Recent Price: 91.28 Smart Investing & Trading Score: 61 | |
| Day Percent Change: -0.24% Day Change: -0.22 | |
| Week Change: 7.04% Year-to-date Change: 45.7% | |
| NTRA Links: Profile News Message Board | |
| Charts:- Daily , Weekly | |
| Add NTRA to Watchlist: View: Get Complete NTRA Trend Analysis ➞ | |
 | GH Guardant Health, Inc. |
| Sector: Health Care | |
| SubSector: Medical Laboratories & Research | |
| MarketCap: 5678.7 Millions | |
| Recent Price: 17.16 Smart Investing & Trading Score: 30 | |
| Day Percent Change: -5.19% Day Change: -0.94 | |
| Week Change: 6.72% Year-to-date Change: -36.6% | |
| GH Links: Profile News Message Board | |
| Charts:- Daily , Weekly | |
| Add GH to Watchlist: View: Get Complete GH Trend Analysis ➞ | |
 | RXRX Recursion Pharmaceuticals, Inc. |
| Sector: Health Care | |
| SubSector: Biotechnology | |
| MarketCap: 1470 Millions | |
| Recent Price: 7.84 Smart Investing & Trading Score: 25 | |
| Day Percent Change: -1.38% Day Change: -0.11 | |
| Week Change: 6.67% Year-to-date Change: -19.9% | |
| RXRX Links: Profile News Message Board | |
| Charts:- Daily , Weekly | |
| Add RXRX to Watchlist: View: Get Complete RXRX Trend Analysis ➞ | |
 | NKTR Nektar Therapeutics |
| Sector: Health Care | |
| SubSector: Biotechnology | |
| MarketCap: 2953.45 Millions | |
| Recent Price: 1.32 Smart Investing & Trading Score: 78 | |
| Day Percent Change: -4.35% Day Change: -0.06 | |
| Week Change: 6.45% Year-to-date Change: 133.6% | |
| NKTR Links: Profile News Message Board | |
| Charts:- Daily , Weekly | |
| Add NKTR to Watchlist: View: Get Complete NKTR Trend Analysis ➞ | |
 | IGMS IGM Biosciences, Inc. |
| Sector: Health Care | |
| SubSector: Biotechnology | |
| MarketCap: 2000.05 Millions | |
| Recent Price: 7.62 Smart Investing & Trading Score: 15 | |
| Day Percent Change: -4.27% Day Change: -0.34 | |
| Week Change: 5.83% Year-to-date Change: -8.3% | |
| IGMS Links: Profile News Message Board | |
| Charts:- Daily , Weekly | |
| Add IGMS to Watchlist: View: Get Complete IGMS Trend Analysis ➞ | |
 | WRBY Warby Parker Inc. |
| Sector: Health Care | |
| SubSector: Medical Instruments & Supplies | |
| MarketCap: 1380 Millions | |
| Recent Price: 12.75 Smart Investing & Trading Score: 74 | |
| Day Percent Change: -2.67% Day Change: -0.35 | |
| Week Change: 5.81% Year-to-date Change: -9.6% | |
| WRBY Links: Profile News Message Board | |
| Charts:- Daily , Weekly | |
| Add WRBY to Watchlist: View: Get Complete WRBY Trend Analysis ➞ | |
 | CRON Cronos Group Inc. |
| Sector: Health Care | |
| SubSector: Biotechnology | |
| MarketCap: 1935.95 Millions | |
| Recent Price: 2.50 Smart Investing & Trading Score: 53 | |
| Day Percent Change: 0.81% Day Change: 0.02 | |
| Week Change: 5.49% Year-to-date Change: 19.6% | |
| CRON Links: Profile News Message Board | |
| Charts:- Daily , Weekly | |
| Add CRON to Watchlist: View: Get Complete CRON Trend Analysis ➞ | |
 | OLK Olink Holding AB (publ) |
| Sector: Health Care | |
| SubSector: Diagnostics & Research | |
| MarketCap: 2370 Millions | |
| Recent Price: 23.07 Smart Investing & Trading Score: 42 | |
| Day Percent Change: 2.62% Day Change: 0.59 | |
| Week Change: 5.49% Year-to-date Change: -8.4% | |
| OLK Links: Profile News Message Board | |
| Charts:- Daily , Weekly | |
| Add OLK to Watchlist: View: Get Complete OLK Trend Analysis ➞ | |
 | RGEN Repligen Corporation |
| Sector: Health Care | |
| SubSector: Biotechnology | |
| MarketCap: 4711.75 Millions | |
| Recent Price: 165.66 Smart Investing & Trading Score: 35 | |
| Day Percent Change: -1.31% Day Change: -2.20 | |
| Week Change: 5.42% Year-to-date Change: -7.9% | |
| RGEN Links: Profile News Message Board | |
| Charts:- Daily , Weekly | |
| Add RGEN to Watchlist: View: Get Complete RGEN Trend Analysis ➞ | |
| For tabular summary view of above stock list: Summary View ➞ 0 - 25 , 25 - 50 , 50 - 75 , 75 - 100 , 100 - 125 , 125 - 150 , 150 - 175 | ||
| Click To Change The Sort Order: By Market Cap or Company Size Performance: Year-to-date, Week and Day | |
| Select Chart Type: | ||
|
Best Stocks Today 12Stocks.com |
© 2024 12Stocks.com Terms & Conditions Privacy Contact Us
All Information Provided Only For Education And Not To Be Used For Investing or Trading. See Terms & Conditions


One More Thing ... Get Best Stocks Delivered Daily!
Never Ever Miss A Move With Our Top Ten Stocks Lists
Find Best Stocks In Any Market - Bull or Bear Market
Take A Peek At Our Top Ten Stocks Lists: Daily, Weekly, Year-to-Date & Top Trends
Find Best Stocks In Any Market - Bull or Bear Market
Take A Peek At Our Top Ten Stocks Lists: Daily, Weekly, Year-to-Date & Top Trends
Healthcare Stocks With Best Up Trends [0-bearish to 100-bullish]: AstraZeneca [100], Merck [100], Annovis Bio[100], Haemonetics [100], Tandem Diabetes[100], Boston Scientific[100], Agios [100], Agenus [95], Mesoblast [95], Cullinan Oncology[93], Avadel [93]
Best Healthcare Stocks Year-to-Date:
Pieris [6273.63%], Precision BioSciences[2590.41%], Inovio [1885.29%], Assembly Biosciences[1529.07%], Aurora Cannabis[1311.17%], NuCana [1198.17%], Adverum Biotechnologies[1147.34%], Agenus [902.54%], Affimed N.V[680.8%], CareMax [490.72%], Mesoblast [459.09%] Best Healthcare Stocks This Week:
Pieris [7900%], Agenus [56.31%], VolitionRx [44.5%], ProKidney [32.84%], Seres [32.65%], Annovis Bio[30%], BeyondSpring [26.11%], Cullinan Oncology[22.92%], Pharvaris N.V[18.84%], OptiNose [18.42%], GeneDx [18.15%] Best Healthcare Stocks Daily:
OptiNose [14.56%], Galera [13.74%], Agenus [11.86%], VolitionRx [11.26%], ADiTx [10.57%], Apollomics [9.94%], Pharming [9.06%], Structure [8.13%], Pharvaris N.V[7.91%], ProKidney [7.75%], Community Health[7.26%]