
 Login Sign Up


| |||||
 |  | ||||

| 12Stocks.com Market Intelligence |
Best Healthcare Stocks
 | "Discover best trending healthcare stocks with 12Stocks.com." |
| - Subu Vdaygiri, Founder, 12Stocks.com |
| In a hurry? Healthcare Stocks Lists: Performance Trends Table, Stock Charts
Sort Healthcare stocks: Daily, Weekly, Year-to-Date, Market Cap & Trends. Filter Healthcare stocks list by size:All Healthcare Large Mid-Range Small |
| 12Stocks.com Healthcare Stocks Performances & Trends Daily | |||||||||
|
|  The overall Smart Investing & Trading Score is 64 (0-bearish to 100-bullish) which puts Healthcare sector in short term neutral to bullish trend. The Smart Investing & Trading Score from previous trading session is 60 and hence an improvement of trend.
| ||||||||
Here are the Smart Investing & Trading Scores of the most requested Healthcare stocks at 12Stocks.com (click stock name for detailed review):
|


| 12Stocks.com: Investing in Healthcare sector with Stocks | |
|
The following table helps investors and traders sort through current performance and trends (as measured by Smart Investing & Trading Score) of various
stocks in the Healthcare sector. Quick View: Move mouse or cursor over stock symbol (ticker) to view short-term Technical chart and over stock name to view long term chart. Click on  to add stock symbol to your watchlist and to add stock symbol to your watchlist and  to view watchlist. Click on any ticker or stock name for detailed market intelligence report for that stock. to view watchlist. Click on any ticker or stock name for detailed market intelligence report for that stock. |
12Stocks.com Performance of Stocks in Healthcare Sector
| Ticker | Stock Name | Watchlist | Category | Recent Price | Smart Investing & Trading Score | Change % | Weekly Change% |
| BEAT | BioTelemetry |   | Laboratories | 2.19 | 56 | 8.96% | 9.50% |
| STRO | Sutro Biopharma | | Biotechnology | 3.75 | 17 | 10.31% | 9.50% |
| INO | Inovio | | Biotechnology | 11.56 | 85 | 0.96% | 9.37% |
| AIH | Aesthetic | | Specialized | 0.47 | 52 | 4.44% | 9.28% |
| FDMT | 4D Molecular | | Biotechnology | 25.36 | 32 | 5.98% | 9.19% |
| NKTX | Nkarta | | Biotechnology | 7.50 | 25 | 12.28% | 9.17% |
| UTHR | United | | Biotechnology | 255.12 | 100 | 8.87% | 9.10% |
| ITOS | iTeos | | Biotechnology | 11.78 | 46 | 9.68% | 9.07% |
| IMUX | Immunic | | Biotechnology | 1.33 | 27 | 5.56% | 9.02% |
| MDGL | Madrigal | | Biotechnology | 210.69 | 27 | 3.27% | 8.98% |
| TNYA | Tenaya | | Biotechnology | 4.69 | 59 | 3.30% | 8.82% |
| OMGA | Omega | | Biotechnology | 2.47 | 49 | 10.76% | 8.81% |
| MLYS | Mineralys | | Biotechnology | 12.90 | 59 | 5.27% | 8.73% |
| BBIO | BridgeBio Pharma | | Biotechnology | 27.01 | 29 | 5.43% | 8.56% |
| ADCT | ADC | | Biotechnology | 4.71 | 38 | 6.80% | 8.53% |
| QSI | Quantum-Si | | Biotechnology | 1.79 | 42 | 11.18% | 8.48% |
| KYMR | Kymera | | Biotechnology | 36.20 | 37 | 7.66% | 8.47% |
| KNSA | Kiniksa | | Biotechnology | 19.39 | 44 | 3.55% | 8.42% |
| RYTM | Rhythm | | Biotechnology | 41.49 | 29 | 4.35% | 8.39% |
| NTLA | Intellia | | Biotechnology | 22.50 | 59 | 5.14% | 8.38% |
| CSTL | Castle Biosciences | | Laboratories | 22.03 | 100 | 4.46% | 8.31% |
| CMPX | Compass | | Biotechnology | 1.57 | 42 | 9.03% | 8.28% |
| KALA | Kala | | Biotechnology | 6.82 | 42 | 0.00% | 8.25% |
| NARI | Inari | | Medical Devices | 41.59 | 74 | 11.37% | 8.24% |
| CARA | Cara | | Biotechnology | 0.74 | 49 | -1.65% | 8.07% |
| For chart view version of above stock list: Chart View ➞ 0 - 25 , 25 - 50 , 50 - 75 , 75 - 100 , 100 - 125 , 125 - 150 , 150 - 175 , 175 - 200 , 200 - 225 , 225 - 250 , 250 - 275 , 275 - 300 , 300 - 325 , 325 - 350 , 350 - 375 , 375 - 400 , 400 - 425 , 425 - 450 , 450 - 475 , 475 - 500 , 500 - 525 , 525 - 550 , 550 - 575 , 575 - 600 , 600 - 625 , 625 - 650 , 650 - 675 , 675 - 700 , 700 - 725 | ||
 | Click To Change The Sort Order: By Market Cap or Company Size Performance: Year-to-date, Week and Day |  |
|
Get the most comprehensive stock market coverage daily at 12Stocks.com ➞ Best Stocks Today ➞ Best Stocks Weekly ➞ Best Stocks Year-to-Date ➞ Best Stocks Trends ➞  Best Stocks Today 12Stocks.com Best Nasdaq Stocks ➞ Best S&P 500 Stocks ➞ Best Tech Stocks ➞ Best Biotech Stocks ➞ |
| Detailed Overview of Healthcare Stocks |
| Healthcare Technical Overview, Leaders & Laggards, Top Healthcare ETF Funds & Detailed Healthcare Stocks List, Charts, Trends & More |
| Healthcare Sector: Technical Analysis, Trends & YTD Performance | |
| Healthcare sector is composed of stocks
from pharmaceutical, biotech, diagnostics labs, insurance providers
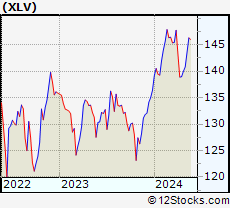
and healthcare services. Healthcare sector, as represented by XLV, an exchange-traded fund [ETF] that holds basket of Healthcare stocks (e.g, Merck, Amgen) is up by 3.08% and is currently underperforming the overall market by -1.46% year-to-date. Below is a quick view of Technical charts and trends: |
|
 XLV Weekly Chart |
|
| Long Term Trend: Not Good | |
| Medium Term Trend: Very Good | |
 XLV Daily Chart |
|
| Short Term Trend: Very Good | |
| Overall Trend Score: 64 | |
| YTD Performance: 3.08% | |
| **Trend Scores & Views Are Only For Educational Purposes And Not For Investing | |
| 12Stocks.com: Top Performing Healthcare Sector Stocks | ||||||||||||||||||||||||||||||||||||||||||||||||
 The top performing Healthcare sector stocks year to date are
Now, more recently, over last week, the top performing Healthcare sector stocks on the move are


|
||||||||||||||||||||||||||||||||||||||||||||||||
| 12Stocks.com: Investing in Healthcare Sector using Exchange Traded Funds | |
|
The following table shows list of key exchange traded funds (ETF) that
help investors track Healthcare Index. For detailed view, check out our ETF Funds section of our website. Quick View: Move mouse or cursor over ETF symbol (ticker) to view short-term Technical chart and over ETF name to view long term chart. Click on ticker or stock name for detailed view. Click on to add stock symbol to your watchlist and to view watchlist. |
12Stocks.com List of ETFs that track Healthcare Index
| Ticker | ETF Name | Watchlist | Recent Price | Smart Investing & Trading Score | Change % | Week % | Year-to-date % |
| XLV | Health Care | | 140.58 | 64 | 0.18 | 0.44 | 3.08% |
| XBI | Biotech | | 87.41 | 49 | 3.30 | 4.7 | -2.11% |
| IBB | Biotechnology | | 129.49 | 57 | 2.02 | 2.37 | -4.68% |
| BBH | Biotech | | 159.12 | 50 | 1.72 | 2.23 | -3.74% |
| VHT | Health Care | | 257.35 | 25 | 0.51 | 0.79 | 2.65% |
| IYH | Healthcare | | 59.18 | 57 | 0.59 | 0.97 | 3.37% |
| IHF | Healthcare Providers | | 51.44 | 33 | -0.77 | -0.92 | -2.04% |
| IHI | Medical Devices | | 55.06 | 7 | 0.08 | -0.86 | 2.01% |
| BIB | Biotechnology | | 51.42 | 57 | 2.13 | 3.54 | -9.87% |
| BIS | Short Biotech | | 18.82 | 63 | -5.14 | -6.92 | 4.15% |
| XHE | Health Care Equipment | | 83.77 | 24 | 2.02 | 1.62 | -0.59% |
| CURE | Healthcare Bull 3X | | 109.16 | 50 | 3.07 | 3.66 | 7.29% |
| LABU | Biotech Bull 3X | | 99.97 | 49 | 10.01 | 14.24 | -18.04% |
| LABD | Biotech Bear 3X | | 9.04 | 56 | -10.19 | -14.12 | -6.76% |
| PSCH | SmallCap Health Care | | 41.00 | 22 | 0.12 | 0.74 | -4.21% |
| XHS | Health Care Services | | 88.41 | 20 | -0.30 | 0.61 | -0.61% |
| PTH | DWA Healthcare Momentum | | 40.53 | 27 | 0.10 | 1.6 | 3.55% |
| BTEC | Principal Healthcare Innovators | | 34.74 | 7 | 0.26 | 1.43 | -4.38% |
| RXL | Health Care | | 95.32 | 64 | 0.34 | 0.52 | 4.29% |
| RXD | Short Health Care | | 11.32 | 71 | -0.39 | -1.17 | -5.11% |
| 12Stocks.com: Charts, Trends, Fundamental Data and Performances of Healthcare Stocks | |
|
We now take in-depth look at all Healthcare stocks including charts, multi-period performances and overall trends (as measured by Smart Investing & Trading Score). One can sort Healthcare stocks (click link to choose) by Daily, Weekly and by Year-to-Date performances. Also, one can sort by size of the company or by market capitalization. |
| Select Your Default Chart Type: | |||||
| |||||
| Click on stock symbol or name for detailed view. Click on to add stock symbol to your watchlist and to view watchlist. Quick View: Move mouse or cursor over "Daily" to quickly view daily Technical stock chart and over "Weekly" to view weekly Technical stock chart. | |||||

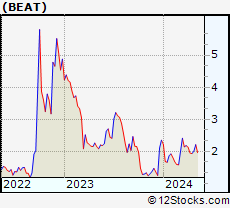 | BEAT BioTelemetry, Inc. |
| Sector: Health Care | |
| SubSector: Medical Laboratories & Research | |
| MarketCap: 1161.9 Millions | |
| Recent Price: 2.19 Smart Investing & Trading Score: 56 | |
| Day Percent Change: 8.96% Day Change: 0.18 | |
| Week Change: 9.5% Year-to-date Change: -6.8% | |
| BEAT Links: Profile News Message Board | |
| Charts:- Daily , Weekly | |
| Add BEAT to Watchlist: View: Get Complete BEAT Trend Analysis ➞ | |
 | STRO Sutro Biopharma, Inc. |
| Sector: Health Care | |
| SubSector: Biotechnology | |
| MarketCap: 196.485 Millions | |
| Recent Price: 3.75 Smart Investing & Trading Score: 17 | |
| Day Percent Change: 10.31% Day Change: 0.35 | |
| Week Change: 9.5% Year-to-date Change: -12.7% | |
| STRO Links: Profile News Message Board | |
| Charts:- Daily , Weekly | |
| Add STRO to Watchlist: View: Get Complete STRO Trend Analysis ➞ | |
 | INO Inovio Pharmaceuticals, Inc. |
| Sector: Health Care | |
| SubSector: Biotechnology | |
| MarketCap: 876.385 Millions | |
| Recent Price: 11.56 Smart Investing & Trading Score: 85 | |
| Day Percent Change: 0.96% Day Change: 0.11 | |
| Week Change: 9.37% Year-to-date Change: 2,166.7% | |
| INO Links: Profile News Message Board | |
| Charts:- Daily , Weekly | |
| Add INO to Watchlist: View: Get Complete INO Trend Analysis ➞ | |
 | AIH Aesthetic Medical International Holdings Group Limited |
| Sector: Health Care | |
| SubSector: Specialized Health Services | |
| MarketCap: 205.356 Millions | |
| Recent Price: 0.47 Smart Investing & Trading Score: 52 | |
| Day Percent Change: 4.44% Day Change: 0.02 | |
| Week Change: 9.28% Year-to-date Change: -31.8% | |
| AIH Links: Profile News Message Board | |
| Charts:- Daily , Weekly | |
| Add AIH to Watchlist: View: Get Complete AIH Trend Analysis ➞ | |
 | FDMT 4D Molecular Therapeutics, Inc. |
| Sector: Health Care | |
| SubSector: Biotechnology | |
| MarketCap: 772 Millions | |
| Recent Price: 25.36 Smart Investing & Trading Score: 32 | |
| Day Percent Change: 5.98% Day Change: 1.43 | |
| Week Change: 9.19% Year-to-date Change: 22.5% | |
| FDMT Links: Profile News Message Board | |
| Charts:- Daily , Weekly | |
| Add FDMT to Watchlist: View: Get Complete FDMT Trend Analysis ➞ | |
 | NKTX Nkarta, Inc. |
| Sector: Health Care | |
| SubSector: Biotechnology | |
| MarketCap: 23487 Millions | |
| Recent Price: 7.50 Smart Investing & Trading Score: 25 | |
| Day Percent Change: 12.28% Day Change: 0.82 | |
| Week Change: 9.17% Year-to-date Change: 13.7% | |
| NKTX Links: Profile News Message Board | |
| Charts:- Daily , Weekly | |
| Add NKTX to Watchlist: View: Get Complete NKTX Trend Analysis ➞ | |
 | UTHR United Therapeutics Corporation |
| Sector: Health Care | |
| SubSector: Biotechnology | |
| MarketCap: 3980.75 Millions | |
| Recent Price: 255.12 Smart Investing & Trading Score: 100 | |
| Day Percent Change: 8.87% Day Change: 20.79 | |
| Week Change: 9.1% Year-to-date Change: 16.0% | |
| UTHR Links: Profile News Message Board | |
| Charts:- Daily , Weekly | |
| Add UTHR to Watchlist: View: Get Complete UTHR Trend Analysis ➞ | |
 | ITOS iTeos Therapeutics, Inc. |
| Sector: Health Care | |
| SubSector: Biotechnology | |
| MarketCap: 10487 Millions | |
| Recent Price: 11.78 Smart Investing & Trading Score: 46 | |
| Day Percent Change: 9.68% Day Change: 1.04 | |
| Week Change: 9.07% Year-to-date Change: 7.7% | |
| ITOS Links: Profile News Message Board | |
| Charts:- Daily , Weekly | |
| Add ITOS to Watchlist: View: Get Complete ITOS Trend Analysis ➞ | |
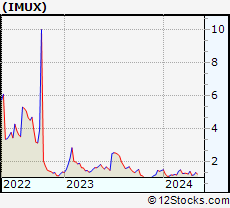 | IMUX Immunic, Inc. |
| Sector: Health Care | |
| SubSector: Biotechnology | |
| MarketCap: 57.1785 Millions | |
| Recent Price: 1.33 Smart Investing & Trading Score: 27 | |
| Day Percent Change: 5.56% Day Change: 0.07 | |
| Week Change: 9.02% Year-to-date Change: -10.7% | |
| IMUX Links: Profile News Message Board | |
| Charts:- Daily , Weekly | |
| Add IMUX to Watchlist: View: Get Complete IMUX Trend Analysis ➞ | |
 | MDGL Madrigal Pharmaceuticals, Inc. |
| Sector: Health Care | |
| SubSector: Biotechnology | |
| MarketCap: 1104.35 Millions | |
| Recent Price: 210.69 Smart Investing & Trading Score: 27 | |
| Day Percent Change: 3.27% Day Change: 6.67 | |
| Week Change: 8.98% Year-to-date Change: -8.9% | |
| MDGL Links: Profile News Message Board | |
| Charts:- Daily , Weekly | |
| Add MDGL to Watchlist: View: Get Complete MDGL Trend Analysis ➞ | |
 | TNYA Tenaya Therapeutics, Inc. |
| Sector: Health Care | |
| SubSector: Biotechnology | |
| MarketCap: 395 Millions | |
| Recent Price: 4.69 Smart Investing & Trading Score: 59 | |
| Day Percent Change: 3.30% Day Change: 0.15 | |
| Week Change: 8.82% Year-to-date Change: 47.5% | |
| TNYA Links: Profile News Message Board | |
| Charts:- Daily , Weekly | |
| Add TNYA to Watchlist: View: Get Complete TNYA Trend Analysis ➞ | |
 | OMGA Omega Therapeutics, Inc. |
| Sector: Health Care | |
| SubSector: Biotechnology | |
| MarketCap: 304 Millions | |
| Recent Price: 2.47 Smart Investing & Trading Score: 49 | |
| Day Percent Change: 10.76% Day Change: 0.24 | |
| Week Change: 8.81% Year-to-date Change: -17.9% | |
| OMGA Links: Profile News Message Board | |
| Charts:- Daily , Weekly | |
| Add OMGA to Watchlist: View: Get Complete OMGA Trend Analysis ➞ | |
 | MLYS Mineralys Therapeutics, Inc. |
| Sector: Health Care | |
| SubSector: Biotechnology | |
| MarketCap: 719 Millions | |
| Recent Price: 12.90 Smart Investing & Trading Score: 59 | |
| Day Percent Change: 5.27% Day Change: 0.64 | |
| Week Change: 8.73% Year-to-date Change: 47.9% | |
| MLYS Links: Profile News Message Board | |
| Charts:- Daily , Weekly | |
| Add MLYS to Watchlist: View: Get Complete MLYS Trend Analysis ➞ | |
 | BBIO BridgeBio Pharma, Inc. |
| Sector: Health Care | |
| SubSector: Biotechnology | |
| MarketCap: 3879.35 Millions | |
| Recent Price: 27.01 Smart Investing & Trading Score: 29 | |
| Day Percent Change: 5.43% Day Change: 1.39 | |
| Week Change: 8.56% Year-to-date Change: -33.1% | |
| BBIO Links: Profile News Message Board | |
| Charts:- Daily , Weekly | |
| Add BBIO to Watchlist: View: Get Complete BBIO Trend Analysis ➞ | |
 | ADCT ADC Therapeutics SA |
| Sector: Health Care | |
| SubSector: Biotechnology | |
| MarketCap: 26087 Millions | |
| Recent Price: 4.71 Smart Investing & Trading Score: 38 | |
| Day Percent Change: 6.80% Day Change: 0.30 | |
| Week Change: 8.53% Year-to-date Change: 183.7% | |
| ADCT Links: Profile News Message Board | |
| Charts:- Daily , Weekly | |
| Add ADCT to Watchlist: View: Get Complete ADCT Trend Analysis ➞ | |
 | QSI Quantum-Si incorporated |
| Sector: Health Care | |
| SubSector: Biotechnology | |
| MarketCap: 256 Millions | |
| Recent Price: 1.79 Smart Investing & Trading Score: 42 | |
| Day Percent Change: 11.18% Day Change: 0.18 | |
| Week Change: 8.48% Year-to-date Change: -11.0% | |
| QSI Links: Profile News Message Board | |
| Charts:- Daily , Weekly | |
| Add QSI to Watchlist: View: Get Complete QSI Trend Analysis ➞ | |
 | KYMR Kymera Therapeutics, Inc. |
| Sector: Health Care | |
| SubSector: Biotechnology | |
| MarketCap: 27087 Millions | |
| Recent Price: 36.20 Smart Investing & Trading Score: 37 | |
| Day Percent Change: 7.66% Day Change: 2.58 | |
| Week Change: 8.47% Year-to-date Change: 42.4% | |
| KYMR Links: Profile News Message Board | |
| Charts:- Daily , Weekly | |
| Add KYMR to Watchlist: View: Get Complete KYMR Trend Analysis ➞ | |
 | KNSA Kiniksa Pharmaceuticals, Ltd. |
| Sector: Health Care | |
| SubSector: Biotechnology | |
| MarketCap: 780.285 Millions | |
| Recent Price: 19.39 Smart Investing & Trading Score: 44 | |
| Day Percent Change: 3.55% Day Change: 0.67 | |
| Week Change: 8.42% Year-to-date Change: 10.5% | |
| KNSA Links: Profile News Message Board | |
| Charts:- Daily , Weekly | |
| Add KNSA to Watchlist: View: Get Complete KNSA Trend Analysis ➞ | |
 | RYTM Rhythm Pharmaceuticals, Inc. |
| Sector: Health Care | |
| SubSector: Biotechnology | |
| MarketCap: 643.685 Millions | |
| Recent Price: 41.49 Smart Investing & Trading Score: 29 | |
| Day Percent Change: 4.35% Day Change: 1.73 | |
| Week Change: 8.39% Year-to-date Change: -9.8% | |
| RYTM Links: Profile News Message Board | |
| Charts:- Daily , Weekly | |
| Add RYTM to Watchlist: View: Get Complete RYTM Trend Analysis ➞ | |
 | NTLA Intellia Therapeutics, Inc. |
| Sector: Health Care | |
| SubSector: Biotechnology | |
| MarketCap: 707.185 Millions | |
| Recent Price: 22.50 Smart Investing & Trading Score: 59 | |
| Day Percent Change: 5.14% Day Change: 1.10 | |
| Week Change: 8.38% Year-to-date Change: -26.2% | |
| NTLA Links: Profile News Message Board | |
| Charts:- Daily , Weekly | |
| Add NTLA to Watchlist: View: Get Complete NTLA Trend Analysis ➞ | |
 | CSTL Castle Biosciences, Inc. |
| Sector: Health Care | |
| SubSector: Medical Laboratories & Research | |
| MarketCap: 545 Millions | |
| Recent Price: 22.03 Smart Investing & Trading Score: 100 | |
| Day Percent Change: 4.46% Day Change: 0.94 | |
| Week Change: 8.31% Year-to-date Change: 2.1% | |
| CSTL Links: Profile News Message Board | |
| Charts:- Daily , Weekly | |
| Add CSTL to Watchlist: View: Get Complete CSTL Trend Analysis ➞ | |
 | CMPX Compass Therapeutics, Inc. |
| Sector: Health Care | |
| SubSector: Biotechnology | |
| MarketCap: 406 Millions | |
| Recent Price: 1.57 Smart Investing & Trading Score: 42 | |
| Day Percent Change: 9.03% Day Change: 0.13 | |
| Week Change: 8.28% Year-to-date Change: 2.3% | |
| CMPX Links: Profile News Message Board | |
| Charts:- Daily , Weekly | |
| Add CMPX to Watchlist: View: Get Complete CMPX Trend Analysis ➞ | |
 | KALA Kala Pharmaceuticals, Inc. |
| Sector: Health Care | |
| SubSector: Biotechnology | |
| MarketCap: 276.485 Millions | |
| Recent Price: 6.82 Smart Investing & Trading Score: 42 | |
| Day Percent Change: 0.00% Day Change: 0.00 | |
| Week Change: 8.25% Year-to-date Change: -2.6% | |
| KALA Links: Profile News Message Board | |
| Charts:- Daily , Weekly | |
| Add KALA to Watchlist: View: Get Complete KALA Trend Analysis ➞ | |
 | NARI Inari Medical, Inc. |
| Sector: Health Care | |
| SubSector: Medical Devices | |
| MarketCap: 33287 Millions | |
| Recent Price: 41.59 Smart Investing & Trading Score: 74 | |
| Day Percent Change: 11.37% Day Change: 4.24 | |
| Week Change: 8.24% Year-to-date Change: -36.0% | |
| NARI Links: Profile News Message Board | |
| Charts:- Daily , Weekly | |
| Add NARI to Watchlist: View: Get Complete NARI Trend Analysis ➞ | |
 | CARA Cara Therapeutics, Inc. |
| Sector: Health Care | |
| SubSector: Biotechnology | |
| MarketCap: 597.985 Millions | |
| Recent Price: 0.74 Smart Investing & Trading Score: 49 | |
| Day Percent Change: -1.65% Day Change: -0.01 | |
| Week Change: 8.07% Year-to-date Change: -0.5% | |
| CARA Links: Profile News Message Board | |
| Charts:- Daily , Weekly | |
| Add CARA to Watchlist: View: Get Complete CARA Trend Analysis ➞ | |
| For tabular summary view of above stock list: Summary View ➞ 0 - 25 , 25 - 50 , 50 - 75 , 75 - 100 , 100 - 125 , 125 - 150 , 150 - 175 , 175 - 200 , 200 - 225 , 225 - 250 , 250 - 275 , 275 - 300 , 300 - 325 , 325 - 350 , 350 - 375 , 375 - 400 , 400 - 425 , 425 - 450 , 450 - 475 , 475 - 500 , 500 - 525 , 525 - 550 , 550 - 575 , 575 - 600 , 600 - 625 , 625 - 650 , 650 - 675 , 675 - 700 , 700 - 725 | ||
| Click To Change The Sort Order: By Market Cap or Company Size Performance: Year-to-date, Week and Day | |
| Select Chart Type: | ||
|
Best Stocks Today 12Stocks.com |
© 2024 12Stocks.com Terms & Conditions Privacy Contact Us
All Information Provided Only For Education And Not To Be Used For Investing or Trading. See Terms & Conditions


One More Thing ... Get Best Stocks Delivered Daily!
Never Ever Miss A Move With Our Top Ten Stocks Lists
Find Best Stocks In Any Market - Bull or Bear Market
Take A Peek At Our Top Ten Stocks Lists: Daily, Weekly, Year-to-Date & Top Trends
Find Best Stocks In Any Market - Bull or Bear Market
Take A Peek At Our Top Ten Stocks Lists: Daily, Weekly, Year-to-Date & Top Trends
Healthcare Stocks With Best Up Trends [0-bearish to 100-bullish]: CytomX [100], Surmodics [100], TransMedics [100], GeneDx [100], Bio-Techne [100], PROCEPT BioRobotics[100], Xencor [100], Mesoblast [100], United [100], PTC [100], Pfizer [100]
Best Healthcare Stocks Year-to-Date:
Pieris [6339.56%], Avenue [2881.37%], Precision BioSciences[2791.78%], Inovio [2166.67%], Assembly Biosciences[1520.53%], Agenus [1499.83%], Aurora Cannabis[1443.47%], NuCana [1208.32%], Adverum Biotechnologies[1201.81%], Affimed N.V[756%], CareMax [722.68%] Best Healthcare Stocks This Week:
CytomX [221.38%], GeneDx [88.13%], Deciphera [73.07%], Concord [51.32%], Cue Biopharma[39.93%], Poseida [30.52%], Seres [30.3%], P3 Health[29.62%], Phibro Animal[28.75%], Canopy Growth[28.62%], CareMax [27.88%] Best Healthcare Stocks Daily:
CytomX [213.50%], Surmodics [29.62%], TransMedics [24.91%], Ventyx Biosciences[24.63%], GeneDx [22.11%], Summit [19.08%], MiMedx [18.34%], Cabaletta Bio[16.30%], Bio-Techne [16.18%], TG [16.07%], Brainstorm Cell[15.44%]