
 Login Sign Up


| |||||
 |  | ||||

| 12Stocks.com Market Intelligence |
Best Healthcare Stocks
 | "Discover best trending healthcare stocks with 12Stocks.com." |
| - Subu Vdaygiri, Founder, 12Stocks.com |
| In a hurry? Healthcare Stocks Lists: Performance Trends Table, Stock Charts
Sort Healthcare stocks: Daily, Weekly, Year-to-Date, Market Cap & Trends. Filter Healthcare stocks list by size:All Healthcare Large Mid-Range Small |
| 12Stocks.com Healthcare Stocks Performances & Trends Daily | |||||||||
|
|  The overall Smart Investing & Trading Score is 52 (0-bearish to 100-bullish) which puts Healthcare sector in short term neutral trend. The Smart Investing & Trading Score from previous trading session is 38 and an improvement of trend continues.
| ||||||||
Here are the Smart Investing & Trading Scores of the most requested Healthcare stocks at 12Stocks.com (click stock name for detailed review):
|


| 12Stocks.com: Investing in Healthcare sector with Stocks | |
|
The following table helps investors and traders sort through current performance and trends (as measured by Smart Investing & Trading Score) of various
stocks in the Healthcare sector. Quick View: Move mouse or cursor over stock symbol (ticker) to view short-term Technical chart and over stock name to view long term chart. Click on  to add stock symbol to your watchlist and to add stock symbol to your watchlist and  to view watchlist. Click on any ticker or stock name for detailed market intelligence report for that stock. to view watchlist. Click on any ticker or stock name for detailed market intelligence report for that stock. |
12Stocks.com Performance of Stocks in Healthcare Sector
| Ticker | Stock Name | Watchlist | Category | Recent Price | Smart Investing & Trading Score | Change % | Weekly Change% |
| SRPT | Sarepta |   | Biotechnology | 117.60 | 30 | 0.41% | 1.71% |
| PSTX | Poseida | | Biotechnology | 2.09 | 32 | -3.47% | 1.71% |
| INGN | Inogen | | Instruments | 6.87 | 42 | -0.51% | 1.70% |
| VERA | Vera | | Biotechnology | 38.64 | 56 | -2.08% | 1.68% |
| DH | Definitive | | Health Information | 7.17 | 32 | -1.44% | 1.63% |
| HOLX | Hologic | | Instruments | 76.59 | 68 | -0.78% | 1.61% |
| INVA | Innoviva | | Biotechnology | 15.19 | 64 | 0.13% | 1.61% |
| HLN | Haleon | | Drug Manufacturers - Specialty & Generic | 8.35 | 90 | -0.71% | 1.58% |
| ITCI | Intra-Cellular Therapies | | Biotechnology | 73.50 | 83 | -0.69% | 1.56% |
| MLYS | Mineralys | | Biotechnology | 11.47 | 53 | 0.53% | 1.55% |
| APTO | Aptose Biosciences | | Biotechnology | 1.25 | 27 | 1.63% | 1.54% |
| REGN | Regeneron | | Biotechnology | 910.54 | 32 | 0.35% | 1.53% |
| VERU | Veru | | Pharmaceutical | 1.33 | 56 | 3.92% | 1.53% |
| BLCO | Bausch + | | Instruments | 14.86 | 65 | 0.07% | 1.50% |
| VCYT | Veracyte | | Biotechnology | 19.74 | 42 | -0.45% | 1.49% |
| TARS | Tarsus | | Biotechnology | 33.38 | 63 | -0.98% | 1.49% |
| AMWL | American Well | | Health Information | 0.56 | 20 | 2.43% | 1.48% |
| STE | STERIS | | Instruments | 202.44 | 49 | -1.72% | 1.47% |
| MLTX | MoonLake Immuno | | Biotechnology | 42.81 | 35 | -0.99% | 1.47% |
| LUNG | Pulmonx | | Medical Devices | 7.63 | 20 | 1.73% | 1.46% |
| XENE | Xenon | | Biotechnology | 40.46 | 42 | -1.53% | 1.45% |
| XERS | Xeris | | Biotechnology | 1.75 | 20 | -1.40% | 1.45% |
| VRTX | Vertex | | Biotechnology | 399.90 | 57 | -1.24% | 1.43% |
| VIGL | Vigil Neuroscience | | Biotechnology | 2.86 | 17 | 7.92% | 1.42% |
| EMBC | Embecta | | Instruments | 10.77 | 52 | -1.10% | 1.41% |
| For chart view version of above stock list: Chart View ➞ 0 - 25 , 25 - 50 , 50 - 75 , 75 - 100 , 100 - 125 , 125 - 150 , 150 - 175 , 175 - 200 , 200 - 225 , 225 - 250 , 250 - 275 , 275 - 300 , 300 - 325 , 325 - 350 , 350 - 375 , 375 - 400 , 400 - 425 , 425 - 450 , 450 - 475 , 475 - 500 , 500 - 525 , 525 - 550 , 550 - 575 , 575 - 600 , 600 - 625 , 625 - 650 | ||
 | Click To Change The Sort Order: By Market Cap or Company Size Performance: Year-to-date, Week and Day |  |
|
Get the most comprehensive stock market coverage daily at 12Stocks.com ➞ Best Stocks Today ➞ Best Stocks Weekly ➞ Best Stocks Year-to-Date ➞ Best Stocks Trends ➞  Best Stocks Today 12Stocks.com Best Nasdaq Stocks ➞ Best S&P 500 Stocks ➞ Best Tech Stocks ➞ Best Biotech Stocks ➞ |
| Detailed Overview of Healthcare Stocks |
| Healthcare Technical Overview, Leaders & Laggards, Top Healthcare ETF Funds & Detailed Healthcare Stocks List, Charts, Trends & More |
| Healthcare Sector: Technical Analysis, Trends & YTD Performance | |
| Healthcare sector is composed of stocks
from pharmaceutical, biotech, diagnostics labs, insurance providers
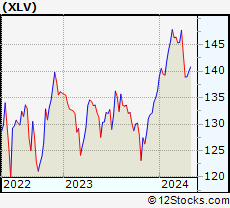
and healthcare services. Healthcare sector, as represented by XLV, an exchange-traded fund [ETF] that holds basket of Healthcare stocks (e.g, Merck, Amgen) is up by 2.84% and is currently underperforming the overall market by -2.5% year-to-date. Below is a quick view of Technical charts and trends: |
|
 XLV Weekly Chart |
|
| Long Term Trend: Good | |
| Medium Term Trend: Not Good | |
 XLV Daily Chart |
|
| Short Term Trend: Very Good | |
| Overall Trend Score: 52 | |
| YTD Performance: 2.84% | |
| **Trend Scores & Views Are Only For Educational Purposes And Not For Investing | |
| 12Stocks.com: Top Performing Healthcare Sector Stocks | ||||||||||||||||||||||||||||||||||||||||||||||||
 The top performing Healthcare sector stocks year to date are
Now, more recently, over last week, the top performing Healthcare sector stocks on the move are


|
||||||||||||||||||||||||||||||||||||||||||||||||
| 12Stocks.com: Investing in Healthcare Sector using Exchange Traded Funds | |
|
The following table shows list of key exchange traded funds (ETF) that
help investors track Healthcare Index. For detailed view, check out our ETF Funds section of our website. Quick View: Move mouse or cursor over ETF symbol (ticker) to view short-term Technical chart and over ETF name to view long term chart. Click on ticker or stock name for detailed view. Click on to add stock symbol to your watchlist and to view watchlist. |
12Stocks.com List of ETFs that track Healthcare Index
| Ticker | ETF Name | Watchlist | Recent Price | Smart Investing & Trading Score | Change % | Week % | Year-to-date % |
| XLV | Health Care | | 140.26 | 52 | -0.74 | 0.94 | 2.84% |
| XBI | Biotech | | 84.96 | 32 | 0.32 | 2.57 | -4.85% |
| IBB | Biotechnology | | 127.76 | 32 | -0.20 | 2.44 | -5.96% |
| BBH | Biotech | | 157.97 | 49 | 0.43 | 3.68 | -4.44% |
| IHF | Healthcare Providers | | 51.93 | 55 | -0.75 | -0.54 | -1.11% |
| LABU | Biotech Bull 3X | | 92.49 | 32 | 0.55 | 7.48 | -24.17% |
| LABD | Biotech Bear 3X | | 9.98 | 55 | -0.89 | -7.59 | 2.99% |
| RXL | Health Care | | 95.84 | 52 | -0.32 | 2.81 | 4.86% |
| 12Stocks.com: Charts, Trends, Fundamental Data and Performances of Healthcare Stocks | |
|
We now take in-depth look at all Healthcare stocks including charts, multi-period performances and overall trends (as measured by Smart Investing & Trading Score). One can sort Healthcare stocks (click link to choose) by Daily, Weekly and by Year-to-Date performances. Also, one can sort by size of the company or by market capitalization. |
| Select Your Default Chart Type: | |||||
| |||||
| Click on stock symbol or name for detailed view. Click on to add stock symbol to your watchlist and to view watchlist. Quick View: Move mouse or cursor over "Daily" to quickly view daily Technical stock chart and over "Weekly" to view weekly Technical stock chart. | |||||

 | SRPT Sarepta Therapeutics, Inc. |
| Sector: Health Care | |
| SubSector: Biotechnology | |
| MarketCap: 7388.05 Millions | |
| Recent Price: 117.60 Smart Investing & Trading Score: 30 | |
| Day Percent Change: 0.41% Day Change: 0.48 | |
| Week Change: 1.71% Year-to-date Change: 22.0% | |
| SRPT Links: Profile News Message Board | |
| Charts:- Daily , Weekly | |
| Add SRPT to Watchlist: View: Get Complete SRPT Trend Analysis ➞ | |
 | PSTX Poseida Therapeutics, Inc. |
| Sector: Health Care | |
| SubSector: Biotechnology | |
| MarketCap: 64487 Millions | |
| Recent Price: 2.09 Smart Investing & Trading Score: 32 | |
| Day Percent Change: -3.47% Day Change: -0.08 | |
| Week Change: 1.71% Year-to-date Change: -38.0% | |
| PSTX Links: Profile News Message Board | |
| Charts:- Daily , Weekly | |
| Add PSTX to Watchlist: View: Get Complete PSTX Trend Analysis ➞ | |
 | INGN Inogen, Inc. |
| Sector: Health Care | |
| SubSector: Medical Instruments & Supplies | |
| MarketCap: 8803.6 Millions | |
| Recent Price: 6.87 Smart Investing & Trading Score: 42 | |
| Day Percent Change: -0.51% Day Change: -0.04 | |
| Week Change: 1.7% Year-to-date Change: 25.1% | |
| INGN Links: Profile News Message Board | |
| Charts:- Daily , Weekly | |
| Add INGN to Watchlist: View: Get Complete INGN Trend Analysis ➞ | |
 | VERA Vera Therapeutics, Inc. |
| Sector: Health Care | |
| SubSector: Biotechnology | |
| MarketCap: 746 Millions | |
| Recent Price: 38.64 Smart Investing & Trading Score: 56 | |
| Day Percent Change: -2.08% Day Change: -0.82 | |
| Week Change: 1.68% Year-to-date Change: 149.6% | |
| VERA Links: Profile News Message Board | |
| Charts:- Daily , Weekly | |
| Add VERA to Watchlist: View: Get Complete VERA Trend Analysis ➞ | |
 | DH Definitive Healthcare Corp. |
| Sector: Health Care | |
| SubSector: Health Information Services | |
| MarketCap: 1690 Millions | |
| Recent Price: 7.17 Smart Investing & Trading Score: 32 | |
| Day Percent Change: -1.44% Day Change: -0.11 | |
| Week Change: 1.63% Year-to-date Change: -28.8% | |
| DH Links: Profile News Message Board | |
| Charts:- Daily , Weekly | |
| Add DH to Watchlist: View: Get Complete DH Trend Analysis ➞ | |
 | HOLX Hologic, Inc. |
| Sector: Health Care | |
| SubSector: Medical Instruments & Supplies | |
| MarketCap: 9075.2 Millions | |
| Recent Price: 76.59 Smart Investing & Trading Score: 68 | |
| Day Percent Change: -0.78% Day Change: -0.60 | |
| Week Change: 1.61% Year-to-date Change: 7.2% | |
| HOLX Links: Profile News Message Board | |
| Charts:- Daily , Weekly | |
| Add HOLX to Watchlist: View: Get Complete HOLX Trend Analysis ➞ | |
 | INVA Innoviva, Inc. |
| Sector: Health Care | |
| SubSector: Biotechnology | |
| MarketCap: 1023.15 Millions | |
| Recent Price: 15.19 Smart Investing & Trading Score: 64 | |
| Day Percent Change: 0.13% Day Change: 0.02 | |
| Week Change: 1.61% Year-to-date Change: -5.3% | |
| INVA Links: Profile News Message Board | |
| Charts:- Daily , Weekly | |
| Add INVA to Watchlist: View: Get Complete INVA Trend Analysis ➞ | |
 | HLN Haleon plc |
| Sector: Health Care | |
| SubSector: Drug Manufacturers - Specialty & Generic | |
| MarketCap: 38310 Millions | |
| Recent Price: 8.35 Smart Investing & Trading Score: 90 | |
| Day Percent Change: -0.71% Day Change: -0.06 | |
| Week Change: 1.58% Year-to-date Change: 1.5% | |
| HLN Links: Profile News Message Board | |
| Charts:- Daily , Weekly | |
| Add HLN to Watchlist: View: Get Complete HLN Trend Analysis ➞ | |
 | ITCI Intra-Cellular Therapies, Inc. |
| Sector: Health Care | |
| SubSector: Biotechnology | |
| MarketCap: 991.885 Millions | |
| Recent Price: 73.50 Smart Investing & Trading Score: 83 | |
| Day Percent Change: -0.69% Day Change: -0.51 | |
| Week Change: 1.56% Year-to-date Change: 2.6% | |
| ITCI Links: Profile News Message Board | |
| Charts:- Daily , Weekly | |
| Add ITCI to Watchlist: View: Get Complete ITCI Trend Analysis ➞ | |
 | MLYS Mineralys Therapeutics, Inc. |
| Sector: Health Care | |
| SubSector: Biotechnology | |
| MarketCap: 719 Millions | |
| Recent Price: 11.47 Smart Investing & Trading Score: 53 | |
| Day Percent Change: 0.53% Day Change: 0.06 | |
| Week Change: 1.55% Year-to-date Change: 31.5% | |
| MLYS Links: Profile News Message Board | |
| Charts:- Daily , Weekly | |
| Add MLYS to Watchlist: View: Get Complete MLYS Trend Analysis ➞ | |
 | APTO Aptose Biosciences Inc. |
| Sector: Health Care | |
| SubSector: Biotechnology | |
| MarketCap: 484.585 Millions | |
| Recent Price: 1.25 Smart Investing & Trading Score: 27 | |
| Day Percent Change: 1.63% Day Change: 0.02 | |
| Week Change: 1.54% Year-to-date Change: -50.8% | |
| APTO Links: Profile News Message Board | |
| Charts:- Daily , Weekly | |
| Add APTO to Watchlist: View: Get Complete APTO Trend Analysis ➞ | |
 | REGN Regeneron Pharmaceuticals, Inc. |
| Sector: Health Care | |
| SubSector: Biotechnology | |
| MarketCap: 51903.7 Millions | |
| Recent Price: 910.54 Smart Investing & Trading Score: 32 | |
| Day Percent Change: 0.35% Day Change: 3.22 | |
| Week Change: 1.53% Year-to-date Change: 3.7% | |
| REGN Links: Profile News Message Board | |
| Charts:- Daily , Weekly | |
| Add REGN to Watchlist: View: Get Complete REGN Trend Analysis ➞ | |
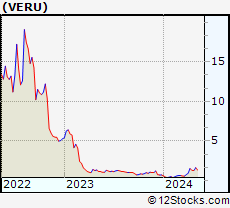 | VERU Veru Inc. |
| Sector: Health Care | |
| SubSector: Drug Manufacturers - Other | |
| MarketCap: 198.833 Millions | |
| Recent Price: 1.33 Smart Investing & Trading Score: 56 | |
| Day Percent Change: 3.92% Day Change: 0.05 | |
| Week Change: 1.53% Year-to-date Change: 84.0% | |
| VERU Links: Profile News Message Board | |
| Charts:- Daily , Weekly | |
| Add VERU to Watchlist: View: Get Complete VERU Trend Analysis ➞ | |
 | BLCO Bausch + Lomb Corporation |
| Sector: Health Care | |
| SubSector: Medical Instruments & Supplies | |
| MarketCap: 7100 Millions | |
| Recent Price: 14.86 Smart Investing & Trading Score: 65 | |
| Day Percent Change: 0.07% Day Change: 0.01 | |
| Week Change: 1.5% Year-to-date Change: -12.6% | |
| BLCO Links: Profile News Message Board | |
| Charts:- Daily , Weekly | |
| Add BLCO to Watchlist: View: Get Complete BLCO Trend Analysis ➞ | |
 | VCYT Veracyte, Inc. |
| Sector: Health Care | |
| SubSector: Biotechnology | |
| MarketCap: 1089.05 Millions | |
| Recent Price: 19.74 Smart Investing & Trading Score: 42 | |
| Day Percent Change: -0.45% Day Change: -0.09 | |
| Week Change: 1.49% Year-to-date Change: -28.2% | |
| VCYT Links: Profile News Message Board | |
| Charts:- Daily , Weekly | |
| Add VCYT to Watchlist: View: Get Complete VCYT Trend Analysis ➞ | |
 | TARS Tarsus Pharmaceuticals, Inc. |
| Sector: Health Care | |
| SubSector: Biotechnology | |
| MarketCap: 74487 Millions | |
| Recent Price: 33.38 Smart Investing & Trading Score: 63 | |
| Day Percent Change: -0.98% Day Change: -0.33 | |
| Week Change: 1.49% Year-to-date Change: 64.6% | |
| TARS Links: Profile News Message Board | |
| Charts:- Daily , Weekly | |
| Add TARS to Watchlist: View: Get Complete TARS Trend Analysis ➞ | |
 | AMWL American Well Corporation |
| Sector: Health Care | |
| SubSector: Health Information Services | |
| MarketCap: 71987 Millions | |
| Recent Price: 0.56 Smart Investing & Trading Score: 20 | |
| Day Percent Change: 2.43% Day Change: 0.01 | |
| Week Change: 1.48% Year-to-date Change: -62.7% | |
| AMWL Links: Profile News Message Board | |
| Charts:- Daily , Weekly | |
| Add AMWL to Watchlist: View: Get Complete AMWL Trend Analysis ➞ | |
 | STE STERIS plc |
| Sector: Health Care | |
| SubSector: Medical Instruments & Supplies | |
| MarketCap: 10875 Millions | |
| Recent Price: 202.44 Smart Investing & Trading Score: 49 | |
| Day Percent Change: -1.72% Day Change: -3.55 | |
| Week Change: 1.47% Year-to-date Change: -7.9% | |
| STE Links: Profile News Message Board | |
| Charts:- Daily , Weekly | |
| Add STE to Watchlist: View: Get Complete STE Trend Analysis ➞ | |
 | MLTX MoonLake Immunotherapeutics |
| Sector: Health Care | |
| SubSector: Biotechnology | |
| MarketCap: 2670 Millions | |
| Recent Price: 42.81 Smart Investing & Trading Score: 35 | |
| Day Percent Change: -0.99% Day Change: -0.43 | |
| Week Change: 1.47% Year-to-date Change: -31.8% | |
| MLTX Links: Profile News Message Board | |
| Charts:- Daily , Weekly | |
| Add MLTX to Watchlist: View: Get Complete MLTX Trend Analysis ➞ | |
 | LUNG Pulmonx Corporation |
| Sector: Health Care | |
| SubSector: Medical Devices | |
| MarketCap: 18187 Millions | |
| Recent Price: 7.63 Smart Investing & Trading Score: 20 | |
| Day Percent Change: 1.73% Day Change: 0.13 | |
| Week Change: 1.46% Year-to-date Change: -40.2% | |
| LUNG Links: Profile News Message Board | |
| Charts:- Daily , Weekly | |
| Add LUNG to Watchlist: View: Get Complete LUNG Trend Analysis ➞ | |
 | XENE Xenon Pharmaceuticals Inc. |
| Sector: Health Care | |
| SubSector: Biotechnology | |
| MarketCap: 388.585 Millions | |
| Recent Price: 40.46 Smart Investing & Trading Score: 42 | |
| Day Percent Change: -1.53% Day Change: -0.63 | |
| Week Change: 1.45% Year-to-date Change: -12.2% | |
| XENE Links: Profile News Message Board | |
| Charts:- Daily , Weekly | |
| Add XENE to Watchlist: View: Get Complete XENE Trend Analysis ➞ | |
 | XERS Xeris Pharmaceuticals, Inc. |
| Sector: Health Care | |
| SubSector: Biotechnology | |
| MarketCap: 74.5785 Millions | |
| Recent Price: 1.75 Smart Investing & Trading Score: 20 | |
| Day Percent Change: -1.40% Day Change: -0.03 | |
| Week Change: 1.45% Year-to-date Change: -25.5% | |
| XERS Links: Profile News Message Board | |
| Charts:- Daily , Weekly | |
| Add XERS to Watchlist: View: Get Complete XERS Trend Analysis ➞ | |
 | VRTX Vertex Pharmaceuticals Incorporated |
| Sector: Health Care | |
| SubSector: Biotechnology | |
| MarketCap: 57669.6 Millions | |
| Recent Price: 399.90 Smart Investing & Trading Score: 57 | |
| Day Percent Change: -1.24% Day Change: -5.01 | |
| Week Change: 1.43% Year-to-date Change: -1.7% | |
| VRTX Links: Profile News Message Board | |
| Charts:- Daily , Weekly | |
| Add VRTX to Watchlist: View: Get Complete VRTX Trend Analysis ➞ | |
 | VIGL Vigil Neuroscience, Inc. |
| Sector: Health Care | |
| SubSector: Biotechnology | |
| MarketCap: 339 Millions | |
| Recent Price: 2.86 Smart Investing & Trading Score: 17 | |
| Day Percent Change: 7.92% Day Change: 0.21 | |
| Week Change: 1.42% Year-to-date Change: -16.6% | |
| VIGL Links: Profile News Message Board | |
| Charts:- Daily , Weekly | |
| Add VIGL to Watchlist: View: Get Complete VIGL Trend Analysis ➞ | |
 | EMBC Embecta Corp. |
| Sector: Health Care | |
| SubSector: Medical Instruments & Supplies | |
| MarketCap: 1260 Millions | |
| Recent Price: 10.77 Smart Investing & Trading Score: 52 | |
| Day Percent Change: -1.10% Day Change: -0.12 | |
| Week Change: 1.41% Year-to-date Change: -43.6% | |
| EMBC Links: Profile News Message Board | |
| Charts:- Daily , Weekly | |
| Add EMBC to Watchlist: View: Get Complete EMBC Trend Analysis ➞ | |
| For tabular summary view of above stock list: Summary View ➞ 0 - 25 , 25 - 50 , 50 - 75 , 75 - 100 , 100 - 125 , 125 - 150 , 150 - 175 , 175 - 200 , 200 - 225 , 225 - 250 , 250 - 275 , 275 - 300 , 300 - 325 , 325 - 350 , 350 - 375 , 375 - 400 , 400 - 425 , 425 - 450 , 450 - 475 , 475 - 500 , 500 - 525 , 525 - 550 , 550 - 575 , 575 - 600 , 600 - 625 , 625 - 650 | ||
| Click To Change The Sort Order: By Market Cap or Company Size Performance: Year-to-date, Week and Day | |
| Select Chart Type: | ||
|
Best Stocks Today 12Stocks.com |
© 2024 12Stocks.com Terms & Conditions Privacy Contact Us
All Information Provided Only For Education And Not To Be Used For Investing or Trading. See Terms & Conditions


One More Thing ... Get Best Stocks Delivered Daily!
Never Ever Miss A Move With Our Top Ten Stocks Lists
Find Best Stocks In Any Market - Bull or Bear Market
Take A Peek At Our Top Ten Stocks Lists: Daily, Weekly, Year-to-Date & Top Trends
Find Best Stocks In Any Market - Bull or Bear Market
Take A Peek At Our Top Ten Stocks Lists: Daily, Weekly, Year-to-Date & Top Trends
Healthcare Stocks With Best Up Trends [0-bearish to 100-bullish]: Boston Scientific[100], Annovis Bio[100], Glaukos [100], BioMarin [100], Oscar Health[100], AstraZeneca [100], Quest Diagnostics[100], PureTech Health[100], Avadel [100], Agios [100], Brookdale Senior[100]
Best Healthcare Stocks Year-to-Date:
Pieris [6323.08%], Precision BioSciences[2679.45%], Inovio [1931.37%], Assembly Biosciences[1518.1%], Adverum Biotechnologies[1359.88%], NuCana [1252.27%], Agenus [760.01%], Affimed N.V[756%], CareMax [594.85%], Corbus [500.58%], Mesoblast [438.18%] Best Healthcare Stocks This Week:
Pieris [7962.07%], BeyondSpring [35.56%], Agenus [34.09%], CareMax [31.13%], Seres [30.01%], VolitionRx [29.89%], GeneDx [24.74%], Annovis Bio[23.5%], ProKidney [23.28%], MSP Recovery[19.2%], Molecular Partners[16.87%] Best Healthcare Stocks Daily:
Agenus [10.22%], Cytosorbents [9.55%], Cullinan Oncology[8.11%], Sage [8.03%], Vigil Neuroscience[7.92%], Annexon [7.66%], BeyondSpring [6.55%], Boston Scientific[6.22%], GlycoMimetics [5.93%], Shattuck Labs[5.37%], Apyx [5.30%]