
 Login Sign Up


| |||||
 |  | ||||

| 12Stocks.com Market Intelligence |
Best Healthcare Stocks
 | "Discover best trending healthcare stocks with 12Stocks.com." |
| - Subu Vdaygiri, Founder, 12Stocks.com |
| In a hurry? Healthcare Stocks Lists: Performance Trends Table, Stock Charts
Sort Healthcare stocks: Daily, Weekly, Year-to-Date, Market Cap & Trends. Filter Healthcare stocks list by size:All Healthcare Large Mid-Range Small |
| 12Stocks.com Healthcare Stocks Performances & Trends Daily | |||||||||
|
|  The overall Smart Investing & Trading Score is 25 (0-bearish to 100-bullish) which puts Healthcare sector in short term bearish to neutral trend. The Smart Investing & Trading Score from previous trading session is 18 and hence an improvement of trend.
| ||||||||
Here are the Smart Investing & Trading Scores of the most requested Healthcare stocks at 12Stocks.com (click stock name for detailed review):
|


| 12Stocks.com: Investing in Healthcare sector with Stocks | |
|
The following table helps investors and traders sort through current performance and trends (as measured by Smart Investing & Trading Score) of various
stocks in the Healthcare sector. Quick View: Move mouse or cursor over stock symbol (ticker) to view short-term Technical chart and over stock name to view long term chart. Click on  to add stock symbol to your watchlist and to add stock symbol to your watchlist and  to view watchlist. Click on any ticker or stock name for detailed market intelligence report for that stock. to view watchlist. Click on any ticker or stock name for detailed market intelligence report for that stock. |
12Stocks.com Performance of Stocks in Healthcare Sector
| Ticker | Stock Name | Watchlist | Category | Recent Price | Smart Investing & Trading Score | Change % | Weekly Change% |
| DCPH | Deciphera |   | Biotechnology | 14.69 | 13 | 3.23% | -2.39% |
| MOH | Molina | | Insurance | 367.52 | 58 | 1.82% | -2.40% |
| COLL | Collegium | | Pharmaceutical | 34.85 | 36 | 0.23% | -2.41% |
| LAKE | Lakeland Industries | | Instruments | 16.40 | 15 | -0.06% | -2.44% |
| ICUI | ICU | | Instruments | 95.80 | 68 | -1.14% | -2.45% |
| KALV | KalVista | | Biotechnology | 11.59 | 5 | 0.78% | -2.52% |
| HOLX | Hologic | | Instruments | 75.37 | 61 | 0.36% | -2.53% |
| GMED | Globus | | Equipment | 50.35 | 10 | -0.79% | -2.55% |
| XRAY | DENTSPLY SIRONA | | Instruments | 30.50 | 10 | 0.20% | -2.56% |
| AVAH | Aveanna | | Medical Care Facilities | 2.28 | 17 | 1.79% | -2.56% |
| CNMD | CONMED | | Equipment | 72.64 | 17 | 2.19% | -2.60% |
| TCMD | Tactile Systems | | Instruments | 14.40 | 37 | 1.80% | -2.60% |
| TGTX | TG | | Biotechnology | 13.79 | 10 | -1.43% | -2.61% |
| IQV | IQVIA | | Laboratories | 228.09 | 44 | 0.40% | -2.62% |
| IONS | Ionis | | Biotechnology | 40.64 | 20 | -0.42% | -2.64% |
| KYMR | Kymera | | Biotechnology | 34.64 | 56 | -1.48% | -2.64% |
| SUPN | Supernus | | Pharmaceutical | 29.43 | 54 | 1.94% | -2.68% |
| TBPH | Theravance Biopharma | | Biotechnology | 9.35 | 32 | 1.63% | -2.71% |
| GILD | Gilead Sciences | | Biotechnology | 66.77 | 10 | 0.92% | -2.74% |
| INMD | InMode | | Equipment | 17.42 | 10 | 0.46% | -2.79% |
| ALNY | Alnylam | | Biotechnology | 144.32 | 28 | -0.58% | -2.82% |
| IVA | Inventiva S.A | | Biotechnology | 3.45 | 32 | 5.18% | -2.82% |
| INCY | yte | | Biotechnology | 52.30 | 0 | -0.98% | -2.88% |
| EHAB | Enhabit | | Medical Care Facilities | 10.10 | 33 | -1.94% | -2.88% |
| PRTC | PureTech Health | | Biotechnology | 26.27 | 56 | -2.47% | -2.88% |
| For chart view version of above stock list: Chart View ➞ 0 - 25 , 25 - 50 , 50 - 75 , 75 - 100 , 100 - 125 , 125 - 150 , 150 - 175 , 175 - 200 , 200 - 225 , 225 - 250 , 250 - 275 , 275 - 300 , 300 - 325 , 325 - 350 , 350 - 375 , 375 - 400 , 400 - 425 , 425 - 450 , 450 - 475 , 475 - 500 , 500 - 525 , 525 - 550 , 550 - 575 , 575 - 600 , 600 - 625 , 625 - 650 , 650 - 675 , 675 - 700 , 700 - 725 | ||
 | Click To Change The Sort Order: By Market Cap or Company Size Performance: Year-to-date, Week and Day |  |
|
Get the most comprehensive stock market coverage daily at 12Stocks.com ➞ Best Stocks Today ➞ Best Stocks Weekly ➞ Best Stocks Year-to-Date ➞ Best Stocks Trends ➞  Best Stocks Today 12Stocks.com Best Nasdaq Stocks ➞ Best S&P 500 Stocks ➞ Best Tech Stocks ➞ Best Biotech Stocks ➞ |
| Detailed Overview of Healthcare Stocks |
| Healthcare Technical Overview, Leaders & Laggards, Top Healthcare ETF Funds & Detailed Healthcare Stocks List, Charts, Trends & More |
| Healthcare Sector: Technical Analysis, Trends & YTD Performance | |
| Healthcare sector is composed of stocks
from pharmaceutical, biotech, diagnostics labs, insurance providers
and healthcare services. Healthcare sector, as represented by XLV, an exchange-traded fund [ETF] that holds basket of Healthcare stocks (e.g, Merck, Amgen) is up by 1.88% and is currently underperforming the overall market by -1.5% year-to-date. Below is a quick view of Technical charts and trends: |
|
 XLV Weekly Chart |
|
| Long Term Trend: Not Good | |
| Medium Term Trend: Not Good | |
 XLV Daily Chart |
|
| Short Term Trend: Deteriorating | |
| Overall Trend Score: 25 | |
| YTD Performance: 1.88% | |
| **Trend Scores & Views Are Only For Educational Purposes And Not For Investing | |
| 12Stocks.com: Top Performing Healthcare Sector Stocks | ||||||||||||||||||||||||||||||||||||||||||||||||
 The top performing Healthcare sector stocks year to date are
Now, more recently, over last week, the top performing Healthcare sector stocks on the move are


|
||||||||||||||||||||||||||||||||||||||||||||||||
| 12Stocks.com: Investing in Healthcare Sector using Exchange Traded Funds | |
|
The following table shows list of key exchange traded funds (ETF) that
help investors track Healthcare Index. For detailed view, check out our ETF Funds section of our website. Quick View: Move mouse or cursor over ETF symbol (ticker) to view short-term Technical chart and over ETF name to view long term chart. Click on ticker or stock name for detailed view. Click on to add stock symbol to your watchlist and to view watchlist. |
12Stocks.com List of ETFs that track Healthcare Index
| Ticker | ETF Name | Watchlist | Recent Price | Smart Investing & Trading Score | Change % | Week % | Year-to-date % |
| XLV | Health Care | | 138.95 | 25 | 0.38 | 0.03 | 1.88% |
| XBI | Biotech | | 82.83 | 10 | -0.78 | -6.04 | -7.23% |
| IBB | Biotechnology | | 124.73 | 0 | 0.07 | -3.74 | -8.19% |
| BBH | Biotech | | 152.12 | 10 | -0.15 | -3.47 | -7.98% |
| VHT | Health Care | | 253.33 | 10 | 0.20 | -0.57 | 1.05% |
| IYH | Healthcare | | 58.16 | 10 | 0.19 | -0.41 | 1.59% |
| IHF | Healthcare Providers | | 52.21 | 52 | 1.29 | 3.3 | -0.57% |
| IHI | Medical Devices | | 54.36 | 15 | -0.31 | -3.1 | 0.72% |
| BIB | Biotechnology | | 48.01 | 10 | 0.15 | -6.58 | -15.85% |
| BIS | Short Biotech | | 20.98 | 95 | 0.55 | 7.04 | 16.1% |
| XHE | Health Care Equipment | | 81.27 | 28 | -0.20 | -3.13 | -3.55% |
| CURE | Healthcare Bull 3X | | 103.33 | 25 | 1.09 | -0.06 | 1.56% |
| LABU | Biotech Bull 3X | | 86.05 | 10 | -2.26 | -17.54 | -29.45% |
| LABD | Biotech Bear 3X | | 10.80 | 80 | 2.66 | 20.27 | 11.46% |
| PSCH | SmallCap Health Care | | 40.18 | 20 | 0.25 | -3.02 | -6.12% |
| XHS | Health Care Services | | 87.08 | 25 | 1.04 | -1.05 | -2.1% |
| PTH | DWA Healthcare Momentum | | 39.53 | 23 | -0.10 | -5.5 | 1% |
| BTEC | Principal Healthcare Innovators | | 33.86 | 0 | -0.67 | -5.92 | -6.8% |
| RXL | Health Care | | 93.07 | 25 | 0.68 | -0.2 | 1.82% |
| RXD | Short Health Care | | 11.64 | 76 | -0.29 | 0.34 | -2.39% |
| 12Stocks.com: Charts, Trends, Fundamental Data and Performances of Healthcare Stocks | |
|
We now take in-depth look at all Healthcare stocks including charts, multi-period performances and overall trends (as measured by Smart Investing & Trading Score). One can sort Healthcare stocks (click link to choose) by Daily, Weekly and by Year-to-Date performances. Also, one can sort by size of the company or by market capitalization. |
| Select Your Default Chart Type: | |||||
| |||||
| Click on stock symbol or name for detailed view. Click on to add stock symbol to your watchlist and to view watchlist. Quick View: Move mouse or cursor over "Daily" to quickly view daily Technical stock chart and over "Weekly" to view weekly Technical stock chart. | |||||

 | DCPH Deciphera Pharmaceuticals, Inc. |
| Sector: Health Care | |
| SubSector: Biotechnology | |
| MarketCap: 2329.95 Millions | |
| Recent Price: 14.69 Smart Investing & Trading Score: 13 | |
| Day Percent Change: 3.23% Day Change: 0.46 | |
| Week Change: -2.39% Year-to-date Change: -8.9% | |
| DCPH Links: Profile News Message Board | |
| Charts:- Daily , Weekly | |
| Add DCPH to Watchlist: View: Get Complete DCPH Trend Analysis ➞ | |
 | MOH Molina Healthcare, Inc. |
| Sector: Health Care | |
| SubSector: Health Care Plans | |
| MarketCap: 7235.6 Millions | |
| Recent Price: 367.52 Smart Investing & Trading Score: 58 | |
| Day Percent Change: 1.82% Day Change: 6.58 | |
| Week Change: -2.4% Year-to-date Change: 1.7% | |
| MOH Links: Profile News Message Board | |
| Charts:- Daily , Weekly | |
| Add MOH to Watchlist: View: Get Complete MOH Trend Analysis ➞ | |
 | COLL Collegium Pharmaceutical, Inc. |
| Sector: Health Care | |
| SubSector: Drugs - Generic | |
| MarketCap: 569.185 Millions | |
| Recent Price: 34.85 Smart Investing & Trading Score: 36 | |
| Day Percent Change: 0.23% Day Change: 0.08 | |
| Week Change: -2.41% Year-to-date Change: 13.2% | |
| COLL Links: Profile News Message Board | |
| Charts:- Daily , Weekly | |
| Add COLL to Watchlist: View: Get Complete COLL Trend Analysis ➞ | |
 | LAKE Lakeland Industries, Inc. |
| Sector: Health Care | |
| SubSector: Medical Instruments & Supplies | |
| MarketCap: 138.16 Millions | |
| Recent Price: 16.40 Smart Investing & Trading Score: 15 | |
| Day Percent Change: -0.06% Day Change: -0.01 | |
| Week Change: -2.44% Year-to-date Change: -11.5% | |
| LAKE Links: Profile News Message Board | |
| Charts:- Daily , Weekly | |
| Add LAKE to Watchlist: View: Get Complete LAKE Trend Analysis ➞ | |
 | ICUI ICU Medical, Inc. |
| Sector: Health Care | |
| SubSector: Medical Instruments & Supplies | |
| MarketCap: 3640.7 Millions | |
| Recent Price: 95.80 Smart Investing & Trading Score: 68 | |
| Day Percent Change: -1.14% Day Change: -1.11 | |
| Week Change: -2.45% Year-to-date Change: -4.0% | |
| ICUI Links: Profile News Message Board | |
| Charts:- Daily , Weekly | |
| Add ICUI to Watchlist: View: Get Complete ICUI Trend Analysis ➞ | |
 | KALV KalVista Pharmaceuticals, Inc. |
| Sector: Health Care | |
| SubSector: Biotechnology | |
| MarketCap: 138.385 Millions | |
| Recent Price: 11.59 Smart Investing & Trading Score: 5 | |
| Day Percent Change: 0.78% Day Change: 0.09 | |
| Week Change: -2.52% Year-to-date Change: -5.4% | |
| KALV Links: Profile News Message Board | |
| Charts:- Daily , Weekly | |
| Add KALV to Watchlist: View: Get Complete KALV Trend Analysis ➞ | |
 | HOLX Hologic, Inc. |
| Sector: Health Care | |
| SubSector: Medical Instruments & Supplies | |
| MarketCap: 9075.2 Millions | |
| Recent Price: 75.37 Smart Investing & Trading Score: 61 | |
| Day Percent Change: 0.36% Day Change: 0.27 | |
| Week Change: -2.53% Year-to-date Change: 5.5% | |
| HOLX Links: Profile News Message Board | |
| Charts:- Daily , Weekly | |
| Add HOLX to Watchlist: View: Get Complete HOLX Trend Analysis ➞ | |
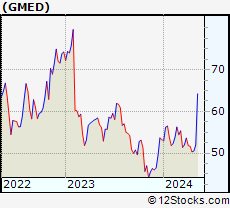 | GMED Globus Medical, Inc. |
| Sector: Health Care | |
| SubSector: Medical Appliances & Equipment | |
| MarketCap: 3965.5 Millions | |
| Recent Price: 50.35 Smart Investing & Trading Score: 10 | |
| Day Percent Change: -0.79% Day Change: -0.40 | |
| Week Change: -2.55% Year-to-date Change: -5.5% | |
| GMED Links: Profile News Message Board | |
| Charts:- Daily , Weekly | |
| Add GMED to Watchlist: View: Get Complete GMED Trend Analysis ➞ | |
 | XRAY DENTSPLY SIRONA Inc. |
| Sector: Health Care | |
| SubSector: Medical Instruments & Supplies | |
| MarketCap: 7746.1 Millions | |
| Recent Price: 30.50 Smart Investing & Trading Score: 10 | |
| Day Percent Change: 0.20% Day Change: 0.06 | |
| Week Change: -2.56% Year-to-date Change: -14.3% | |
| XRAY Links: Profile News Message Board | |
| Charts:- Daily , Weekly | |
| Add XRAY to Watchlist: View: Get Complete XRAY Trend Analysis ➞ | |
 | AVAH Aveanna Healthcare Holdings Inc. |
| Sector: Health Care | |
| SubSector: Medical Care Facilities | |
| MarketCap: 305 Millions | |
| Recent Price: 2.28 Smart Investing & Trading Score: 17 | |
| Day Percent Change: 1.79% Day Change: 0.04 | |
| Week Change: -2.56% Year-to-date Change: -15.4% | |
| AVAH Links: Profile News Message Board | |
| Charts:- Daily , Weekly | |
| Add AVAH to Watchlist: View: Get Complete AVAH Trend Analysis ➞ | |
 | CNMD CONMED Corporation |
| Sector: Health Care | |
| SubSector: Medical Appliances & Equipment | |
| MarketCap: 1589.2 Millions | |
| Recent Price: 72.64 Smart Investing & Trading Score: 17 | |
| Day Percent Change: 2.19% Day Change: 1.56 | |
| Week Change: -2.6% Year-to-date Change: -33.7% | |
| CNMD Links: Profile News Message Board | |
| Charts:- Daily , Weekly | |
| Add CNMD to Watchlist: View: Get Complete CNMD Trend Analysis ➞ | |
 | TCMD Tactile Systems Technology, Inc. |
| Sector: Health Care | |
| SubSector: Medical Instruments & Supplies | |
| MarketCap: 655.96 Millions | |
| Recent Price: 14.40 Smart Investing & Trading Score: 37 | |
| Day Percent Change: 1.80% Day Change: 0.25 | |
| Week Change: -2.6% Year-to-date Change: 0.7% | |
| TCMD Links: Profile News Message Board | |
| Charts:- Daily , Weekly | |
| Add TCMD to Watchlist: View: Get Complete TCMD Trend Analysis ➞ | |
 | TGTX TG Therapeutics, Inc. |
| Sector: Health Care | |
| SubSector: Biotechnology | |
| MarketCap: 1022.85 Millions | |
| Recent Price: 13.79 Smart Investing & Trading Score: 10 | |
| Day Percent Change: -1.43% Day Change: -0.20 | |
| Week Change: -2.61% Year-to-date Change: -19.3% | |
| TGTX Links: Profile News Message Board | |
| Charts:- Daily , Weekly | |
| Add TGTX to Watchlist: View: Get Complete TGTX Trend Analysis ➞ | |
 | IQV IQVIA Holdings Inc. |
| Sector: Health Care | |
| SubSector: Medical Laboratories & Research | |
| MarketCap: 19616.5 Millions | |
| Recent Price: 228.09 Smart Investing & Trading Score: 44 | |
| Day Percent Change: 0.40% Day Change: 0.92 | |
| Week Change: -2.62% Year-to-date Change: -1.4% | |
| IQV Links: Profile News Message Board | |
| Charts:- Daily , Weekly | |
| Add IQV to Watchlist: View: Get Complete IQV Trend Analysis ➞ | |
 | IONS Ionis Pharmaceuticals, Inc. |
| Sector: Health Care | |
| SubSector: Biotechnology | |
| MarketCap: 6725.05 Millions | |
| Recent Price: 40.64 Smart Investing & Trading Score: 20 | |
| Day Percent Change: -0.42% Day Change: -0.17 | |
| Week Change: -2.64% Year-to-date Change: -19.7% | |
| IONS Links: Profile News Message Board | |
| Charts:- Daily , Weekly | |
| Add IONS to Watchlist: View: Get Complete IONS Trend Analysis ➞ | |
 | KYMR Kymera Therapeutics, Inc. |
| Sector: Health Care | |
| SubSector: Biotechnology | |
| MarketCap: 27087 Millions | |
| Recent Price: 34.64 Smart Investing & Trading Score: 56 | |
| Day Percent Change: -1.48% Day Change: -0.52 | |
| Week Change: -2.64% Year-to-date Change: 36.3% | |
| KYMR Links: Profile News Message Board | |
| Charts:- Daily , Weekly | |
| Add KYMR to Watchlist: View: Get Complete KYMR Trend Analysis ➞ | |
 | SUPN Supernus Pharmaceuticals, Inc. |
| Sector: Health Care | |
| SubSector: Drugs - Generic | |
| MarketCap: 833.585 Millions | |
| Recent Price: 29.43 Smart Investing & Trading Score: 54 | |
| Day Percent Change: 1.94% Day Change: 0.56 | |
| Week Change: -2.68% Year-to-date Change: 1.7% | |
| SUPN Links: Profile News Message Board | |
| Charts:- Daily , Weekly | |
| Add SUPN to Watchlist: View: Get Complete SUPN Trend Analysis ➞ | |
 | TBPH Theravance Biopharma, Inc. |
| Sector: Health Care | |
| SubSector: Biotechnology | |
| MarketCap: 1404.55 Millions | |
| Recent Price: 9.35 Smart Investing & Trading Score: 32 | |
| Day Percent Change: 1.63% Day Change: 0.15 | |
| Week Change: -2.71% Year-to-date Change: -16.8% | |
| TBPH Links: Profile News Message Board | |
| Charts:- Daily , Weekly | |
| Add TBPH to Watchlist: View: Get Complete TBPH Trend Analysis ➞ | |
 | GILD Gilead Sciences, Inc. |
| Sector: Health Care | |
| SubSector: Biotechnology | |
| MarketCap: 99485.6 Millions | |
| Recent Price: 66.77 Smart Investing & Trading Score: 10 | |
| Day Percent Change: 0.92% Day Change: 0.61 | |
| Week Change: -2.74% Year-to-date Change: -17.6% | |
| GILD Links: Profile News Message Board | |
| Charts:- Daily , Weekly | |
| Add GILD to Watchlist: View: Get Complete GILD Trend Analysis ➞ | |
 | INMD InMode Ltd. |
| Sector: Health Care | |
| SubSector: Medical Appliances & Equipment | |
| MarketCap: 689.08 Millions | |
| Recent Price: 17.42 Smart Investing & Trading Score: 10 | |
| Day Percent Change: 0.46% Day Change: 0.08 | |
| Week Change: -2.79% Year-to-date Change: -21.7% | |
| INMD Links: Profile News Message Board | |
| Charts:- Daily , Weekly | |
| Add INMD to Watchlist: View: Get Complete INMD Trend Analysis ➞ | |
 | ALNY Alnylam Pharmaceuticals, Inc. |
| Sector: Health Care | |
| SubSector: Biotechnology | |
| MarketCap: 12793.2 Millions | |
| Recent Price: 144.32 Smart Investing & Trading Score: 28 | |
| Day Percent Change: -0.58% Day Change: -0.84 | |
| Week Change: -2.82% Year-to-date Change: -24.6% | |
| ALNY Links: Profile News Message Board | |
| Charts:- Daily , Weekly | |
| Add ALNY to Watchlist: View: Get Complete ALNY Trend Analysis ➞ | |
 | IVA Inventiva S.A. |
| Sector: Health Care | |
| SubSector: Biotechnology | |
| MarketCap: 46487 Millions | |
| Recent Price: 3.45 Smart Investing & Trading Score: 32 | |
| Day Percent Change: 5.18% Day Change: 0.17 | |
| Week Change: -2.82% Year-to-date Change: -23.5% | |
| IVA Links: Profile News Message Board | |
| Charts:- Daily , Weekly | |
| Add IVA to Watchlist: View: Get Complete IVA Trend Analysis ➞ | |
 | INCY Incyte Corporation |
| Sector: Health Care | |
| SubSector: Biotechnology | |
| MarketCap: 15343.2 Millions | |
| Recent Price: 52.30 Smart Investing & Trading Score: 0 | |
| Day Percent Change: -0.98% Day Change: -0.52 | |
| Week Change: -2.88% Year-to-date Change: -16.7% | |
| INCY Links: Profile News Message Board | |
| Charts:- Daily , Weekly | |
| Add INCY to Watchlist: View: Get Complete INCY Trend Analysis ➞ | |
 | EHAB Enhabit, Inc. |
| Sector: Health Care | |
| SubSector: Medical Care Facilities | |
| MarketCap: 569 Millions | |
| Recent Price: 10.10 Smart Investing & Trading Score: 33 | |
| Day Percent Change: -1.94% Day Change: -0.20 | |
| Week Change: -2.88% Year-to-date Change: -2.4% | |
| EHAB Links: Profile News Message Board | |
| Charts:- Daily , Weekly | |
| Add EHAB to Watchlist: View: Get Complete EHAB Trend Analysis ➞ | |
 | PRTC PureTech Health plc |
| Sector: Health Care | |
| SubSector: Biotechnology | |
| MarketCap: 819 Millions | |
| Recent Price: 26.27 Smart Investing & Trading Score: 56 | |
| Day Percent Change: -2.47% Day Change: -0.66 | |
| Week Change: -2.88% Year-to-date Change: 9.9% | |
| PRTC Links: Profile News Message Board | |
| Charts:- Daily , Weekly | |
| Add PRTC to Watchlist: View: Get Complete PRTC Trend Analysis ➞ | |
| For tabular summary view of above stock list: Summary View ➞ 0 - 25 , 25 - 50 , 50 - 75 , 75 - 100 , 100 - 125 , 125 - 150 , 150 - 175 , 175 - 200 , 200 - 225 , 225 - 250 , 250 - 275 , 275 - 300 , 300 - 325 , 325 - 350 , 350 - 375 , 375 - 400 , 400 - 425 , 425 - 450 , 450 - 475 , 475 - 500 , 500 - 525 , 525 - 550 , 550 - 575 , 575 - 600 , 600 - 625 , 625 - 650 , 650 - 675 , 675 - 700 , 700 - 725 | ||
| Click To Change The Sort Order: By Market Cap or Company Size Performance: Year-to-date, Week and Day | |
| Select Chart Type: | ||
|
Best Stocks Today 12Stocks.com |
© 2024 12Stocks.com Terms & Conditions Privacy Contact Us
All Information Provided Only For Education And Not To Be Used For Investing or Trading. See Terms & Conditions


One More Thing ... Get Best Stocks Delivered Daily!
Never Ever Miss A Move With Our Top Ten Stocks Lists
Find Best Stocks In Any Market - Bull or Bear Market
Take A Peek At Our Top Ten Stocks Lists: Daily, Weekly, Year-to-Date & Top Trends
Find Best Stocks In Any Market - Bull or Bear Market
Take A Peek At Our Top Ten Stocks Lists: Daily, Weekly, Year-to-Date & Top Trends
Healthcare Stocks With Best Up Trends [0-bearish to 100-bullish]: Humacyte [100], Lantheus [100], Oscar Health[100], Phibro Animal[95], ALX Oncology[95], Fresenius [95], Vanda [93], Glaukos [93], Geron [93], Mesoblast [88], United [88]
Best Healthcare Stocks Year-to-Date:
Precision BioSciences[2571.23%], Inovio [1798.04%], Assembly Biosciences[1563.21%], Adverum Biotechnologies[1406.38%], Aurora Cannabis[1256.57%], NuCana [1188.03%], Affimed N.V[724%], Corbus [547.68%], Agenus [540.17%], CareMax [423.71%], Zhongchao [412.19%] Best Healthcare Stocks This Week:
NuCana [1601.65%], Regencell Bioscience[37.01%], Venus Concept[25.44%], Vanda [24.03%], Humacyte [23.78%], ALX Oncology[22.49%], Rani [16.67%], ProKidney [16.57%], agilon health[15.56%], Galera [15.36%], UnitedHealth [14.1%] Best Healthcare Stocks Daily:
Hyperfine [10.37%], Genelux [10.37%], Humacyte [9.86%], Emergent Bio[9.68%], agilon health[9.06%], Venus Concept[8.75%], BioXcel [8.63%], Adaptimmune [7.97%], RedHill Biopharma[7.39%], Corbus [7.09%], DermTech [7.05%]