
 Login Sign Up


| |||||
 |  | ||||

| 12Stocks.com Market Intelligence |
Best Financial Stocks
| In a hurry? Financial Stocks Lists: Performance Trends Table, Stock Charts
Sort Financial stocks: Daily, Weekly, Year-to-Date, Market Cap & Trends. Filter Financial stocks list by size:All Financial Large Mid-Range Small & MicroCap |
| 12Stocks.com Financial Stocks Performances & Trends Daily | |||||||||
|
|  The overall Smart Investing & Trading Score is 50 (0-bearish to 100-bullish) which puts Financial sector in short term neutral trend. The Smart Investing & Trading Score from previous trading session is 100 and hence a deterioration of trend.
| ||||||||
Here are the Smart Investing & Trading Scores of the most requested Financial stocks at 12Stocks.com (click stock name for detailed review):
|


| 12Stocks.com: Investing in Financial sector with Stocks | |
|
The following table helps investors and traders sort through current performance and trends (as measured by Smart Investing & Trading Score) of various
stocks in the Financial sector. Quick View: Move mouse or cursor over stock symbol (ticker) to view short-term Technical chart and over stock name to view long term chart. Click on  to add stock symbol to your watchlist and to add stock symbol to your watchlist and  to view watchlist. Click on any ticker or stock name for detailed market intelligence report for that stock. to view watchlist. Click on any ticker or stock name for detailed market intelligence report for that stock. |
12Stocks.com Performance of Stocks in Financial Sector
| Ticker | Stock Name | Watchlist | Category | Recent Price | Smart Investing & Trading Score | Change % | YTD Change% |
| MHF | Western Asset |   | Closed-End Fund - Debt | 6.95 | 80 | -1.24 | 2.71% |
| FFIC | Flushing | | S&L | 13.76 | 100 | -1.25 | -8.03% |
| WAL | Western Alliance | | Regional Banks | 89.55 | 100 | -1.25 | -1.61% |
| USCB | USCB | | Banks - Regional | 17.39 | 60 | -1.25 | -5.50% |
| NREF | NexPoint Real | | REIT | 15.00 | 60 | -1.26 | 1.01% |
| PECO | Phillips Edison | | REIT - Retail | 35.19 | 80 | -1.26 | -7.95% |
| IIPR | Innovative Industrial | | REIT - Industrial | 56.66 | 30 | -1.27 | -16.64% |
| OMF | OneMain | | Credit Services | 61.86 | 90 | -1.27 | 16.57% |
| AIZ | Assurant | | Insurance | 212.85 | 60 | -1.28 | -0.33% |
| SYF | Synchrony | | Credit Services | 75.36 | 70 | -1.28 | 10.74% |
| KIM | Kimco Realty | | REIT - Retail | 22.2 | 70 | -1.29 | 1.27% |
| ACNB | ACNB | | Regional - Southwest Banks | 45.32 | 50 | -1.30 | 12.50% |
| CFFN | Capitol Federal | | S&L | 6.48 | 70 | -1.31 | 6.51% |
| AFL | Aflac | | Insurance | 105.44 | 40 | -1.33 | -0.71% |
| OXSQ | Oxford Square | | Asset Mgmt | 2.19 | 30 | -1.33 | 0.21% |
| MC | Moelis & | | Asset Mgmt | 72.11 | 40 | -1.34 | -3.23% |
| PYPL | PayPal | | Credit Services | 69.25 | 30 | -1.34 | -21.82% |
| COIN | Coinbase Global | | Financial Data & Stock Exchanges | 304.54 | 10 | -1.35 | 20.93% |
| TFC | Truist | | Regional Banks | 46.19 | 70 | -1.35 | 0.62% |
| RNST | Renasant | | Banks | 39.13 | 50 | -1.36 | 5.02% |
| CHMG | Chemung | | Regional Banks | 53.92 | 80 | -1.38 | 5.48% |
| IBTA | iShares iBonds | | Exchange Traded Fund | 26.94 | 20 | -1.38 | -58.41% |
| VNO | Vornado Realty | | REIT - | 38.03 | 60 | -1.39 | -13.96% |
| CSGP | CoStar | | Property Mgmt | 88.24 | 20 | -1.40 | 15.20% |
| EVER | EverQuote | | Regional Banks | 23.25 | 10 | -1.40 | 13.11% |
| For chart view version of above stock list: Chart View ➞ 0 - 25 , 25 - 50 , 50 - 75 , 75 - 100 , 100 - 125 , 125 - 150 , 150 - 175 , 175 - 200 , 200 - 225 , 225 - 250 , 250 - 275 , 275 - 300 , 300 - 325 , 325 - 350 , 350 - 375 , 375 - 400 , 400 - 425 , 425 - 450 , 450 - 475 , 475 - 500 , 500 - 525 , 525 - 550 , 550 - 575 , 575 - 600 , 600 - 625 , 625 - 650 , 650 - 675 , 675 - 700 , 700 - 725 , 725 - 750 , 750 - 775 , 775 - 800 , 800 - 825 , 825 - 850 , 850 - 875 , 875 - 900 , 900 - 925 , 925 - 950 , 950 - 975 , 975 - 1000 , 1000 - 1025 , 1025 - 1050 , 1050 - 1075 , 1075 - 1100 , 1100 - 1125 | ||
 | Click To Change The Sort Order: By Market Cap or Company Size Performance: Year-to-date, Week and Day |  |
|
Get the most comprehensive stock market coverage daily at 12Stocks.com ➞ Best Stocks Today ➞ Best Stocks Weekly ➞ Best Stocks Year-to-Date ➞ Best Stocks Trends ➞  Best Stocks Today 12Stocks.com Best Nasdaq Stocks ➞ Best S&P 500 Stocks ➞ Best Tech Stocks ➞ Best Biotech Stocks ➞ |
| Detailed Overview of Financial Stocks |
| Financial Technical Overview, Leaders & Laggards, Top Financial ETF Funds & Detailed Financial Stocks List, Charts, Trends & More |
| Financial Sector: Technical Analysis, Trends & YTD Performance | |
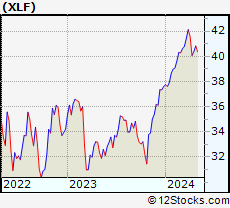
| Financial sector is composed of stocks
from banks, brokers, insurance, REITs
and services subsectors. Financial sector, as represented by XLF, an exchange-traded fund [ETF] that holds basket of Financial stocks (e.g, Bank of America, Goldman Sachs) is up by 4.86% and is currently underperforming the overall market by -1.66% year-to-date. Below is a quick view of Technical charts and trends: |
|
 XLF Weekly Chart |
|
| Long Term Trend: Good | |
| Medium Term Trend: Very Good | |
 XLF Daily Chart |
|
| Short Term Trend: Not Good | |
| Overall Trend Score: 50 | |
| YTD Performance: 4.86% | |
| **Trend Scores & Views Are Only For Educational Purposes And Not For Investing | |
| 12Stocks.com: Top Performing Financial Sector Stocks | ||||||||||||||||||||||||||||||||||||||||||||||||
 The top performing Financial sector stocks year to date are
Now, more recently, over last week, the top performing Financial sector stocks on the move are


|
||||||||||||||||||||||||||||||||||||||||||||||||
| 12Stocks.com: Investing in Financial Sector using Exchange Traded Funds | |
|
The following table shows list of key exchange traded funds (ETF) that
help investors track Financial Index. For detailed view, check out our ETF Funds section of our website. Quick View: Move mouse or cursor over ETF symbol (ticker) to view short-term Technical chart and over ETF name to view long term chart. Click on ticker or stock name for detailed view. Click on to add stock symbol to your watchlist and to view watchlist. |
12Stocks.com List of ETFs that track Financial Index
| Ticker | ETF Name | Watchlist | Recent Price | Smart Investing & Trading Score | Change % | Week % | Year-to-date % |
| XLF | Financial | | 53.59 | 50 | -0.74 | -0.74 | 4.86% |
| IAI | Broker-Dealers & Secs | | 174.18 | 20 | 1.92 | 0.6 | 12.72% |
| IYF | Financials | | 125.73 | 60 | -0.32 | -0.87 | 11.86% |
| IYG | Financial Services | | 89.69 | 60 | -0.27 | -1.08 | 12.5% |
| KRE | Regional Banking | | 65.51 | 70 | -0.4 | -1.29 | 3.78% |
| IXG | Global Financials | | 115.49 | 50 | -0.21 | -0.37 | 20.55% |
| VFH | Financials | | 131.97 | 60 | -0.32 | -0.85 | 9.82% |
| KBE | Bank | | 61.06 | 60 | 4.83 | 5.08 | 4.7% |
| FAS | Financial Bull 3X | | 180.01 | 50 | 4.68 | 5.86 | -1.42% |
| FAZ | Financial Bear 3X | | 4.06 | 60 | -4.81 | -5.67 | -19.26% |
| UYG | Financials | | 99.90 | 50 | 3.1 | 4.07 | 2.59% |
| IAT | Regional Banks | | 54.11 | 70 | -0.53 | -1.12 | 2.84% |
| KIE | Insurance | | 58.86 | 20 | 1.22 | 3.09 | 3.97% |
| PSCF | SmallCap Financials | | 58.90 | 50 | -0.44 | -0.75 | 2.76% |
| EUFN | Europe Financials | | 33.43 | 30 | -0.35 | -0.32 | 51.27% |
| PGF | Financial Preferred | | 14.44 | 60 | -0.14 | 0.35 | 3.03% |
| 12Stocks.com: Charts, Trends, Fundamental Data and Performances of Financial Stocks | |
|
We now take in-depth look at all Financial stocks including charts, multi-period performances and overall trends (as measured by Smart Investing & Trading Score). One can sort Financial stocks (click link to choose) by Daily, Weekly and by Year-to-Date performances. Also, one can sort by size of the company or by market capitalization. |
| Select Your Default Chart Type: | |||||
| |||||
| Click on stock symbol or name for detailed view. Click on to add stock symbol to your watchlist and to view watchlist. Quick View: Move mouse or cursor over "Daily" to quickly view daily Technical stock chart and over "Weekly" to view weekly Technical stock chart. | |||||

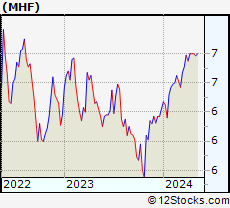 | MHF Western Asset Municipal High Income Fund Inc. |
| Sector: Financials | |
| SubSector: Closed-End Fund - Debt | |
| MarketCap: 139.107 Millions | |
| Recent Price: 6.95 Smart Investing & Trading Score: 80 | |
| Day Percent Change: -1.24% Day Change: -0.09 | |
| Week Change: -1.96% Year-to-date Change: 2.7% | |
| MHF Links: Profile News Message Board | |
| Charts:- Daily , Weekly | |
| Add MHF to Watchlist: View: Get Complete MHF Trend Analysis ➞ | |
 | FFIC Flushing Financial Corporation |
| Sector: Financials | |
| SubSector: Savings & Loans | |
| MarketCap: 336.43 Millions | |
| Recent Price: 13.76 Smart Investing & Trading Score: 100 | |
| Day Percent Change: -1.25% Day Change: -0.16 | |
| Week Change: -2.08% Year-to-date Change: -8.0% | |
| FFIC Links: Profile News Message Board | |
| Charts:- Daily , Weekly | |
| Add FFIC to Watchlist: View: Get Complete FFIC Trend Analysis ➞ | |
 | WAL Western Alliance Bancorporation |
| Sector: Financials | |
| SubSector: Regional - Pacific Banks | |
| MarketCap: 2980.09 Millions | |
| Recent Price: 89.55 Smart Investing & Trading Score: 100 | |
| Day Percent Change: -1.25% Day Change: -1.03 | |
| Week Change: -2.97% Year-to-date Change: -1.6% | |
| WAL Links: Profile News Message Board | |
| Charts:- Daily , Weekly | |
| Add WAL to Watchlist: View: Get Complete WAL Trend Analysis ➞ | |
 | USCB USCB Financial Holdings, Inc. |
| Sector: Financials | |
| SubSector: Banks - Regional | |
| MarketCap: 198 Millions | |
| Recent Price: 17.39 Smart Investing & Trading Score: 60 | |
| Day Percent Change: -1.25% Day Change: -0.21 | |
| Week Change: -4.55% Year-to-date Change: -5.5% | |
| USCB Links: Profile News Message Board | |
| Charts:- Daily , Weekly | |
| Add USCB to Watchlist: View: Get Complete USCB Trend Analysis ➞ | |
 | NREF NexPoint Real Estate Finance, Inc. |
| Sector: Financials | |
| SubSector: REIT Diversified | |
| MarketCap: 97267 Millions | |
| Recent Price: 15.00 Smart Investing & Trading Score: 60 | |
| Day Percent Change: -1.26% Day Change: -0.19 | |
| Week Change: 2.84% Year-to-date Change: 1.0% | |
| NREF Links: Profile News Message Board | |
| Charts:- Daily , Weekly | |
| Add NREF to Watchlist: View: Get Complete NREF Trend Analysis ➞ | |
 | PECO Phillips Edison & Company, Inc. |
| Sector: Financials | |
| SubSector: REIT - Retail | |
| MarketCap: 3920 Millions | |
| Recent Price: 35.19 Smart Investing & Trading Score: 80 | |
| Day Percent Change: -1.26% Day Change: -0.43 | |
| Week Change: -0.38% Year-to-date Change: -8.0% | |
| PECO Links: Profile News Message Board | |
| Charts:- Daily , Weekly | |
| Add PECO to Watchlist: View: Get Complete PECO Trend Analysis ➞ | |
 | IIPR Innovative Industrial Properties, Inc. |
| Sector: Financials | |
| SubSector: REIT - Industrial | |
| MarketCap: 1193.29 Millions | |
| Recent Price: 56.66 Smart Investing & Trading Score: 30 | |
| Day Percent Change: -1.27% Day Change: -0.67 | |
| Week Change: -2.05% Year-to-date Change: -16.6% | |
| IIPR Links: Profile News Message Board | |
| Charts:- Daily , Weekly | |
| Add IIPR to Watchlist: View: Get Complete IIPR Trend Analysis ➞ | |
 | OMF OneMain Holdings, Inc. |
| Sector: Financials | |
| SubSector: Credit Services | |
| MarketCap: 2753.38 Millions | |
| Recent Price: 61.86 Smart Investing & Trading Score: 90 | |
| Day Percent Change: -1.27% Day Change: -0.74 | |
| Week Change: -1.97% Year-to-date Change: 16.6% | |
| OMF Links: Profile News Message Board | |
| Charts:- Daily , Weekly | |
| Add OMF to Watchlist: View: Get Complete OMF Trend Analysis ➞ | |
 | AIZ Assurant, Inc. |
| Sector: Financials | |
| SubSector: Accident & Health Insurance | |
| MarketCap: 6110.3 Millions | |
| Recent Price: 212.85 Smart Investing & Trading Score: 60 | |
| Day Percent Change: -1.28% Day Change: -2.76 | |
| Week Change: -1.28% Year-to-date Change: -0.3% | |
| AIZ Links: Profile News Message Board | |
| Charts:- Daily , Weekly | |
| Add AIZ to Watchlist: View: Get Complete AIZ Trend Analysis ➞ | |
 | SYF Synchrony Financial |
| Sector: Financials | |
| SubSector: Credit Services | |
| MarketCap: 9297.28 Millions | |
| Recent Price: 75.36 Smart Investing & Trading Score: 70 | |
| Day Percent Change: -1.28% Day Change: -0.98 | |
| Week Change: -1.28% Year-to-date Change: 10.7% | |
| SYF Links: Profile News Message Board | |
| Charts:- Daily , Weekly | |
| Add SYF to Watchlist: View: Get Complete SYF Trend Analysis ➞ | |
 | KIM Kimco Realty Corporation |
| Sector: Financials | |
| SubSector: REIT - Retail | |
| MarketCap: 5358.64 Millions | |
| Recent Price: 22.2 Smart Investing & Trading Score: 70 | |
| Day Percent Change: -1.29% Day Change: -0.29 | |
| Week Change: -1.29% Year-to-date Change: 1.3% | |
| KIM Links: Profile News Message Board | |
| Charts:- Daily , Weekly | |
| Add KIM to Watchlist: View: Get Complete KIM Trend Analysis ➞ | |
 | ACNB ACNB Corporation |
| Sector: Financials | |
| SubSector: Regional - Southwest Banks | |
| MarketCap: 231.065 Millions | |
| Recent Price: 45.32 Smart Investing & Trading Score: 50 | |
| Day Percent Change: -1.3% Day Change: -0.58 | |
| Week Change: -2.26% Year-to-date Change: 12.5% | |
| ACNB Links: Profile News Message Board | |
| Charts:- Daily , Weekly | |
| Add ACNB to Watchlist: View: Get Complete ACNB Trend Analysis ➞ | |
 | CFFN Capitol Federal Financial, Inc. |
| Sector: Financials | |
| SubSector: Savings & Loans | |
| MarketCap: 1639.1 Millions | |
| Recent Price: 6.48 Smart Investing & Trading Score: 70 | |
| Day Percent Change: -1.31% Day Change: -0.08 | |
| Week Change: -1.63% Year-to-date Change: 6.5% | |
| CFFN Links: Profile News Message Board | |
| Charts:- Daily , Weekly | |
| Add CFFN to Watchlist: View: Get Complete CFFN Trend Analysis ➞ | |
 | AFL Aflac Incorporated |
| Sector: Financials | |
| SubSector: Accident & Health Insurance | |
| MarketCap: 22706 Millions | |
| Recent Price: 105.44 Smart Investing & Trading Score: 40 | |
| Day Percent Change: -1.33% Day Change: -1.42 | |
| Week Change: -1.33% Year-to-date Change: -0.7% | |
| AFL Links: Profile News Message Board | |
| Charts:- Daily , Weekly | |
| Add AFL to Watchlist: View: Get Complete AFL Trend Analysis ➞ | |
 | OXSQ Oxford Square Capital Corp. |
| Sector: Financials | |
| SubSector: Asset Management | |
| MarketCap: 113.603 Millions | |
| Recent Price: 2.19 Smart Investing & Trading Score: 30 | |
| Day Percent Change: -1.33% Day Change: -0.03 | |
| Week Change: -6.72% Year-to-date Change: 0.2% | |
| OXSQ Links: Profile News Message Board | |
| Charts:- Daily , Weekly | |
| Add OXSQ to Watchlist: View: Get Complete OXSQ Trend Analysis ➞ | |
 | MC Moelis & Company |
| Sector: Financials | |
| SubSector: Asset Management | |
| MarketCap: 1675.93 Millions | |
| Recent Price: 72.11 Smart Investing & Trading Score: 40 | |
| Day Percent Change: -1.34% Day Change: -0.94 | |
| Week Change: -6.68% Year-to-date Change: -3.2% | |
| MC Links: Profile News Message Board | |
| Charts:- Daily , Weekly | |
| Add MC to Watchlist: View: Get Complete MC Trend Analysis ➞ | |
 | PYPL PayPal Holdings, Inc. |
| Sector: Financials | |
| SubSector: Credit Services | |
| MarketCap: 108949 Millions | |
| Recent Price: 69.25 Smart Investing & Trading Score: 30 | |
| Day Percent Change: -1.34% Day Change: -0.94 | |
| Week Change: -1.34% Year-to-date Change: -21.8% | |
| PYPL Links: Profile News Message Board | |
| Charts:- Daily , Weekly | |
| Add PYPL to Watchlist: View: Get Complete PYPL Trend Analysis ➞ | |
 | COIN Coinbase Global, Inc. |
| Sector: Financials | |
| SubSector: Financial Data & Stock Exchanges | |
| MarketCap: 16390 Millions | |
| Recent Price: 304.54 Smart Investing & Trading Score: 10 | |
| Day Percent Change: -1.35% Day Change: -4.11 | |
| Week Change: -7.57% Year-to-date Change: 20.9% | |
| COIN Links: Profile News Message Board | |
| Charts:- Daily , Weekly | |
| Add COIN to Watchlist: View: Get Complete COIN Trend Analysis ➞ | |
 | TFC Truist Financial Corporation |
| Sector: Financials | |
| SubSector: Regional - Southeast Banks | |
| MarketCap: 44928.5 Millions | |
| Recent Price: 46.19 Smart Investing & Trading Score: 70 | |
| Day Percent Change: -1.35% Day Change: -0.63 | |
| Week Change: -1.35% Year-to-date Change: 0.6% | |
| TFC Links: Profile News Message Board | |
| Charts:- Daily , Weekly | |
| Add TFC to Watchlist: View: Get Complete TFC Trend Analysis ➞ | |
 | RNST Renasant Corporation |
| Sector: Financials | |
| SubSector: Money Center Banks | |
| MarketCap: 1279.39 Millions | |
| Recent Price: 39.13 Smart Investing & Trading Score: 50 | |
| Day Percent Change: -1.36% Day Change: -0.51 | |
| Week Change: -2.75% Year-to-date Change: 5.0% | |
| RNST Links: Profile News Message Board | |
| Charts:- Daily , Weekly | |
| Add RNST to Watchlist: View: Get Complete RNST Trend Analysis ➞ | |
 | CHMG Chemung Financial Corporation |
| Sector: Financials | |
| SubSector: Regional - Pacific Banks | |
| MarketCap: 142.229 Millions | |
| Recent Price: 53.92 Smart Investing & Trading Score: 80 | |
| Day Percent Change: -1.38% Day Change: -0.71 | |
| Week Change: -1.66% Year-to-date Change: 5.5% | |
| CHMG Links: Profile News Message Board | |
| Charts:- Daily , Weekly | |
| Add CHMG to Watchlist: View: Get Complete CHMG Trend Analysis ➞ | |
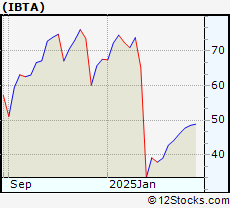 | IBTA iShares iBonds Dec 2021 Term Treasury ETF |
| Sector: Financials | |
| SubSector: Exchange Traded Fund | |
| MarketCap: 60157 Millions | |
| Recent Price: 26.94 Smart Investing & Trading Score: 20 | |
| Day Percent Change: -1.38% Day Change: -0.38 | |
| Week Change: 14.61% Year-to-date Change: -58.4% | |
| IBTA Links: Profile News Message Board | |
| Charts:- Daily , Weekly | |
| Add IBTA to Watchlist: View: Get Complete IBTA Trend Analysis ➞ | |
 | VNO Vornado Realty Trust |
| Sector: Financials | |
| SubSector: REIT - Diversified | |
| MarketCap: 6300.63 Millions | |
| Recent Price: 38.03 Smart Investing & Trading Score: 60 | |
| Day Percent Change: -1.39% Day Change: -0.51 | |
| Week Change: -2.38% Year-to-date Change: -14.0% | |
| VNO Links: Profile News Message Board | |
| Charts:- Daily , Weekly | |
| Add VNO to Watchlist: View: Get Complete VNO Trend Analysis ➞ | |
 | CSGP CoStar Group, Inc. |
| Sector: Financials | |
| SubSector: Property Management | |
| MarketCap: 21454.4 Millions | |
| Recent Price: 88.24 Smart Investing & Trading Score: 20 | |
| Day Percent Change: -1.4% Day Change: -1.25 | |
| Week Change: -1.4% Year-to-date Change: 15.2% | |
| CSGP Links: Profile News Message Board | |
| Charts:- Daily , Weekly | |
| Add CSGP to Watchlist: View: Get Complete CSGP Trend Analysis ➞ | |
 | EVER EverQuote, Inc. |
| Sector: Financials | |
| SubSector: Regional - Southeast Banks | |
| MarketCap: 767.135 Millions | |
| Recent Price: 23.25 Smart Investing & Trading Score: 10 | |
| Day Percent Change: -1.4% Day Change: -0.32 | |
| Week Change: -3.17% Year-to-date Change: 13.1% | |
| EVER Links: Profile News Message Board | |
| Charts:- Daily , Weekly | |
| Add EVER to Watchlist: View: Get Complete EVER Trend Analysis ➞ | |
| For tabular summary view of above stock list: Summary View ➞ 0 - 25 , 25 - 50 , 50 - 75 , 75 - 100 , 100 - 125 , 125 - 150 , 150 - 175 , 175 - 200 , 200 - 225 , 225 - 250 , 250 - 275 , 275 - 300 , 300 - 325 , 325 - 350 , 350 - 375 , 375 - 400 , 400 - 425 , 425 - 450 , 450 - 475 , 475 - 500 , 500 - 525 , 525 - 550 , 550 - 575 , 575 - 600 , 600 - 625 , 625 - 650 , 650 - 675 , 675 - 700 , 700 - 725 , 725 - 750 , 750 - 775 , 775 - 800 , 800 - 825 , 825 - 850 , 850 - 875 , 875 - 900 , 900 - 925 , 925 - 950 , 950 - 975 , 975 - 1000 , 1000 - 1025 , 1025 - 1050 , 1050 - 1075 , 1075 - 1100 , 1100 - 1125 | ||
| Click To Change The Sort Order: By Market Cap or Company Size Performance: Year-to-date, Week and Day | |
| Select Chart Type: | ||
|
Best Stocks Today 12Stocks.com |
© 2025 12Stocks.com Terms & Conditions Privacy Contact Us
All Information Provided Only For Education And Not To Be Used For Investing or Trading. See Terms & Conditions


One More Thing ... Get Best Stocks Delivered Daily!
Never Ever Miss A Move With Our Top Ten Stocks Lists
Find Best Stocks In Any Market - Bull or Bear Market
Take A Peek At Our Top Ten Stocks Lists: Daily, Weekly, Year-to-Date & Top Trends
Find Best Stocks In Any Market - Bull or Bear Market
Take A Peek At Our Top Ten Stocks Lists: Daily, Weekly, Year-to-Date & Top Trends
Financial Stocks With Best Up Trends [0-bearish to 100-bullish]: MicroSectors Gold[100], Offerpad [100], NexGen Energy[100], Healthcare Realty[100], Eagle Point[100], EZCORP [100], Monroe Capital[100], KraneShares Trust[100], Infusive Compounding[100], Credicorp [100], Mexico Fund[100]
Best Financial Stocks Year-to-Date:
ESSA Bancorp[2923.51%], MicroSectors Gold[261.7%], Banco Santander[113.19%], Banco Bilbao[102.83%], Iris Energy[99.49%], Bancolombia S.A[93.5%], Mr. Cooper[91.06%], Heritage Insurance[90.66%], Inter & Co[86.91%], Deutsche Bank[82.36%], X [80.17%] Best Financial Stocks This Week:
Plymouth Industrial[40.4%], SelectQuote [30.15%], Seritage Growth[20.21%], MBIA [18.44%], iShares iBonds[14.61%], Nu [13.82%], TD Ameritrade[11.19%], Cipher Mining[10.9%], Brookfield Business[10.18%], Brookfield Business[9.78%], Stratus Properties[8.94%] Best Financial Stocks Daily:
SelectQuote [41.53%], X [15.73%], CNFinance [7.77%], Aegon N.V[7.64%], AdvisorShares Pure[6.12%], FinVolution [5.55%], Hippo [5.47%], Lufax Holding[5.45%], MicroSectors Gold[4.98%], eHealth [4.65%], TD Ameritrade[3.76%]