
 Login Sign Up


| |||||
 |  | ||||

| 12Stocks.com Market Intelligence |
Best Financial Stocks
| In a hurry? Financial Stocks Lists: Performance Trends Table, Stock Charts
Sort Financial stocks: Daily, Weekly, Year-to-Date, Market Cap & Trends. Filter Financial stocks list by size:All Financial Large Mid-Range Small & MicroCap |
| 12Stocks.com Financial Stocks Performances & Trends Daily | |||||||||
|
|  The overall Smart Investing & Trading Score is 50 (0-bearish to 100-bullish) which puts Financial sector in short term neutral trend. The Smart Investing & Trading Score from previous trading session is 100 and hence a deterioration of trend.
| ||||||||
Here are the Smart Investing & Trading Scores of the most requested Financial stocks at 12Stocks.com (click stock name for detailed review):
|


| 12Stocks.com: Investing in Financial sector with Stocks | |
|
The following table helps investors and traders sort through current performance and trends (as measured by Smart Investing & Trading Score) of various
stocks in the Financial sector. Quick View: Move mouse or cursor over stock symbol (ticker) to view short-term Technical chart and over stock name to view long term chart. Click on  to add stock symbol to your watchlist and to add stock symbol to your watchlist and  to view watchlist. Click on any ticker or stock name for detailed market intelligence report for that stock. to view watchlist. Click on any ticker or stock name for detailed market intelligence report for that stock. |
12Stocks.com Performance of Stocks in Financial Sector
| Ticker | Stock Name | Watchlist | Category | Recent Price | Smart Investing & Trading Score | Change % | YTD Change% |
| BANC | Banc of California |   | Regional Banks | 16.92 | 70 | -1.02 | 2.15% |
| HFWA | Heritage | | Regional Banks | 24.44 | 60 | -1.03 | -2.94% |
| OVLY | Oak Valley | | Regional Banks | 28.49 | 40 | -1.04 | -3.60% |
| BHFAP | Brighthouse | | Life Insurance | 18.10 | 20 | -1.04 | -13.04% |
| CME | CME | | Brokerage | 263.7 | 0 | -1.05 | 12.56% |
| SBCF | Seacoast Banking | | Regional Banks | 31.11 | 60 | -1.05 | 7.46% |
| IX | ORIX | | Credit Services | 25.92 | 90 | -1.05 | 22.07% |
| BX | Blackstone | | Asset Mgmt | 169.58 | 30 | -1.06 | -2.16% |
| CFFI | C&F | | Regional Banks | 71.98 | 80 | -1.06 | -4.23% |
| FMNB | Farmers National | | Regional Banks | 15.18 | 80 | -1.06 | 1.24% |
| HBAN | Huntington Bancshares | | Regional Banks | 17.62 | 70 | -1.07 | 4.55% |
| SUPV | Grupo Supervielle | | Foreign Banks | 7.84 | 0 | -1.07 | -38.05% |
| MS | Morgan Stanley | | Brokerage | 148.85 | 60 | -1.08 | 9.14% |
| EFC | Ellington | | Mortgage | 13.64 | 40 | -1.08 | 21.17% |
| RLJ | RLJ Lodging | | REIT | 7.70 | 50 | -1.08 | -25.14% |
| GBCI | Glacier Bancorp | | Regional Banks | 49.15 | 80 | -1.09 | -8.02% |
| BSRR | Sierra Bancorp | | Regional Banks | 30.66 | 50 | -1.09 | 2.73% |
| CEE | Central and | | Closed-End Fund - Foreign | 16.33 | 30 | -1.09 | 58.61% |
| NDAQ | Nasdaq | | Investments | 93.7 | 20 | -1.10 | 14.53% |
| BLK | BlackRock | | Asset Mgmt | 1114.77 | 30 | -1.10 | 4.77% |
| ATLC | Atlanticus | | Credit Services | 66.70 | 90 | -1.10 | 11.28% |
| STHO | Star | | Financials Services | 8.69 | 46 | -1.10 | -16.75% |
| CBL | CBL & Associates Properties | | REIT - Retail | 31.85 | 60 | -1.11 | 8.91% |
| BXMT | Blackstone Mortgage | | Mortgage | 19.56 | 50 | -1.11 | 13.12% |
| FRT | Federal Realty | | REIT - Retail | 99.42 | 60 | -1.12 | -6.35% |
| For chart view version of above stock list: Chart View ➞ 0 - 25 , 25 - 50 , 50 - 75 , 75 - 100 , 100 - 125 , 125 - 150 , 150 - 175 , 175 - 200 , 200 - 225 , 225 - 250 , 250 - 275 , 275 - 300 , 300 - 325 , 325 - 350 , 350 - 375 , 375 - 400 , 400 - 425 , 425 - 450 , 450 - 475 , 475 - 500 , 500 - 525 , 525 - 550 , 550 - 575 , 575 - 600 , 600 - 625 , 625 - 650 , 650 - 675 , 675 - 700 , 700 - 725 , 725 - 750 , 750 - 775 , 775 - 800 , 800 - 825 , 825 - 850 , 850 - 875 , 875 - 900 , 900 - 925 , 925 - 950 , 950 - 975 , 975 - 1000 , 1000 - 1025 , 1025 - 1050 , 1050 - 1075 , 1075 - 1100 , 1100 - 1125 | ||
 | Click To Change The Sort Order: By Market Cap or Company Size Performance: Year-to-date, Week and Day |  |
|
Get the most comprehensive stock market coverage daily at 12Stocks.com ➞ Best Stocks Today ➞ Best Stocks Weekly ➞ Best Stocks Year-to-Date ➞ Best Stocks Trends ➞  Best Stocks Today 12Stocks.com Best Nasdaq Stocks ➞ Best S&P 500 Stocks ➞ Best Tech Stocks ➞ Best Biotech Stocks ➞ |
| Detailed Overview of Financial Stocks |
| Financial Technical Overview, Leaders & Laggards, Top Financial ETF Funds & Detailed Financial Stocks List, Charts, Trends & More |
| Financial Sector: Technical Analysis, Trends & YTD Performance | |
| Financial sector is composed of stocks
from banks, brokers, insurance, REITs
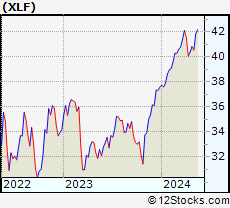
and services subsectors. Financial sector, as represented by XLF, an exchange-traded fund [ETF] that holds basket of Financial stocks (e.g, Bank of America, Goldman Sachs) is up by 4.86% and is currently underperforming the overall market by -1.66% year-to-date. Below is a quick view of Technical charts and trends: |
|
 XLF Weekly Chart |
|
| Long Term Trend: Good | |
| Medium Term Trend: Very Good | |
 XLF Daily Chart |
|
| Short Term Trend: Not Good | |
| Overall Trend Score: 50 | |
| YTD Performance: 4.86% | |
| **Trend Scores & Views Are Only For Educational Purposes And Not For Investing | |
| 12Stocks.com: Top Performing Financial Sector Stocks | ||||||||||||||||||||||||||||||||||||||||||||||||
 The top performing Financial sector stocks year to date are
Now, more recently, over last week, the top performing Financial sector stocks on the move are


|
||||||||||||||||||||||||||||||||||||||||||||||||
| 12Stocks.com: Investing in Financial Sector using Exchange Traded Funds | |
|
The following table shows list of key exchange traded funds (ETF) that
help investors track Financial Index. For detailed view, check out our ETF Funds section of our website. Quick View: Move mouse or cursor over ETF symbol (ticker) to view short-term Technical chart and over ETF name to view long term chart. Click on ticker or stock name for detailed view. Click on to add stock symbol to your watchlist and to view watchlist. |
12Stocks.com List of ETFs that track Financial Index
| Ticker | ETF Name | Watchlist | Recent Price | Smart Investing & Trading Score | Change % | Week % | Year-to-date % |
| XLF | Financial | | 53.59 | 50 | -0.74 | -0.74 | 4.86% |
| IAI | Broker-Dealers & Secs | | 174.18 | 20 | 1.92 | 0.6 | 12.72% |
| IYF | Financials | | 125.73 | 60 | -0.32 | -0.87 | 11.86% |
| IYG | Financial Services | | 89.69 | 60 | -0.27 | -1.08 | 12.5% |
| KRE | Regional Banking | | 65.51 | 70 | -0.4 | -1.29 | 3.78% |
| IXG | Global Financials | | 115.49 | 50 | -0.21 | -0.37 | 20.55% |
| VFH | Financials | | 131.97 | 60 | -0.32 | -0.85 | 9.82% |
| KBE | Bank | | 61.06 | 60 | 4.83 | 5.08 | 4.7% |
| FAS | Financial Bull 3X | | 180.01 | 50 | 4.68 | 5.86 | -1.42% |
| FAZ | Financial Bear 3X | | 4.06 | 60 | -4.81 | -5.67 | -19.26% |
| UYG | Financials | | 99.90 | 50 | 3.1 | 4.07 | 2.59% |
| IAT | Regional Banks | | 54.11 | 70 | -0.53 | -1.12 | 2.84% |
| KIE | Insurance | | 58.86 | 20 | 1.22 | 3.09 | 3.97% |
| PSCF | SmallCap Financials | | 58.90 | 50 | -0.44 | -0.75 | 2.76% |
| EUFN | Europe Financials | | 33.43 | 30 | -0.35 | -0.32 | 51.27% |
| PGF | Financial Preferred | | 14.44 | 60 | -0.14 | 0.35 | 3.03% |
| 12Stocks.com: Charts, Trends, Fundamental Data and Performances of Financial Stocks | |
|
We now take in-depth look at all Financial stocks including charts, multi-period performances and overall trends (as measured by Smart Investing & Trading Score). One can sort Financial stocks (click link to choose) by Daily, Weekly and by Year-to-Date performances. Also, one can sort by size of the company or by market capitalization. |
| Select Your Default Chart Type: | |||||
| |||||
| Click on stock symbol or name for detailed view. Click on to add stock symbol to your watchlist and to view watchlist. Quick View: Move mouse or cursor over "Daily" to quickly view daily Technical stock chart and over "Weekly" to view weekly Technical stock chart. | |||||

 | BANC Banc of California, Inc. |
| Sector: Financials | |
| SubSector: Regional - Pacific Banks | |
| MarketCap: 459.929 Millions | |
| Recent Price: 16.92 Smart Investing & Trading Score: 70 | |
| Day Percent Change: -1.02% Day Change: -0.16 | |
| Week Change: -1.46% Year-to-date Change: 2.2% | |
| BANC Links: Profile News Message Board | |
| Charts:- Daily , Weekly | |
| Add BANC to Watchlist: View: Get Complete BANC Trend Analysis ➞ | |
 | HFWA Heritage Financial Corporation |
| Sector: Financials | |
| SubSector: Regional - Pacific Banks | |
| MarketCap: 752.829 Millions | |
| Recent Price: 24.44 Smart Investing & Trading Score: 60 | |
| Day Percent Change: -1.03% Day Change: -0.24 | |
| Week Change: -3.19% Year-to-date Change: -2.9% | |
| HFWA Links: Profile News Message Board | |
| Charts:- Daily , Weekly | |
| Add HFWA to Watchlist: View: Get Complete HFWA Trend Analysis ➞ | |
 | OVLY Oak Valley Bancorp |
| Sector: Financials | |
| SubSector: Regional - Pacific Banks | |
| MarketCap: 148.429 Millions | |
| Recent Price: 28.49 Smart Investing & Trading Score: 40 | |
| Day Percent Change: -1.04% Day Change: -0.29 | |
| Week Change: -1.39% Year-to-date Change: -3.6% | |
| OVLY Links: Profile News Message Board | |
| Charts:- Daily , Weekly | |
| Add OVLY to Watchlist: View: Get Complete OVLY Trend Analysis ➞ | |
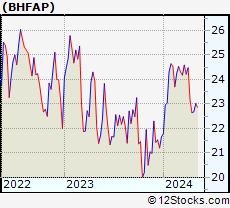 | BHFAP Brighthouse Financial, Inc. |
| Sector: Financials | |
| SubSector: Life Insurance | |
| MarketCap: 1936.76 Millions | |
| Recent Price: 18.10 Smart Investing & Trading Score: 20 | |
| Day Percent Change: -1.04% Day Change: -0.19 | |
| Week Change: 4.19% Year-to-date Change: -13.0% | |
| BHFAP Links: Profile News Message Board | |
| Charts:- Daily , Weekly | |
| Add BHFAP to Watchlist: View: Get Complete BHFAP Trend Analysis ➞ | |
 | CME CME Group Inc. |
| Sector: Financials | |
| SubSector: Investment Brokerage - National | |
| MarketCap: 64145 Millions | |
| Recent Price: 263.7 Smart Investing & Trading Score: 0 | |
| Day Percent Change: -1.05% Day Change: -2.81 | |
| Week Change: -1.05% Year-to-date Change: 12.6% | |
| CME Links: Profile News Message Board | |
| Charts:- Daily , Weekly | |
| Add CME to Watchlist: View: Get Complete CME Trend Analysis ➞ | |
 | SBCF Seacoast Banking Corporation of Florida |
| Sector: Financials | |
| SubSector: Regional - Mid-Atlantic Banks | |
| MarketCap: 881.559 Millions | |
| Recent Price: 31.11 Smart Investing & Trading Score: 60 | |
| Day Percent Change: -1.05% Day Change: -0.31 | |
| Week Change: -0.27% Year-to-date Change: 7.5% | |
| SBCF Links: Profile News Message Board | |
| Charts:- Daily , Weekly | |
| Add SBCF to Watchlist: View: Get Complete SBCF Trend Analysis ➞ | |
 | IX ORIX Corporation |
| Sector: Financials | |
| SubSector: Credit Services | |
| MarketCap: 15483.4 Millions | |
| Recent Price: 25.92 Smart Investing & Trading Score: 90 | |
| Day Percent Change: -1.05% Day Change: -0.27 | |
| Week Change: -0.78% Year-to-date Change: 22.1% | |
| IX Links: Profile News Message Board | |
| Charts:- Daily , Weekly | |
| Add IX to Watchlist: View: Get Complete IX Trend Analysis ➞ | |
 | BX The Blackstone Group Inc. |
| Sector: Financials | |
| SubSector: Asset Management | |
| MarketCap: 50957.7 Millions | |
| Recent Price: 169.58 Smart Investing & Trading Score: 30 | |
| Day Percent Change: -1.06% Day Change: -1.82 | |
| Week Change: -1.06% Year-to-date Change: -2.2% | |
| BX Links: Profile News Message Board | |
| Charts:- Daily , Weekly | |
| Add BX to Watchlist: View: Get Complete BX Trend Analysis ➞ | |
 | CFFI C&F Financial Corporation |
| Sector: Financials | |
| SubSector: Regional - Mid-Atlantic Banks | |
| MarketCap: 145.559 Millions | |
| Recent Price: 71.98 Smart Investing & Trading Score: 80 | |
| Day Percent Change: -1.06% Day Change: -0.72 | |
| Week Change: -3.33% Year-to-date Change: -4.2% | |
| CFFI Links: Profile News Message Board | |
| Charts:- Daily , Weekly | |
| Add CFFI to Watchlist: View: Get Complete CFFI Trend Analysis ➞ | |
 | FMNB Farmers National Banc Corp. |
| Sector: Financials | |
| SubSector: Regional - Midwest Banks | |
| MarketCap: 366.57 Millions | |
| Recent Price: 15.18 Smart Investing & Trading Score: 80 | |
| Day Percent Change: -1.06% Day Change: -0.15 | |
| Week Change: -1.96% Year-to-date Change: 1.2% | |
| FMNB Links: Profile News Message Board | |
| Charts:- Daily , Weekly | |
| Add FMNB to Watchlist: View: Get Complete FMNB Trend Analysis ➞ | |
 | HBAN Huntington Bancshares Incorporated |
| Sector: Financials | |
| SubSector: Regional - Midwest Banks | |
| MarketCap: 8468.1 Millions | |
| Recent Price: 17.62 Smart Investing & Trading Score: 70 | |
| Day Percent Change: -1.07% Day Change: -0.19 | |
| Week Change: -1.07% Year-to-date Change: 4.6% | |
| HBAN Links: Profile News Message Board | |
| Charts:- Daily , Weekly | |
| Add HBAN to Watchlist: View: Get Complete HBAN Trend Analysis ➞ | |
 | SUPV Grupo Supervielle S.A. |
| Sector: Financials | |
| SubSector: Foreign Regional Banks | |
| MarketCap: 224.779 Millions | |
| Recent Price: 7.84 Smart Investing & Trading Score: 0 | |
| Day Percent Change: -1.07% Day Change: -0.1 | |
| Week Change: -6.38% Year-to-date Change: -38.1% | |
| SUPV Links: Profile News Message Board | |
| Charts:- Daily , Weekly | |
| Add SUPV to Watchlist: View: Get Complete SUPV Trend Analysis ➞ | |
 | MS Morgan Stanley |
| Sector: Financials | |
| SubSector: Investment Brokerage - National | |
| MarketCap: 55876.7 Millions | |
| Recent Price: 148.85 Smart Investing & Trading Score: 60 | |
| Day Percent Change: -1.08% Day Change: -1.63 | |
| Week Change: -1.08% Year-to-date Change: 9.1% | |
| MS Links: Profile News Message Board | |
| Charts:- Daily , Weekly | |
| Add MS to Watchlist: View: Get Complete MS Trend Analysis ➞ | |
 | EFC Ellington Financial Inc. |
| Sector: Financials | |
| SubSector: Mortgage Investment | |
| MarketCap: 380.239 Millions | |
| Recent Price: 13.64 Smart Investing & Trading Score: 40 | |
| Day Percent Change: -1.08% Day Change: -0.15 | |
| Week Change: -0.58% Year-to-date Change: 21.2% | |
| EFC Links: Profile News Message Board | |
| Charts:- Daily , Weekly | |
| Add EFC to Watchlist: View: Get Complete EFC Trend Analysis ➞ | |
 | RLJ RLJ Lodging Trust |
| Sector: Financials | |
| SubSector: REIT - Hotel/Motel | |
| MarketCap: 1019.34 Millions | |
| Recent Price: 7.70 Smart Investing & Trading Score: 50 | |
| Day Percent Change: -1.08% Day Change: -0.08 | |
| Week Change: 1.1% Year-to-date Change: -25.1% | |
| RLJ Links: Profile News Message Board | |
| Charts:- Daily , Weekly | |
| Add RLJ to Watchlist: View: Get Complete RLJ Trend Analysis ➞ | |
 | GBCI Glacier Bancorp, Inc. |
| Sector: Financials | |
| SubSector: Regional - Pacific Banks | |
| MarketCap: 3142.89 Millions | |
| Recent Price: 49.15 Smart Investing & Trading Score: 80 | |
| Day Percent Change: -1.09% Day Change: -0.5 | |
| Week Change: -1.49% Year-to-date Change: -8.0% | |
| GBCI Links: Profile News Message Board | |
| Charts:- Daily , Weekly | |
| Add GBCI to Watchlist: View: Get Complete GBCI Trend Analysis ➞ | |
 | BSRR Sierra Bancorp |
| Sector: Financials | |
| SubSector: Regional - Pacific Banks | |
| MarketCap: 256.929 Millions | |
| Recent Price: 30.66 Smart Investing & Trading Score: 50 | |
| Day Percent Change: -1.09% Day Change: -0.32 | |
| Week Change: -1.9% Year-to-date Change: 2.7% | |
| BSRR Links: Profile News Message Board | |
| Charts:- Daily , Weekly | |
| Add BSRR to Watchlist: View: Get Complete BSRR Trend Analysis ➞ | |
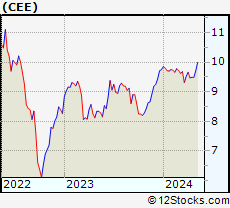 | CEE The Central and Eastern Europe Fund, Inc. |
| Sector: Financials | |
| SubSector: Closed-End Fund - Foreign | |
| MarketCap: 105.847 Millions | |
| Recent Price: 16.33 Smart Investing & Trading Score: 30 | |
| Day Percent Change: -1.09% Day Change: -0.19 | |
| Week Change: 3.22% Year-to-date Change: 58.6% | |
| CEE Links: Profile News Message Board | |
| Charts:- Daily , Weekly | |
| Add CEE to Watchlist: View: Get Complete CEE Trend Analysis ➞ | |
 | NDAQ Nasdaq, Inc. |
| Sector: Financials | |
| SubSector: Diversified Investments | |
| MarketCap: 14885.2 Millions | |
| Recent Price: 93.7 Smart Investing & Trading Score: 20 | |
| Day Percent Change: -1.1% Day Change: -1.04 | |
| Week Change: -1.1% Year-to-date Change: 14.5% | |
| NDAQ Links: Profile News Message Board | |
| Charts:- Daily , Weekly | |
| Add NDAQ to Watchlist: View: Get Complete NDAQ Trend Analysis ➞ | |
 | BLK BlackRock, Inc. |
| Sector: Financials | |
| SubSector: Asset Management | |
| MarketCap: 61284.9 Millions | |
| Recent Price: 1114.77 Smart Investing & Trading Score: 30 | |
| Day Percent Change: -1.1% Day Change: -12.37 | |
| Week Change: -1.1% Year-to-date Change: 4.8% | |
| BLK Links: Profile News Message Board | |
| Charts:- Daily , Weekly | |
| Add BLK to Watchlist: View: Get Complete BLK Trend Analysis ➞ | |
 | ATLC Atlanticus Holdings Corporation |
| Sector: Financials | |
| SubSector: Credit Services | |
| MarketCap: 122.008 Millions | |
| Recent Price: 66.70 Smart Investing & Trading Score: 90 | |
| Day Percent Change: -1.1% Day Change: -0.69 | |
| Week Change: -0.13% Year-to-date Change: 11.3% | |
| ATLC Links: Profile News Message Board | |
| Charts:- Daily , Weekly | |
| Add ATLC to Watchlist: View: Get Complete ATLC Trend Analysis ➞ | |
 | STHO Star Holdings |
| Sector: Financials | |
| SubSector: Financials Services | |
| MarketCap: 195 Millions | |
| Recent Price: 8.69 Smart Investing & Trading Score: 46 | |
| Day Percent Change: -1.1% Day Change: -0.09 | |
| Week Change: 0% Year-to-date Change: -16.8% | |
| STHO Links: Profile News Message Board | |
| Charts:- Daily , Weekly | |
| Add STHO to Watchlist: View: Get Complete STHO Trend Analysis ➞ | |
 | CBL CBL & Associates Properties, Inc. |
| Sector: Financials | |
| SubSector: REIT - Retail | |
| MarketCap: 690 Millions | |
| Recent Price: 31.85 Smart Investing & Trading Score: 60 | |
| Day Percent Change: -1.11% Day Change: -0.34 | |
| Week Change: 0.47% Year-to-date Change: 8.9% | |
| CBL Links: Profile News Message Board | |
| Charts:- Daily , Weekly | |
| Add CBL to Watchlist: View: Get Complete CBL Trend Analysis ➞ | |
 | BXMT Blackstone Mortgage Trust, Inc. |
| Sector: Financials | |
| SubSector: Mortgage Investment | |
| MarketCap: 2820.69 Millions | |
| Recent Price: 19.56 Smart Investing & Trading Score: 50 | |
| Day Percent Change: -1.11% Day Change: -0.21 | |
| Week Change: -1.47% Year-to-date Change: 13.1% | |
| BXMT Links: Profile News Message Board | |
| Charts:- Daily , Weekly | |
| Add BXMT to Watchlist: View: Get Complete BXMT Trend Analysis ➞ | |
 | FRT Federal Realty Investment Trust |
| Sector: Financials | |
| SubSector: REIT - Retail | |
| MarketCap: 5878.64 Millions | |
| Recent Price: 99.42 Smart Investing & Trading Score: 60 | |
| Day Percent Change: -1.12% Day Change: -1.13 | |
| Week Change: -1.12% Year-to-date Change: -6.4% | |
| FRT Links: Profile News Message Board | |
| Charts:- Daily , Weekly | |
| Add FRT to Watchlist: View: Get Complete FRT Trend Analysis ➞ | |
| For tabular summary view of above stock list: Summary View ➞ 0 - 25 , 25 - 50 , 50 - 75 , 75 - 100 , 100 - 125 , 125 - 150 , 150 - 175 , 175 - 200 , 200 - 225 , 225 - 250 , 250 - 275 , 275 - 300 , 300 - 325 , 325 - 350 , 350 - 375 , 375 - 400 , 400 - 425 , 425 - 450 , 450 - 475 , 475 - 500 , 500 - 525 , 525 - 550 , 550 - 575 , 575 - 600 , 600 - 625 , 625 - 650 , 650 - 675 , 675 - 700 , 700 - 725 , 725 - 750 , 750 - 775 , 775 - 800 , 800 - 825 , 825 - 850 , 850 - 875 , 875 - 900 , 900 - 925 , 925 - 950 , 950 - 975 , 975 - 1000 , 1000 - 1025 , 1025 - 1050 , 1050 - 1075 , 1075 - 1100 , 1100 - 1125 | ||
| Click To Change The Sort Order: By Market Cap or Company Size Performance: Year-to-date, Week and Day | |
| Select Chart Type: | ||
|
Best Stocks Today 12Stocks.com |
© 2025 12Stocks.com Terms & Conditions Privacy Contact Us
All Information Provided Only For Education And Not To Be Used For Investing or Trading. See Terms & Conditions


One More Thing ... Get Best Stocks Delivered Daily!
Never Ever Miss A Move With Our Top Ten Stocks Lists
Find Best Stocks In Any Market - Bull or Bear Market
Take A Peek At Our Top Ten Stocks Lists: Daily, Weekly, Year-to-Date & Top Trends
Find Best Stocks In Any Market - Bull or Bear Market
Take A Peek At Our Top Ten Stocks Lists: Daily, Weekly, Year-to-Date & Top Trends
Financial Stocks With Best Up Trends [0-bearish to 100-bullish]: MicroSectors Gold[100], Offerpad [100], NexGen Energy[100], Healthcare Realty[100], Eagle Point[100], EZCORP [100], Monroe Capital[100], KraneShares Trust[100], Infusive Compounding[100], Credicorp [100], Mexico Fund[100]
Best Financial Stocks Year-to-Date:
ESSA Bancorp[2923.51%], MicroSectors Gold[261.7%], Banco Santander[113.19%], Banco Bilbao[102.83%], Iris Energy[99.49%], Bancolombia S.A[93.5%], Mr. Cooper[91.06%], Heritage Insurance[90.66%], Inter & Co[86.91%], Deutsche Bank[82.36%], X [80.17%] Best Financial Stocks This Week:
Plymouth Industrial[40.4%], SelectQuote [30.15%], Seritage Growth[20.21%], MBIA [18.44%], iShares iBonds[14.61%], Nu [13.82%], TD Ameritrade[11.19%], Cipher Mining[10.9%], Brookfield Business[10.18%], Brookfield Business[9.78%], Stratus Properties[8.94%] Best Financial Stocks Daily:
SelectQuote [41.53%], X [15.73%], CNFinance [7.77%], Aegon N.V[7.64%], AdvisorShares Pure[6.12%], FinVolution [5.55%], Hippo [5.47%], Lufax Holding[5.45%], MicroSectors Gold[4.98%], eHealth [4.65%], TD Ameritrade[3.76%]