
 Login Sign Up


| |||||
 |  | ||||

| 12Stocks.com Market Intelligence |
Best Financial Stocks
| In a hurry? Financial Stocks Lists: Performance Trends Table, Stock Charts
Sort Financial stocks: Daily, Weekly, Year-to-Date, Market Cap & Trends. Filter Financial stocks list by size:All Financial Large Mid-Range Small & MicroCap |
| 12Stocks.com Financial Stocks Performances & Trends Daily | |||||||||
|
|  The overall Smart Investing & Trading Score is 90 (0-bearish to 100-bullish) which puts Financial sector in short term bullish trend. The Smart Investing & Trading Score from previous trading session is 60 and an improvement of trend continues.
| ||||||||
Here are the Smart Investing & Trading Scores of the most requested Financial stocks at 12Stocks.com (click stock name for detailed review):
|


| 12Stocks.com: Investing in Financial sector with Stocks | |
|
The following table helps investors and traders sort through current performance and trends (as measured by Smart Investing & Trading Score) of various
stocks in the Financial sector. Quick View: Move mouse or cursor over stock symbol (ticker) to view short-term Technical chart and over stock name to view long term chart. Click on  to add stock symbol to your watchlist and to add stock symbol to your watchlist and  to view watchlist. Click on any ticker or stock name for detailed market intelligence report for that stock. to view watchlist. Click on any ticker or stock name for detailed market intelligence report for that stock. |
12Stocks.com Performance of Stocks in Financial Sector
| Ticker | Stock Name | Watchlist | Category | Recent Price | Trend Score | Change % | YTD Change% |
| ONL | Orion Properties |   | REIT - Office | 2.79 | 51 | 0.74% | -25.04% |
| GRAF | Graf Global | | Shell Companies | 10.53 | 51 | 0.10% | 3.96% |
| CNDA | Concord Acquisition | | SPAC | 11.42 | 50 | 7.63% | 9.28% |
| ALTI | AlTi Global | | Asset Mgmt | 3.92 | 50 | 6.52% | -10.71% |
| JRVR | James River | | Insurance - Specialty | 5.37 | 50 | 5.71% | 10.95% |
| UNIT | Uniti | | REIT - Specialty | 6.88 | 50 | 4.08% | -25.26% |
| NCTY | The9 | | Capital Markets | 10.42 | 50 | 3.99% | -30.35% |
| NRIM | Northrim Bancorp | | Banks - Regional | 92.70 | 50 | 3.60% | 22.36% |
| TOWN | Townebank Portsmouth | | Banks - Regional | 36.39 | 50 | 3.56% | 11.22% |
| AMAL | Amalgamated | | Banks - Regional | 28.73 | 50 | 3.35% | -12.20% |
| TIPT | Tiptree | | Insurance - Specialty | 23.59 | 50 | 3.33% | 16.44% |
| SFBS | ServisFirst Bancshares | | Banks - Regional | 86.06 | 50 | 3.13% | 3.82% |
| FMBH | First Mid | | Banks - Regional | 40.44 | 50 | 3.08% | 13.87% |
| BCBP | BCB Bancorp | | Banks - Regional | 8.88 | 50 | 2.90% | -18.61% |
| FMNB | Farmers National | | Banks - Regional | 15.08 | 50 | 2.72% | 11.08% |
| NETC | Nabors Energy | | SPAC | 11.00 | 50 | 2.52% | 0.00% |
| OSBC | Old Second | | Banks - Regional | 18.36 | 50 | 2.51% | 5.77% |
| PFIS | Peoples | | Banks - Regional | 52.98 | 50 | 2.46% | 10.12% |
| WSFS | WSFS | | Banks - Regional | 55.99 | 50 | 2.40% | 8.76% |
| PLMR | Palomar | | Insurance - Property & Casualty | 117.77 | 50 | 2.36% | 12.83% |
| LOB | Live Oak | | Banks - Regional | 37.25 | 50 | 2.34% | -3.15% |
| IBOC | Bancshares | | Banks - Regional | 70.95 | 50 | 2.32% | 13.95% |
| UBSI | United Bankshares | | Banks - Regional | 37.93 | 50 | 2.07% | 4.59% |
| NMIH | NMI | | Insurance - Specialty | 39.39 | 50 | 1.97% | 7.62% |
| SMBC | Southern Missouri | | Banks - Regional | 56.25 | 50 | 1.92% | 0.35% |
| For chart view version of above stock list: Chart View ➞ 0 - 25 , 25 - 50 , 50 - 75 , 75 - 100 , 100 - 125 , 125 - 150 , 150 - 175 , 175 - 200 , 200 - 225 , 225 - 250 , 250 - 275 , 275 - 300 , 300 - 325 , 325 - 350 , 350 - 375 , 375 - 400 , 400 - 425 , 425 - 450 , 450 - 475 , 475 - 500 , 500 - 525 , 525 - 550 , 550 - 575 , 575 - 600 , 600 - 625 , 625 - 650 , 650 - 675 , 675 - 700 , 700 - 725 , 725 - 750 , 750 - 775 , 775 - 800 , 800 - 825 , 825 - 850 , 850 - 875 , 875 - 900 , 900 - 925 , 925 - 950 , 950 - 975 , 975 - 1000 , 1000 - 1025 , 1025 - 1050 , 1050 - 1075 , 1075 - 1100 , 1100 - 1125 , 1125 - 1150 , 1150 - 1175 , 1175 - 1200 , 1200 - 1225 , 1225 - 1250 , 1250 - 1275 , 1275 - 1300 , 1300 - 1325 , 1325 - 1350 , 1350 - 1375 , 1375 - 1400 , 1400 - 1425 , 1425 - 1450 , 1450 - 1475 , 1475 - 1500 , 1500 - 1525 , 1525 - 1550 | ||
 | Click To Change The Sort Order: By Market Cap or Company Size Performance: Year-to-date, Week and Day |  |
|
Get the most comprehensive stock market coverage daily at 12Stocks.com ➞ Best Stocks Today ➞ Best Stocks Weekly ➞ Best Stocks Year-to-Date ➞ Best Stocks Trends ➞  Best Stocks Today 12Stocks.com Best Nasdaq Stocks ➞ Best S&P 500 Stocks ➞ Best Tech Stocks ➞ Best Biotech Stocks ➞ |
| Detailed Overview of Financial Stocks |
| Financial Technical Overview, Leaders & Laggards, Top Financial ETF Funds & Detailed Financial Stocks List, Charts, Trends & More |
| Financial Sector: Technical Analysis, Trends & YTD Performance | |
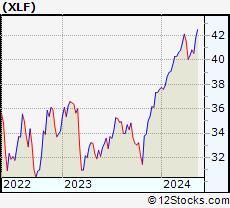
| Financial sector is composed of stocks
from banks, brokers, insurance, REITs
and services subsectors. Financial sector, as represented by XLF, an exchange-traded fund [ETF] that holds basket of Financial stocks (e.g, Bank of America, Goldman Sachs) is up by 13.0735% and is currently underperforming the overall market by -0.7866% year-to-date. Below is a quick view of Technical charts and trends: |
|
 XLF Weekly Chart |
|
| Long Term Trend: Good | |
| Medium Term Trend: Good | |
 XLF Daily Chart |
|
| Short Term Trend: Very Good | |
| Overall Trend Score: 90 | |
| YTD Performance: 13.0735% | |
| **Trend Scores & Views Are Only For Educational Purposes And Not For Investing | |
| 12Stocks.com: Top Performing Financial Sector Stocks | |||||||||||||||||||||||||||||||||||||||||||||||
 The top performing Financial sector stocks year to date are
Now, more recently, over last week, the top performing Financial sector stocks on the move are


|
|||||||||||||||||||||||||||||||||||||||||||||||
| 12Stocks.com: Investing in Financial Sector using Exchange Traded Funds | |
|
The following table shows list of key exchange traded funds (ETF) that
help investors track Financial Index. For detailed view, check out our ETF Funds section of our website. Quick View: Move mouse or cursor over ETF symbol (ticker) to view short-term Technical chart and over ETF name to view long term chart. Click on ticker or stock name for detailed view. Click on to add stock symbol to your watchlist and to view watchlist. |
12Stocks.com List of ETFs that track Financial Index
| Ticker | ETF Name | Watchlist | Recent Price | Smart Investing & Trading Score | Change % | Week % | Year-to-date % |
| CHIX | China Financials | | 10.57 | 20 | 0 | 0 | 0% |
| 12Stocks.com: Charts, Trends, Fundamental Data and Performances of Financial Stocks | |
|
We now take in-depth look at all Financial stocks including charts, multi-period performances and overall trends (as measured by Smart Investing & Trading Score). One can sort Financial stocks (click link to choose) by Daily, Weekly and by Year-to-Date performances. Also, one can sort by size of the company or by market capitalization. |
| Select Your Default Chart Type: | |||||
| |||||
| Click on stock symbol or name for detailed view. Click on to add stock symbol to your watchlist and to view watchlist. Quick View: Move mouse or cursor over "Daily" to quickly view daily Technical stock chart and over "Weekly" to view weekly Technical stock chart. | |||||

 | ONL Orion Properties Inc |
| Sector: Financials | |
| SubSector: REIT - Office | |
| MarketCap: 169.51 Millions | |
| Recent Price: 2.79 Smart Investing & Trading Score: 51 | |
| Day Percent Change: 0.74% Day Change: 0.02 | |
| Week Change: 6.23% Year-to-date Change: -25.0% | |
| ONL Links: Profile News Message Board | |
| Charts:- Daily , Weekly | |
| Add ONL to Watchlist: View: Get Complete ONL Trend Analysis ➞ | |
 | GRAF Graf Global Corp |
| Sector: Financials | |
| SubSector: Shell Companies | |
| MarketCap: 301.59 Millions | |
| Recent Price: 10.53 Smart Investing & Trading Score: 51 | |
| Day Percent Change: 0.1% Day Change: 0.01 | |
| Week Change: 0% Year-to-date Change: 4.0% | |
| GRAF Links: Profile News Message Board | |
| Charts:- Daily , Weekly | |
| Add GRAF to Watchlist: View: Get Complete GRAF Trend Analysis ➞ | |
 | CNDA Concord Acquisition Corp II |
| Sector: Financials | |
| SubSector: SPAC | |
| MarketCap: 359 Millions | |
| Recent Price: 11.42 Smart Investing & Trading Score: 50 | |
| Day Percent Change: 7.63431% Day Change: -9999 | |
| Week Change: 6.92884% Year-to-date Change: 9.3% | |
| CNDA Links: Profile News Message Board | |
| Charts:- Daily , Weekly | |
| Add CNDA to Watchlist: View: Get Complete CNDA Trend Analysis ➞ | |
 | ALTI AlTi Global Inc |
| Sector: Financials | |
| SubSector: Asset Management | |
| MarketCap: 607.14 Millions | |
| Recent Price: 3.92 Smart Investing & Trading Score: 50 | |
| Day Percent Change: 6.52174% Day Change: -0.05 | |
| Week Change: -0.254453% Year-to-date Change: -10.7% | |
| ALTI Links: Profile News Message Board | |
| Charts:- Daily , Weekly | |
| Add ALTI to Watchlist: View: Get Complete ALTI Trend Analysis ➞ | |
 | JRVR James River Group Holdings Ltd |
| Sector: Financials | |
| SubSector: Insurance - Specialty | |
| MarketCap: 249.33 Millions | |
| Recent Price: 5.37 Smart Investing & Trading Score: 50 | |
| Day Percent Change: 5.70866% Day Change: -0.07 | |
| Week Change: 0.373832% Year-to-date Change: 11.0% | |
| JRVR Links: Profile News Message Board | |
| Charts:- Daily , Weekly | |
| Add JRVR to Watchlist: View: Get Complete JRVR Trend Analysis ➞ | |
 | UNIT Uniti Group Inc |
| Sector: Financials | |
| SubSector: REIT - Specialty | |
| MarketCap: 1536.29 Millions | |
| Recent Price: 6.88 Smart Investing & Trading Score: 50 | |
| Day Percent Change: 4.08472% Day Change: -0.13 | |
| Week Change: 0.437956% Year-to-date Change: -25.3% | |
| UNIT Links: Profile News Message Board | |
| Charts:- Daily , Weekly | |
| Add UNIT to Watchlist: View: Get Complete UNIT Trend Analysis ➞ | |
 | NCTY The9 Limited ADR |
| Sector: Financials | |
| SubSector: Capital Markets | |
| MarketCap: 118.27 Millions | |
| Recent Price: 10.42 Smart Investing & Trading Score: 50 | |
| Day Percent Change: 3.99202% Day Change: 0.17 | |
| Week Change: 9.56888% Year-to-date Change: -30.3% | |
| NCTY Links: Profile News Message Board | |
| Charts:- Daily , Weekly | |
| Add NCTY to Watchlist: View: Get Complete NCTY Trend Analysis ➞ | |
 | NRIM Northrim Bancorp, Inc |
| Sector: Financials | |
| SubSector: Banks - Regional | |
| MarketCap: 502.01 Millions | |
| Recent Price: 92.70 Smart Investing & Trading Score: 50 | |
| Day Percent Change: 3.59857% Day Change: -0.16 | |
| Week Change: 0.73897% Year-to-date Change: 22.4% | |
| NRIM Links: Profile News Message Board | |
| Charts:- Daily , Weekly | |
| Add NRIM to Watchlist: View: Get Complete NRIM Trend Analysis ➞ | |
 | TOWN Townebank Portsmouth VA |
| Sector: Financials | |
| SubSector: Banks - Regional | |
| MarketCap: 2944.04 Millions | |
| Recent Price: 36.39 Smart Investing & Trading Score: 50 | |
| Day Percent Change: 3.5572% Day Change: 0.05 | |
| Week Change: 1.19577% Year-to-date Change: 11.2% | |
| TOWN Links: Profile News Message Board | |
| Charts:- Daily , Weekly | |
| Add TOWN to Watchlist: View: Get Complete TOWN Trend Analysis ➞ | |
 | AMAL Amalgamated Financial Corp |
| Sector: Financials | |
| SubSector: Banks - Regional | |
| MarketCap: 869.25 Millions | |
| Recent Price: 28.73 Smart Investing & Trading Score: 50 | |
| Day Percent Change: 3.34532% Day Change: -0.1 | |
| Week Change: 0.9487% Year-to-date Change: -12.2% | |
| AMAL Links: Profile News Message Board | |
| Charts:- Daily , Weekly | |
| Add AMAL to Watchlist: View: Get Complete AMAL Trend Analysis ➞ | |
 | TIPT Tiptree Inc |
| Sector: Financials | |
| SubSector: Insurance - Specialty | |
| MarketCap: 849 Millions | |
| Recent Price: 23.59 Smart Investing & Trading Score: 50 | |
| Day Percent Change: 3.32895% Day Change: 0.44 | |
| Week Change: 0.340281% Year-to-date Change: 16.4% | |
| TIPT Links: Profile News Message Board | |
| Charts:- Daily , Weekly | |
| Add TIPT to Watchlist: View: Get Complete TIPT Trend Analysis ➞ | |
 | SFBS ServisFirst Bancshares Inc |
| Sector: Financials | |
| SubSector: Banks - Regional | |
| MarketCap: 4779.28 Millions | |
| Recent Price: 86.06 Smart Investing & Trading Score: 50 | |
| Day Percent Change: 3.12762% Day Change: -0.2 | |
| Week Change: 2.17262% Year-to-date Change: 3.8% | |
| SFBS Links: Profile News Message Board | |
| Charts:- Daily , Weekly | |
| Add SFBS to Watchlist: View: Get Complete SFBS Trend Analysis ➞ | |
 | FMBH First Mid Bancshares Inc |
| Sector: Financials | |
| SubSector: Banks - Regional | |
| MarketCap: 962.77 Millions | |
| Recent Price: 40.44 Smart Investing & Trading Score: 50 | |
| Day Percent Change: 3.08437% Day Change: -0.33 | |
| Week Change: 1.71026% Year-to-date Change: 13.9% | |
| FMBH Links: Profile News Message Board | |
| Charts:- Daily , Weekly | |
| Add FMBH to Watchlist: View: Get Complete FMBH Trend Analysis ➞ | |
 | BCBP BCB Bancorp Inc (NJ) |
| Sector: Financials | |
| SubSector: Banks - Regional | |
| MarketCap: 150.28 Millions | |
| Recent Price: 8.88 Smart Investing & Trading Score: 50 | |
| Day Percent Change: 2.89687% Day Change: -0.14 | |
| Week Change: 2.30415% Year-to-date Change: -18.6% | |
| BCBP Links: Profile News Message Board | |
| Charts:- Daily , Weekly | |
| Add BCBP to Watchlist: View: Get Complete BCBP Trend Analysis ➞ | |
 | FMNB Farmers National Banc Corp |
| Sector: Financials | |
| SubSector: Banks - Regional | |
| MarketCap: 566.58 Millions | |
| Recent Price: 15.08 Smart Investing & Trading Score: 50 | |
| Day Percent Change: 2.7248% Day Change: -0.15 | |
| Week Change: 0.937082% Year-to-date Change: 11.1% | |
| FMNB Links: Profile News Message Board | |
| Charts:- Daily , Weekly | |
| Add FMNB to Watchlist: View: Get Complete FMNB Trend Analysis ➞ | |
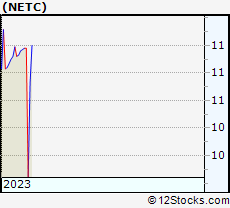 | NETC Nabors Energy Transition Corp. |
| Sector: Financials | |
| SubSector: SPAC | |
| MarketCap: 367 Millions | |
| Recent Price: 11.00 Smart Investing & Trading Score: 50 | |
| Day Percent Change: 2.51631% Day Change: -9999 | |
| Week Change: 9.56175% Year-to-date Change: 0.0% | |
| NETC Links: Profile News Message Board | |
| Charts:- Daily , Weekly | |
| Add NETC to Watchlist: View: Get Complete NETC Trend Analysis ➞ | |
 | OSBC Old Second Bancorporation Inc |
| Sector: Financials | |
| SubSector: Banks - Regional | |
| MarketCap: 970.35 Millions | |
| Recent Price: 18.36 Smart Investing & Trading Score: 50 | |
| Day Percent Change: 2.51256% Day Change: 0.03 | |
| Week Change: 0.382723% Year-to-date Change: 5.8% | |
| OSBC Links: Profile News Message Board | |
| Charts:- Daily , Weekly | |
| Add OSBC to Watchlist: View: Get Complete OSBC Trend Analysis ➞ | |
 | PFIS Peoples Financial Services Corp |
| Sector: Financials | |
| SubSector: Banks - Regional | |
| MarketCap: 529.12 Millions | |
| Recent Price: 52.98 Smart Investing & Trading Score: 50 | |
| Day Percent Change: 2.456% Day Change: -0.33 | |
| Week Change: 1.10687% Year-to-date Change: 10.1% | |
| PFIS Links: Profile News Message Board | |
| Charts:- Daily , Weekly | |
| Add PFIS to Watchlist: View: Get Complete PFIS Trend Analysis ➞ | |
 | WSFS WSFS Financial Corp |
| Sector: Financials | |
| SubSector: Banks - Regional | |
| MarketCap: 3262.44 Millions | |
| Recent Price: 55.99 Smart Investing & Trading Score: 50 | |
| Day Percent Change: 2.39576% Day Change: -0.08 | |
| Week Change: -0.550622% Year-to-date Change: 8.8% | |
| WSFS Links: Profile News Message Board | |
| Charts:- Daily , Weekly | |
| Add WSFS to Watchlist: View: Get Complete WSFS Trend Analysis ➞ | |
 | PLMR Palomar Holdings Inc |
| Sector: Financials | |
| SubSector: Insurance - Property & Casualty | |
| MarketCap: 3299.86 Millions | |
| Recent Price: 117.77 Smart Investing & Trading Score: 50 | |
| Day Percent Change: 2.36419% Day Change: 1.8 | |
| Week Change: -0.783488% Year-to-date Change: 12.8% | |
| PLMR Links: Profile News Message Board | |
| Charts:- Daily , Weekly | |
| Add PLMR to Watchlist: View: Get Complete PLMR Trend Analysis ➞ | |
 | LOB Live Oak Bancshares Inc |
| Sector: Financials | |
| SubSector: Banks - Regional | |
| MarketCap: 1754.25 Millions | |
| Recent Price: 37.25 Smart Investing & Trading Score: 50 | |
| Day Percent Change: 2.33516% Day Change: 0.05 | |
| Week Change: 1.47099% Year-to-date Change: -3.1% | |
| LOB Links: Profile News Message Board | |
| Charts:- Daily , Weekly | |
| Add LOB to Watchlist: View: Get Complete LOB Trend Analysis ➞ | |
 | IBOC International Bancshares Corp |
| Sector: Financials | |
| SubSector: Banks - Regional | |
| MarketCap: 4449.16 Millions | |
| Recent Price: 70.95 Smart Investing & Trading Score: 50 | |
| Day Percent Change: 2.32189% Day Change: 0.4 | |
| Week Change: 0.141143% Year-to-date Change: 14.0% | |
| IBOC Links: Profile News Message Board | |
| Charts:- Daily , Weekly | |
| Add IBOC to Watchlist: View: Get Complete IBOC Trend Analysis ➞ | |
 | UBSI United Bankshares, Inc |
| Sector: Financials | |
| SubSector: Banks - Regional | |
| MarketCap: 5420.84 Millions | |
| Recent Price: 37.93 Smart Investing & Trading Score: 50 | |
| Day Percent Change: 2.07212% Day Change: -0.15 | |
| Week Change: 0.26434% Year-to-date Change: 4.6% | |
| UBSI Links: Profile News Message Board | |
| Charts:- Daily , Weekly | |
| Add UBSI to Watchlist: View: Get Complete UBSI Trend Analysis ➞ | |
 | NMIH NMI Holdings Inc |
| Sector: Financials | |
| SubSector: Insurance - Specialty | |
| MarketCap: 3101.41 Millions | |
| Recent Price: 39.39 Smart Investing & Trading Score: 50 | |
| Day Percent Change: 1.96738% Day Change: -0.07 | |
| Week Change: -0.605602% Year-to-date Change: 7.6% | |
| NMIH Links: Profile News Message Board | |
| Charts:- Daily , Weekly | |
| Add NMIH to Watchlist: View: Get Complete NMIH Trend Analysis ➞ | |
 | SMBC Southern Missouri Bancorp, Inc |
| Sector: Financials | |
| SubSector: Banks - Regional | |
| MarketCap: 648.17 Millions | |
| Recent Price: 56.25 Smart Investing & Trading Score: 50 | |
| Day Percent Change: 1.92064% Day Change: -0.19 | |
| Week Change: -0.495312% Year-to-date Change: 0.4% | |
| SMBC Links: Profile News Message Board | |
| Charts:- Daily , Weekly | |
| Add SMBC to Watchlist: View: Get Complete SMBC Trend Analysis ➞ | |
| For tabular summary view of above stock list: Summary View ➞ 0 - 25 , 25 - 50 , 50 - 75 , 75 - 100 , 100 - 125 , 125 - 150 , 150 - 175 , 175 - 200 , 200 - 225 , 225 - 250 , 250 - 275 , 275 - 300 , 300 - 325 , 325 - 350 , 350 - 375 , 375 - 400 , 400 - 425 , 425 - 450 , 450 - 475 , 475 - 500 , 500 - 525 , 525 - 550 , 550 - 575 , 575 - 600 , 600 - 625 , 625 - 650 , 650 - 675 , 675 - 700 , 700 - 725 , 725 - 750 , 750 - 775 , 775 - 800 , 800 - 825 , 825 - 850 , 850 - 875 , 875 - 900 , 900 - 925 , 925 - 950 , 950 - 975 , 975 - 1000 , 1000 - 1025 , 1025 - 1050 , 1050 - 1075 , 1075 - 1100 , 1100 - 1125 , 1125 - 1150 , 1150 - 1175 , 1175 - 1200 , 1200 - 1225 , 1225 - 1250 , 1250 - 1275 , 1275 - 1300 , 1300 - 1325 , 1325 - 1350 , 1350 - 1375 , 1375 - 1400 , 1400 - 1425 , 1425 - 1450 , 1450 - 1475 , 1475 - 1500 , 1500 - 1525 , 1525 - 1550 | ||
| Click To Change The Sort Order: By Market Cap or Company Size Performance: Year-to-date, Week and Day | |
| Select Chart Type: | ||
|
Best Stocks Today 12Stocks.com |
© 2025 12Stocks.com Terms & Conditions Privacy Contact Us
All Information Provided Only For Education And Not To Be Used For Investing or Trading. See Terms & Conditions


One More Thing ... Get Best Stocks Delivered Daily!
Never Ever Miss A Move With Our Top Ten Stocks Lists
Find Best Stocks In Any Market - Bull or Bear Market
Take A Peek At Our Top Ten Stocks Lists: Daily, Weekly, Year-to-Date & Top Trends
Find Best Stocks In Any Market - Bull or Bear Market
Take A Peek At Our Top Ten Stocks Lists: Daily, Weekly, Year-to-Date & Top Trends
Financial Stocks With Best Up Trends [0-bearish to 100-bullish]: Better Home[100], AMREP Corp[100], PIMCO California[100], Torchmark [100], PIMCO California[100], Triumph Bancorp[100], StepStone [100], Radian [100], National Bank[100], PIMCO Municipal[100], MARA [100]
Best Financial Stocks Year-to-Date:
Insight Select[12384.6%], Oxford Lane[292.479%], Better Home[250.328%], Metalpha Technology[213.274%], Robinhood Markets[206.567%], Cipher Mining[145.528%], Mr. Cooper[133.957%], Banco Santander[130.037%], IHS Holding[117.61%], Deutsche Bank[114.776%], LoanDepot [110.733%] Best Financial Stocks This Week:
Colony Starwood[15929900%], Blackhawk Network[91300%], Macquarie Global[81662.9%], Credit Suisse[63241.6%], Pennsylvania Real[23823%], First Republic[22570.9%], Select ome[14000%], CorEnergy Infrastructure[6797.78%], FedNat Holding[5525%], BlackRock Municipal[5340%], BlackRock MuniYield[3379.04%] Best Financial Stocks Daily:
Better Home[13.3451%], AMREP Corp[11.992%], PIMCO California[11.9545%], Torchmark [11.8363%], Forge Global[11.5409%], PIMCO California[11.4754%], BlackRock Muni[10.8108%], Blackrock MuniYield[10.72%], Triumph Bancorp[10.2661%], StepStone [8.74771%], BlackRock MuniYield[8.15348%]