
 Login Sign Up


| |||||
 |  | ||||

| 12Stocks.com Market Intelligence |
Best Financial Stocks
| In a hurry? Financial Stocks Lists: Performance Trends Table, Stock Charts
Sort Financial stocks: Daily, Weekly, Year-to-Date, Market Cap & Trends. Filter Financial stocks list by size:All Financial Large Mid-Range Small & MicroCap |
| 12Stocks.com Financial Stocks Performances & Trends Daily | |||||||||
|
|  The overall Smart Investing & Trading Score is 50 (0-bearish to 100-bullish) which puts Financial sector in short term neutral trend. The Smart Investing & Trading Score from previous trading session is 100 and hence a deterioration of trend.
| ||||||||
Here are the Smart Investing & Trading Scores of the most requested Financial stocks at 12Stocks.com (click stock name for detailed review):
|


| 12Stocks.com: Investing in Financial sector with Stocks | |
|
The following table helps investors and traders sort through current performance and trends (as measured by Smart Investing & Trading Score) of various
stocks in the Financial sector. Quick View: Move mouse or cursor over stock symbol (ticker) to view short-term Technical chart and over stock name to view long term chart. Click on  to add stock symbol to your watchlist and to add stock symbol to your watchlist and  to view watchlist. Click on any ticker or stock name for detailed market intelligence report for that stock. to view watchlist. Click on any ticker or stock name for detailed market intelligence report for that stock. |
12Stocks.com Performance of Stocks in Financial Sector
| Ticker | Stock Name | Watchlist | Category | Recent Price | Smart Investing & Trading Score | Change % | YTD Change% |
| RGA | Reinsurance |   | Life Insurance | 194.79 | 70 | -0.55 | -9.19% |
| SNV | Synovus | | Regional Banks | 51.61 | 80 | -0.55 | -2.51% |
| SRCE | 1st Source | | Regional Banks | 64.42 | 60 | -0.55 | 6.65% |
| EOS | Eaton Vance | | Closed-End Fund - Equity | 23.99 | 10 | -0.55 | 2.70% |
| ARDC | Ares Dynamic | | Asset Mgmt | 14.71 | 100 | -0.55 | 1.72% |
| LNC | Loln National | | Life Insurance | 42.93 | 70 | -0.56 | 33.69% |
| TCBK | TriCo Bancshares | | Regional Banks | 45.42 | 100 | -0.56 | -1.06% |
| HOMB | Home Bancshares | | Banks | 29.76 | 30 | -0.56 | 2.39% |
| TCPC | BlackRock TCP | | Closed-End Fund - Debt | 7.21 | 50 | -0.56 | -13.08% |
| ALTL | Pacer Lunt | | Exchange Traded Fund | 40.48 | 50 | -0.56 | 5.65% |
| upst | Upstart | | Credit Services | 73.28 | 50 | -0.56 | 3.17% |
| RWAY | Runway Growth | | Credit Services | 10.89 | 63 | -0.56 | 3.26% |
| WDH | Waterdrop | | Insurance - | 1.72 | 20 | -0.56 | 51.92% |
| BBUC | Brookfield Business | | Asset Mgmt | 33.00 | 49 | -0.56 | 38.46% |
| JPM | JPMorgan Chase | | Banks | 299.7 | 70 | -0.57 | 13.36% |
| GABC | German American | | Regional Banks | 41.78 | 60 | -0.57 | 1.44% |
| MA | Mastercard | | Credit Services | 591.87 | 90 | -0.57 | 6.87% |
| EDD | Morgan Stanley | | Closed-End Fund - Debt | 5.32 | 30 | -0.57 | 22.87% |
| JCE | Nuveen Core | | Closed-End Fund - Equity | 15.73 | 80 | -0.58 | 1.21% |
| EMD | Western Asset | | Closed-End Fund - Debt | 10.30 | 50 | -0.58 | 14.74% |
| BHF | Brighthouse | | Life Insurance | 47.26 | 10 | -0.58 | -3.37% |
| BY | Byline Bancorp | | Regional Banks | 28.91 | 60 | -0.58 | -3.93% |
| FULT | Fulton | | Regional Banks | 19.66 | 50 | -0.59 | -2.16% |
| CTBI | Community Trust | | Regional Banks | 58.42 | 60 | -0.59 | 7.23% |
| BMRC | Bank of Marin Bancorp | | Regional Banks | 24.54 | 60 | -0.59 | -0.33% |
| For chart view version of above stock list: Chart View ➞ 0 - 25 , 25 - 50 , 50 - 75 , 75 - 100 , 100 - 125 , 125 - 150 , 150 - 175 , 175 - 200 , 200 - 225 , 225 - 250 , 250 - 275 , 275 - 300 , 300 - 325 , 325 - 350 , 350 - 375 , 375 - 400 , 400 - 425 , 425 - 450 , 450 - 475 , 475 - 500 , 500 - 525 , 525 - 550 , 550 - 575 , 575 - 600 , 600 - 625 , 625 - 650 , 650 - 675 , 675 - 700 , 700 - 725 , 725 - 750 , 750 - 775 , 775 - 800 , 800 - 825 , 825 - 850 , 850 - 875 , 875 - 900 , 900 - 925 , 925 - 950 , 950 - 975 , 975 - 1000 , 1000 - 1025 , 1025 - 1050 , 1050 - 1075 , 1075 - 1100 , 1100 - 1125 | ||
 | Click To Change The Sort Order: By Market Cap or Company Size Performance: Year-to-date, Week and Day |  |
|
Get the most comprehensive stock market coverage daily at 12Stocks.com ➞ Best Stocks Today ➞ Best Stocks Weekly ➞ Best Stocks Year-to-Date ➞ Best Stocks Trends ➞  Best Stocks Today 12Stocks.com Best Nasdaq Stocks ➞ Best S&P 500 Stocks ➞ Best Tech Stocks ➞ Best Biotech Stocks ➞ |
| Detailed Overview of Financial Stocks |
| Financial Technical Overview, Leaders & Laggards, Top Financial ETF Funds & Detailed Financial Stocks List, Charts, Trends & More |
| Financial Sector: Technical Analysis, Trends & YTD Performance | |
| Financial sector is composed of stocks
from banks, brokers, insurance, REITs
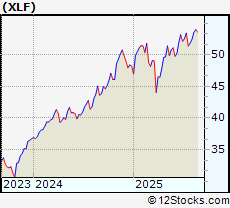
and services subsectors. Financial sector, as represented by XLF, an exchange-traded fund [ETF] that holds basket of Financial stocks (e.g, Bank of America, Goldman Sachs) is up by 4.86% and is currently underperforming the overall market by -1.66% year-to-date. Below is a quick view of Technical charts and trends: |
|
 XLF Weekly Chart |
|
| Long Term Trend: Good | |
| Medium Term Trend: Very Good | |
 XLF Daily Chart |
|
| Short Term Trend: Not Good | |
| Overall Trend Score: 50 | |
| YTD Performance: 4.86% | |
| **Trend Scores & Views Are Only For Educational Purposes And Not For Investing | |
| 12Stocks.com: Top Performing Financial Sector Stocks | ||||||||||||||||||||||||||||||||||||||||||||||||
 The top performing Financial sector stocks year to date are
Now, more recently, over last week, the top performing Financial sector stocks on the move are


|
||||||||||||||||||||||||||||||||||||||||||||||||
| 12Stocks.com: Investing in Financial Sector using Exchange Traded Funds | |
|
The following table shows list of key exchange traded funds (ETF) that
help investors track Financial Index. For detailed view, check out our ETF Funds section of our website. Quick View: Move mouse or cursor over ETF symbol (ticker) to view short-term Technical chart and over ETF name to view long term chart. Click on ticker or stock name for detailed view. Click on to add stock symbol to your watchlist and to view watchlist. |
12Stocks.com List of ETFs that track Financial Index
| Ticker | ETF Name | Watchlist | Recent Price | Smart Investing & Trading Score | Change % | Week % | Year-to-date % |
| XLF | Financial | | 53.59 | 50 | -0.74 | -0.74 | 4.86% |
| IAI | Broker-Dealers & Secs | | 174.18 | 20 | 1.92 | 0.6 | 12.72% |
| IYF | Financials | | 125.73 | 60 | -0.32 | -0.87 | 11.86% |
| IYG | Financial Services | | 89.69 | 60 | -0.27 | -1.08 | 12.5% |
| KRE | Regional Banking | | 65.51 | 70 | -0.4 | -1.29 | 3.78% |
| IXG | Global Financials | | 115.49 | 50 | -0.21 | -0.37 | 20.55% |
| VFH | Financials | | 131.97 | 60 | -0.32 | -0.85 | 9.82% |
| KBE | Bank | | 61.06 | 60 | 4.83 | 5.08 | 4.7% |
| FAS | Financial Bull 3X | | 180.01 | 50 | 4.68 | 5.86 | -1.42% |
| FAZ | Financial Bear 3X | | 4.06 | 60 | -4.81 | -5.67 | -19.26% |
| UYG | Financials | | 99.90 | 50 | 3.1 | 4.07 | 2.59% |
| IAT | Regional Banks | | 54.11 | 70 | -0.53 | -1.12 | 2.84% |
| KIE | Insurance | | 58.86 | 20 | 1.22 | 3.09 | 3.97% |
| PSCF | SmallCap Financials | | 58.90 | 50 | -0.44 | -0.75 | 2.76% |
| EUFN | Europe Financials | | 33.43 | 30 | -0.35 | -0.32 | 51.27% |
| PGF | Financial Preferred | | 14.44 | 60 | -0.14 | 0.35 | 3.03% |
| 12Stocks.com: Charts, Trends, Fundamental Data and Performances of Financial Stocks | |
|
We now take in-depth look at all Financial stocks including charts, multi-period performances and overall trends (as measured by Smart Investing & Trading Score). One can sort Financial stocks (click link to choose) by Daily, Weekly and by Year-to-Date performances. Also, one can sort by size of the company or by market capitalization. |
| Select Your Default Chart Type: | |||||
| |||||
| Click on stock symbol or name for detailed view. Click on to add stock symbol to your watchlist and to view watchlist. Quick View: Move mouse or cursor over "Daily" to quickly view daily Technical stock chart and over "Weekly" to view weekly Technical stock chart. | |||||

 | RGA Reinsurance Group of America, Incorporated |
| Sector: Financials | |
| SubSector: Life Insurance | |
| MarketCap: 4423.36 Millions | |
| Recent Price: 194.79 Smart Investing & Trading Score: 70 | |
| Day Percent Change: -0.55% Day Change: -1.05 | |
| Week Change: 1.13% Year-to-date Change: -9.2% | |
| RGA Links: Profile News Message Board | |
| Charts:- Daily , Weekly | |
| Add RGA to Watchlist: View: Get Complete RGA Trend Analysis ➞ | |
 | SNV Synovus Financial Corp. |
| Sector: Financials | |
| SubSector: Regional - Mid-Atlantic Banks | |
| MarketCap: 2697.29 Millions | |
| Recent Price: 51.61 Smart Investing & Trading Score: 80 | |
| Day Percent Change: -0.55% Day Change: -0.27 | |
| Week Change: -1.25% Year-to-date Change: -2.5% | |
| SNV Links: Profile News Message Board | |
| Charts:- Daily , Weekly | |
| Add SNV to Watchlist: View: Get Complete SNV Trend Analysis ➞ | |
 | SRCE 1st Source Corporation |
| Sector: Financials | |
| SubSector: Regional - Midwest Banks | |
| MarketCap: 784.77 Millions | |
| Recent Price: 64.42 Smart Investing & Trading Score: 60 | |
| Day Percent Change: -0.55% Day Change: -0.34 | |
| Week Change: -0.71% Year-to-date Change: 6.7% | |
| SRCE Links: Profile News Message Board | |
| Charts:- Daily , Weekly | |
| Add SRCE to Watchlist: View: Get Complete SRCE Trend Analysis ➞ | |
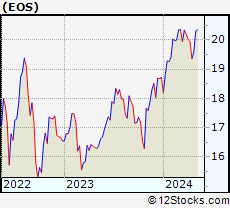 | EOS Eaton Vance Enhanced Equity Income Fund II |
| Sector: Financials | |
| SubSector: Closed-End Fund - Equity | |
| MarketCap: 595.947 Millions | |
| Recent Price: 23.99 Smart Investing & Trading Score: 10 | |
| Day Percent Change: -0.55% Day Change: -0.13 | |
| Week Change: -2.89% Year-to-date Change: 2.7% | |
| EOS Links: Profile News Message Board | |
| Charts:- Daily , Weekly | |
| Add EOS to Watchlist: View: Get Complete EOS Trend Analysis ➞ | |
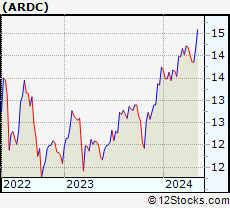 | ARDC Ares Dynamic Credit Allocation Fund, Inc. |
| Sector: Financials | |
| SubSector: Asset Management | |
| MarketCap: 234.803 Millions | |
| Recent Price: 14.71 Smart Investing & Trading Score: 100 | |
| Day Percent Change: -0.55% Day Change: -0.08 | |
| Week Change: 0.07% Year-to-date Change: 1.7% | |
| ARDC Links: Profile News Message Board | |
| Charts:- Daily , Weekly | |
| Add ARDC to Watchlist: View: Get Complete ARDC Trend Analysis ➞ | |
 | LNC Lincoln National Corporation |
| Sector: Financials | |
| SubSector: Life Insurance | |
| MarketCap: 4545.26 Millions | |
| Recent Price: 42.93 Smart Investing & Trading Score: 70 | |
| Day Percent Change: -0.56% Day Change: -0.23 | |
| Week Change: -0.81% Year-to-date Change: 33.7% | |
| LNC Links: Profile News Message Board | |
| Charts:- Daily , Weekly | |
| Add LNC to Watchlist: View: Get Complete LNC Trend Analysis ➞ | |
 | TCBK TriCo Bancshares |
| Sector: Financials | |
| SubSector: Regional - Pacific Banks | |
| MarketCap: 875.129 Millions | |
| Recent Price: 45.42 Smart Investing & Trading Score: 100 | |
| Day Percent Change: -0.56% Day Change: -0.24 | |
| Week Change: -1.87% Year-to-date Change: -1.1% | |
| TCBK Links: Profile News Message Board | |
| Charts:- Daily , Weekly | |
| Add TCBK to Watchlist: View: Get Complete TCBK Trend Analysis ➞ | |
 | HOMB Home Bancshares, Inc. (Conway, AR) |
| Sector: Financials | |
| SubSector: Money Center Banks | |
| MarketCap: 2090.49 Millions | |
| Recent Price: 29.76 Smart Investing & Trading Score: 30 | |
| Day Percent Change: -0.56% Day Change: -0.16 | |
| Week Change: -0.83% Year-to-date Change: 2.4% | |
| HOMB Links: Profile News Message Board | |
| Charts:- Daily , Weekly | |
| Add HOMB to Watchlist: View: Get Complete HOMB Trend Analysis ➞ | |
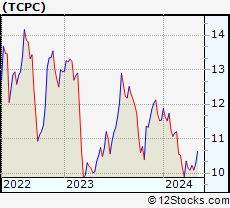 | TCPC BlackRock TCP Capital Corp. |
| Sector: Financials | |
| SubSector: Closed-End Fund - Debt | |
| MarketCap: 397.307 Millions | |
| Recent Price: 7.21 Smart Investing & Trading Score: 50 | |
| Day Percent Change: -0.56% Day Change: -0.04 | |
| Week Change: -0.7% Year-to-date Change: -13.1% | |
| TCPC Links: Profile News Message Board | |
| Charts:- Daily , Weekly | |
| Add TCPC to Watchlist: View: Get Complete TCPC Trend Analysis ➞ | |
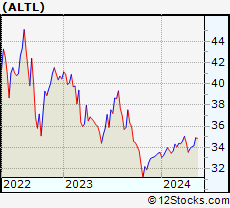 | ALTL Pacer Lunt Large Cap Alternator ETF |
| Sector: Financials | |
| SubSector: Exchange Traded Fund | |
| MarketCap: 60157 Millions | |
| Recent Price: 40.48 Smart Investing & Trading Score: 50 | |
| Day Percent Change: -0.56% Day Change: -0.22 | |
| Week Change: -2.68% Year-to-date Change: 5.7% | |
| ALTL Links: Profile News Message Board | |
| Charts:- Daily , Weekly | |
| Add ALTL to Watchlist: View: Get Complete ALTL Trend Analysis ➞ | |
 | upst Upstart Holdings, Inc. |
| Sector: Financials | |
| SubSector: Credit Services | |
| MarketCap: 2900 Millions | |
| Recent Price: 73.28 Smart Investing & Trading Score: 50 | |
| Day Percent Change: -0.56% Day Change: -0.36 | |
| Week Change: -0.49% Year-to-date Change: 3.2% | |
| upst Links: Profile News Message Board | |
| Charts:- Daily , Weekly | |
| Add upst to Watchlist: View: Get Complete upst Trend Analysis ➞ | |
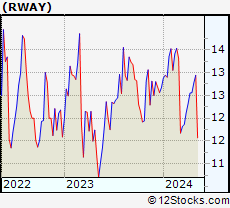 | RWAY Runway Growth Finance Corp. |
| Sector: Financials | |
| SubSector: Credit Services | |
| MarketCap: 497 Millions | |
| Recent Price: 10.89 Smart Investing & Trading Score: 63 | |
| Day Percent Change: -0.56% Day Change: -0.06 | |
| Week Change: -3.47% Year-to-date Change: 3.3% | |
| RWAY Links: Profile News Message Board | |
| Charts:- Daily , Weekly | |
| Add RWAY to Watchlist: View: Get Complete RWAY Trend Analysis ➞ | |
 | WDH Waterdrop Inc. |
| Sector: Financials | |
| SubSector: Insurance - Diversified | |
| MarketCap: 874 Millions | |
| Recent Price: 1.72 Smart Investing & Trading Score: 20 | |
| Day Percent Change: -0.56% Day Change: -0.01 | |
| Week Change: -1.67% Year-to-date Change: 51.9% | |
| WDH Links: Profile News Message Board | |
| Charts:- Daily , Weekly | |
| Add WDH to Watchlist: View: Get Complete WDH Trend Analysis ➞ | |
 | BBUC Brookfield Business Corporation |
| Sector: Financials | |
| SubSector: Asset Management | |
| MarketCap: 1810 Millions | |
| Recent Price: 33.00 Smart Investing & Trading Score: 49 | |
| Day Percent Change: -0.56% Day Change: -0.19 | |
| Week Change: 10.18% Year-to-date Change: 38.5% | |
| BBUC Links: Profile News Message Board | |
| Charts:- Daily , Weekly | |
| Add BBUC to Watchlist: View: Get Complete BBUC Trend Analysis ➞ | |
 | JPM JPMorgan Chase & Co. |
| Sector: Financials | |
| SubSector: Money Center Banks | |
| MarketCap: 279736 Millions | |
| Recent Price: 299.7 Smart Investing & Trading Score: 70 | |
| Day Percent Change: -0.57% Day Change: -1.72 | |
| Week Change: -0.57% Year-to-date Change: 13.4% | |
| JPM Links: Profile News Message Board | |
| Charts:- Daily , Weekly | |
| Add JPM to Watchlist: View: Get Complete JPM Trend Analysis ➞ | |
 | GABC German American Bancorp, Inc. |
| Sector: Financials | |
| SubSector: Regional - Midwest Banks | |
| MarketCap: 731.47 Millions | |
| Recent Price: 41.78 Smart Investing & Trading Score: 60 | |
| Day Percent Change: -0.57% Day Change: -0.23 | |
| Week Change: -0.35% Year-to-date Change: 1.4% | |
| GABC Links: Profile News Message Board | |
| Charts:- Daily , Weekly | |
| Add GABC to Watchlist: View: Get Complete GABC Trend Analysis ➞ | |
 | MA Mastercard Incorporated |
| Sector: Financials | |
| SubSector: Credit Services | |
| MarketCap: 234809 Millions | |
| Recent Price: 591.87 Smart Investing & Trading Score: 90 | |
| Day Percent Change: -0.57% Day Change: -3.42 | |
| Week Change: -0.57% Year-to-date Change: 6.9% | |
| MA Links: Profile News Message Board | |
| Charts:- Daily , Weekly | |
| Add MA to Watchlist: View: Get Complete MA Trend Analysis ➞ | |
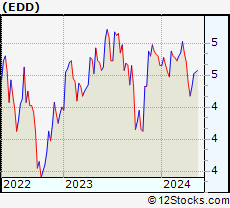 | EDD Morgan Stanley Emerging Markets Domestic Debt Fund, Inc. |
| Sector: Financials | |
| SubSector: Closed-End Fund - Debt | |
| MarketCap: 317.807 Millions | |
| Recent Price: 5.32 Smart Investing & Trading Score: 30 | |
| Day Percent Change: -0.57% Day Change: -0.03 | |
| Week Change: -1.13% Year-to-date Change: 22.9% | |
| EDD Links: Profile News Message Board | |
| Charts:- Daily , Weekly | |
| Add EDD to Watchlist: View: Get Complete EDD Trend Analysis ➞ | |
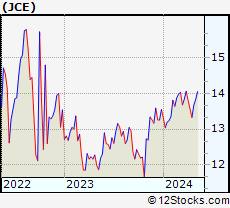 | JCE Nuveen Core Equity Alpha Fund |
| Sector: Financials | |
| SubSector: Closed-End Fund - Equity | |
| MarketCap: 144.747 Millions | |
| Recent Price: 15.73 Smart Investing & Trading Score: 80 | |
| Day Percent Change: -0.58% Day Change: -0.09 | |
| Week Change: -1.56% Year-to-date Change: 1.2% | |
| JCE Links: Profile News Message Board | |
| Charts:- Daily , Weekly | |
| Add JCE to Watchlist: View: Get Complete JCE Trend Analysis ➞ | |
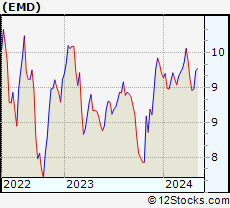 | EMD Western Asset Emerging Markets Debt Fund Inc. |
| Sector: Financials | |
| SubSector: Closed-End Fund - Debt | |
| MarketCap: 595.907 Millions | |
| Recent Price: 10.30 Smart Investing & Trading Score: 50 | |
| Day Percent Change: -0.58% Day Change: -0.06 | |
| Week Change: 0.39% Year-to-date Change: 14.7% | |
| EMD Links: Profile News Message Board | |
| Charts:- Daily , Weekly | |
| Add EMD to Watchlist: View: Get Complete EMD Trend Analysis ➞ | |
 | BHF Brighthouse Financial, Inc. |
| Sector: Financials | |
| SubSector: Life Insurance | |
| MarketCap: 2045.06 Millions | |
| Recent Price: 47.26 Smart Investing & Trading Score: 10 | |
| Day Percent Change: -0.58% Day Change: -0.27 | |
| Week Change: -0.56% Year-to-date Change: -3.4% | |
| BHF Links: Profile News Message Board | |
| Charts:- Daily , Weekly | |
| Add BHF to Watchlist: View: Get Complete BHF Trend Analysis ➞ | |
 | BY Byline Bancorp, Inc. |
| Sector: Financials | |
| SubSector: Regional - Midwest Banks | |
| MarketCap: 381.87 Millions | |
| Recent Price: 28.91 Smart Investing & Trading Score: 60 | |
| Day Percent Change: -0.58% Day Change: -0.16 | |
| Week Change: 0.18% Year-to-date Change: -3.9% | |
| BY Links: Profile News Message Board | |
| Charts:- Daily , Weekly | |
| Add BY to Watchlist: View: Get Complete BY Trend Analysis ➞ | |
 | FULT Fulton Financial Corporation |
| Sector: Financials | |
| SubSector: Regional - Northeast Banks | |
| MarketCap: 2030.89 Millions | |
| Recent Price: 19.66 Smart Investing & Trading Score: 50 | |
| Day Percent Change: -0.59% Day Change: -0.11 | |
| Week Change: -1.54% Year-to-date Change: -2.2% | |
| FULT Links: Profile News Message Board | |
| Charts:- Daily , Weekly | |
| Add FULT to Watchlist: View: Get Complete FULT Trend Analysis ➞ | |
 | CTBI Community Trust Bancorp, Inc. |
| Sector: Financials | |
| SubSector: Regional - Southeast Banks | |
| MarketCap: 608.435 Millions | |
| Recent Price: 58.42 Smart Investing & Trading Score: 60 | |
| Day Percent Change: -0.59% Day Change: -0.33 | |
| Week Change: -0.69% Year-to-date Change: 7.2% | |
| CTBI Links: Profile News Message Board | |
| Charts:- Daily , Weekly | |
| Add CTBI to Watchlist: View: Get Complete CTBI Trend Analysis ➞ | |
 | BMRC Bank of Marin Bancorp |
| Sector: Financials | |
| SubSector: Regional - Pacific Banks | |
| MarketCap: 367.929 Millions | |
| Recent Price: 24.54 Smart Investing & Trading Score: 60 | |
| Day Percent Change: -0.59% Day Change: -0.14 | |
| Week Change: -1.36% Year-to-date Change: -0.3% | |
| BMRC Links: Profile News Message Board | |
| Charts:- Daily , Weekly | |
| Add BMRC to Watchlist: View: Get Complete BMRC Trend Analysis ➞ | |
| For tabular summary view of above stock list: Summary View ➞ 0 - 25 , 25 - 50 , 50 - 75 , 75 - 100 , 100 - 125 , 125 - 150 , 150 - 175 , 175 - 200 , 200 - 225 , 225 - 250 , 250 - 275 , 275 - 300 , 300 - 325 , 325 - 350 , 350 - 375 , 375 - 400 , 400 - 425 , 425 - 450 , 450 - 475 , 475 - 500 , 500 - 525 , 525 - 550 , 550 - 575 , 575 - 600 , 600 - 625 , 625 - 650 , 650 - 675 , 675 - 700 , 700 - 725 , 725 - 750 , 750 - 775 , 775 - 800 , 800 - 825 , 825 - 850 , 850 - 875 , 875 - 900 , 900 - 925 , 925 - 950 , 950 - 975 , 975 - 1000 , 1000 - 1025 , 1025 - 1050 , 1050 - 1075 , 1075 - 1100 , 1100 - 1125 | ||
| Click To Change The Sort Order: By Market Cap or Company Size Performance: Year-to-date, Week and Day | |
| Select Chart Type: | ||
|
Best Stocks Today 12Stocks.com |
© 2025 12Stocks.com Terms & Conditions Privacy Contact Us
All Information Provided Only For Education And Not To Be Used For Investing or Trading. See Terms & Conditions


One More Thing ... Get Best Stocks Delivered Daily!
Never Ever Miss A Move With Our Top Ten Stocks Lists
Find Best Stocks In Any Market - Bull or Bear Market
Take A Peek At Our Top Ten Stocks Lists: Daily, Weekly, Year-to-Date & Top Trends
Find Best Stocks In Any Market - Bull or Bear Market
Take A Peek At Our Top Ten Stocks Lists: Daily, Weekly, Year-to-Date & Top Trends
Financial Stocks With Best Up Trends [0-bearish to 100-bullish]: MicroSectors Gold[100], Offerpad [100], NexGen Energy[100], Healthcare Realty[100], Eagle Point[100], EZCORP [100], Monroe Capital[100], KraneShares Trust[100], Infusive Compounding[100], Credicorp [100], Mexico Fund[100]
Best Financial Stocks Year-to-Date:
ESSA Bancorp[2923.51%], MicroSectors Gold[261.7%], Banco Santander[113.19%], Banco Bilbao[102.83%], Iris Energy[99.49%], Bancolombia S.A[93.5%], Mr. Cooper[91.06%], Heritage Insurance[90.66%], Inter & Co[86.91%], Deutsche Bank[82.36%], X [80.17%] Best Financial Stocks This Week:
Plymouth Industrial[40.4%], SelectQuote [30.15%], Seritage Growth[20.21%], MBIA [18.44%], iShares iBonds[14.61%], Nu [13.82%], TD Ameritrade[11.19%], Cipher Mining[10.9%], Brookfield Business[10.18%], Brookfield Business[9.78%], Stratus Properties[8.94%] Best Financial Stocks Daily:
SelectQuote [41.53%], X [15.73%], CNFinance [7.77%], Aegon N.V[7.64%], AdvisorShares Pure[6.12%], FinVolution [5.55%], Hippo [5.47%], Lufax Holding[5.45%], MicroSectors Gold[4.98%], eHealth [4.65%], TD Ameritrade[3.76%]