
 Login Sign Up


| |||||
 |  | ||||

| 12Stocks.com Market Intelligence |
Best Financial Stocks
| In a hurry? Financial Stocks Lists: Performance Trends Table, Stock Charts
Sort Financial stocks: Daily, Weekly, Year-to-Date, Market Cap & Trends. Filter Financial stocks list by size:All Financial Large Mid-Range Small & MicroCap |
| 12Stocks.com Financial Stocks Performances & Trends Daily | |||||||||
|
|  The overall Smart Investing & Trading Score is 30 (0-bearish to 100-bullish) which puts Financial sector in short term bearish to neutral trend. The Smart Investing & Trading Score from previous trading session is 50 and hence a deterioration of trend.
| ||||||||
Here are the Smart Investing & Trading Scores of the most requested Financial stocks at 12Stocks.com (click stock name for detailed review):
|


| 12Stocks.com: Investing in Financial sector with Stocks | |
|
The following table helps investors and traders sort through current performance and trends (as measured by Smart Investing & Trading Score) of various
stocks in the Financial sector. Quick View: Move mouse or cursor over stock symbol (ticker) to view short-term Technical chart and over stock name to view long term chart. Click on  to add stock symbol to your watchlist and to add stock symbol to your watchlist and  to view watchlist. Click on any ticker or stock name for detailed market intelligence report for that stock. to view watchlist. Click on any ticker or stock name for detailed market intelligence report for that stock. |
12Stocks.com Performance of Stocks in Financial Sector
| Ticker | Stock Name | Watchlist | Category | Recent Price | Smart Investing & Trading Score | Change % | YTD Change% |
| EFSC | Enterprise |   | Banks - Regional | 59.67 | 30 | -1.42 | 8.79% |
| WBS | Webster | | Banks - Regional | 60.62 | 30 | -1.43 | 13.04% |
| PSEC | Prospect Capital | | Asset Mgmt | 2.75 | 0 | -1.43 | -31.04% |
| CBU | Community | | Banks - Regional | 58.03 | 20 | -1.44 | -3.41% |
| FUND | Sprott Focus | | Closed-End Fund - Equity | 8.21 | 30 | -1.44 | 15.80% |
| KW | Kennedy-Wilson | | Real Estate Services | 8.83 | 50 | -1.45 | -8.15% |
| ACGLO | Arch Capital | | Insurance | 21.74 | 40 | -1.45 | 3.69% |
| HR | Healthcare Realty | | REIT | 18.07 | 50 | -1.47 | 14.04% |
| RPT | Rithm Property | | REIT - Mortgage | 2.68 | 50 | -1.47 | -3.76% |
| HCI | HCI | | Insurance - Property & Casualty | 178.14 | 70 | -1.47 | 56.53% |
| CHCT | Community Healthcare | | REIT | 15.45 | 50 | -1.47 | -10.93% |
| NGHCO | National General | | Insurance | 14.09 | 10 | -1.47 | 0.00% |
| PX | P10 | | Asset Mgmt | 11.96 | 30 | -1.48 | -6.27% |
| BIF | Boulder Growth | | Closed-End Fund - Equity | 13.28 | 20 | -1.48 | 0.00% |
| OPP | RiverNorth/DoubleLine Strategic | | Closed-End Fund - Debt | 8.65 | 20 | -1.48 | 10.89% |
| FDUS | Fidus | | Asset Mgmt | 21.15 | 10 | -1.49 | 4.65% |
| RGA | Reinsurance | | Insurance - Reinsurance | 189.32 | 10 | -1.50 | -10.89% |
| WTW | Willis Towers | | Insurance | 333.70 | 60 | -1.50 | 8.52% |
| FBNC | First Bancorp | | Banks - Regional | 54.36 | 40 | -1.50 | 27.78% |
| CRF | Cornerstone Total | | Closed-End Fund - Equity | 7.88 | 40 | -1.50 | 0.40% |
| EQBK | Equity Bancshares | | Banks - Regional | 40.98 | 40 | -1.51 | -0.42% |
| NRO | Neuberger Berman | | Closed-End Fund - Equity | 3.26 | 20 | -1.51 | 3.54% |
| BME | BlackRock Health | | Closed-End Fund - Equity | 36.50 | 30 | -1.51 | 2.26% |
| ESRT | Empire State | | REIT - | 7.79 | 70 | -1.52 | -22.76% |
| ALEX | Alexander & Baldwin | | REIT - Retail | 18.14 | 20 | -1.52 | 5.53% |
| For chart view version of above stock list: Chart View ➞ 0 - 25 , 25 - 50 , 50 - 75 , 75 - 100 , 100 - 125 , 125 - 150 , 150 - 175 , 175 - 200 , 200 - 225 , 225 - 250 , 250 - 275 , 275 - 300 , 300 - 325 , 325 - 350 , 350 - 375 , 375 - 400 , 400 - 425 , 425 - 450 , 450 - 475 , 475 - 500 , 500 - 525 , 525 - 550 , 550 - 575 , 575 - 600 , 600 - 625 , 625 - 650 , 650 - 675 , 675 - 700 , 700 - 725 , 725 - 750 , 750 - 775 , 775 - 800 , 800 - 825 , 825 - 850 , 850 - 875 , 875 - 900 , 900 - 925 , 925 - 950 , 950 - 975 , 975 - 1000 , 1000 - 1025 , 1025 - 1050 , 1050 - 1075 , 1075 - 1100 , 1100 - 1125 , 1125 - 1150 , 1150 - 1175 , 1175 - 1200 , 1200 - 1225 , 1225 - 1250 , 1250 - 1275 , 1275 - 1300 , 1300 - 1325 , 1325 - 1350 , 1350 - 1375 , 1375 - 1400 , 1400 - 1425 , 1425 - 1450 , 1450 - 1475 , 1475 - 1500 , 1500 - 1525 , 1525 - 1550 | ||
 | Click To Change The Sort Order: By Market Cap or Company Size Performance: Year-to-date, Week and Day |  |
|
Get the most comprehensive stock market coverage daily at 12Stocks.com ➞ Best Stocks Today ➞ Best Stocks Weekly ➞ Best Stocks Year-to-Date ➞ Best Stocks Trends ➞  Best Stocks Today 12Stocks.com Best Nasdaq Stocks ➞ Best S&P 500 Stocks ➞ Best Tech Stocks ➞ Best Biotech Stocks ➞ |
| Detailed Overview of Financial Stocks |
| Financial Technical Overview, Leaders & Laggards, Top Financial ETF Funds & Detailed Financial Stocks List, Charts, Trends & More |
| Financial Sector: Technical Analysis, Trends & YTD Performance | |
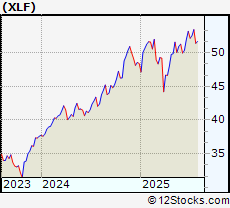
| Financial sector is composed of stocks
from banks, brokers, insurance, REITs
and services subsectors. Financial sector, as represented by XLF, an exchange-traded fund [ETF] that holds basket of Financial stocks (e.g, Bank of America, Goldman Sachs) is up by 12.1335% and is currently underperforming the overall market by -1.2673% year-to-date. Below is a quick view of Technical charts and trends: |
|
 XLF Weekly Chart |
|
| Long Term Trend: Good | |
| Medium Term Trend: Not Good | |
 XLF Daily Chart |
|
| Short Term Trend: Good | |
| Overall Trend Score: 30 | |
| YTD Performance: 12.1335% | |
| **Trend Scores & Views Are Only For Educational Purposes And Not For Investing | |
| 12Stocks.com: Top Performing Financial Sector Stocks | |||||||||||||||||||||||||||||||||||||||||||||||
 The top performing Financial sector stocks year to date are
Now, more recently, over last week, the top performing Financial sector stocks on the move are


|
|||||||||||||||||||||||||||||||||||||||||||||||
| 12Stocks.com: Investing in Financial Sector using Exchange Traded Funds | |
|
The following table shows list of key exchange traded funds (ETF) that
help investors track Financial Index. For detailed view, check out our ETF Funds section of our website. Quick View: Move mouse or cursor over ETF symbol (ticker) to view short-term Technical chart and over ETF name to view long term chart. Click on ticker or stock name for detailed view. Click on to add stock symbol to your watchlist and to view watchlist. |
12Stocks.com List of ETFs that track Financial Index
| Ticker | ETF Name | Watchlist | Recent Price | Smart Investing & Trading Score | Change % | Week % | Year-to-date % |
| CHIX | China Financials | | 10.57 | 20 | 0 | 0 | 0% |
| 12Stocks.com: Charts, Trends, Fundamental Data and Performances of Financial Stocks | |
|
We now take in-depth look at all Financial stocks including charts, multi-period performances and overall trends (as measured by Smart Investing & Trading Score). One can sort Financial stocks (click link to choose) by Daily, Weekly and by Year-to-Date performances. Also, one can sort by size of the company or by market capitalization. |
| Select Your Default Chart Type: | |||||
| |||||
| Click on stock symbol or name for detailed view. Click on to add stock symbol to your watchlist and to view watchlist. Quick View: Move mouse or cursor over "Daily" to quickly view daily Technical stock chart and over "Weekly" to view weekly Technical stock chart. | |||||

 | EFSC Enterprise Financial Services Corp |
| Sector: Financials | |
| SubSector: Banks - Regional | |
| MarketCap: 2244.06 Millions | |
| Recent Price: 59.67 Smart Investing & Trading Score: 30 | |
| Day Percent Change: -1.42078% Day Change: 0.25 | |
| Week Change: -1.64826% Year-to-date Change: 8.8% | |
| EFSC Links: Profile News Message Board | |
| Charts:- Daily , Weekly | |
| Add EFSC to Watchlist: View: Get Complete EFSC Trend Analysis ➞ | |
 | WBS Webster Financial Corp |
| Sector: Financials | |
| SubSector: Banks - Regional | |
| MarketCap: 10305.4 Millions | |
| Recent Price: 60.62 Smart Investing & Trading Score: 30 | |
| Day Percent Change: -1.43089% Day Change: -0.6 | |
| Week Change: -2.24157% Year-to-date Change: 13.0% | |
| WBS Links: Profile News Message Board | |
| Charts:- Daily , Weekly | |
| Add WBS to Watchlist: View: Get Complete WBS Trend Analysis ➞ | |
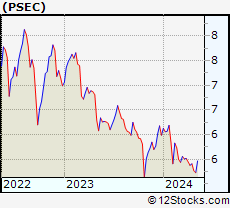 | PSEC Prospect Capital Corp |
| Sector: Financials | |
| SubSector: Asset Management | |
| MarketCap: 1336.17 Millions | |
| Recent Price: 2.75 Smart Investing & Trading Score: 0 | |
| Day Percent Change: -1.43369% Day Change: -0.01 | |
| Week Change: -4.84429% Year-to-date Change: -31.0% | |
| PSEC Links: Profile News Message Board | |
| Charts:- Daily , Weekly | |
| Add PSEC to Watchlist: View: Get Complete PSEC Trend Analysis ➞ | |
 | CBU Community Financial System Inc |
| Sector: Financials | |
| SubSector: Banks - Regional | |
| MarketCap: 3167.2 Millions | |
| Recent Price: 58.03 Smart Investing & Trading Score: 20 | |
| Day Percent Change: -1.44361% Day Change: 0.06 | |
| Week Change: -3.15421% Year-to-date Change: -3.4% | |
| CBU Links: Profile News Message Board | |
| Charts:- Daily , Weekly | |
| Add CBU to Watchlist: View: Get Complete CBU Trend Analysis ➞ | |
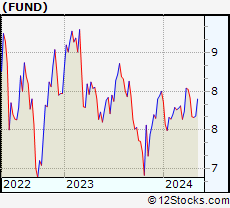 | FUND Sprott Focus Trust Inc |
| Sector: Financials | |
| SubSector: Closed-End Fund - Equity | |
| MarketCap: 246.92 Millions | |
| Recent Price: 8.21 Smart Investing & Trading Score: 30 | |
| Day Percent Change: -1.44058% Day Change: 0.01 | |
| Week Change: 0.366748% Year-to-date Change: 15.8% | |
| FUND Links: Profile News Message Board | |
| Charts:- Daily , Weekly | |
| Add FUND to Watchlist: View: Get Complete FUND Trend Analysis ➞ | |
 | KW Kennedy-Wilson Holdings Inc |
| Sector: Financials | |
| SubSector: Real Estate Services | |
| MarketCap: 1209.38 Millions | |
| Recent Price: 8.83 Smart Investing & Trading Score: 50 | |
| Day Percent Change: -1.45089% Day Change: -0.12 | |
| Week Change: 0.684151% Year-to-date Change: -8.1% | |
| KW Links: Profile News Message Board | |
| Charts:- Daily , Weekly | |
| Add KW to Watchlist: View: Get Complete KW Trend Analysis ➞ | |
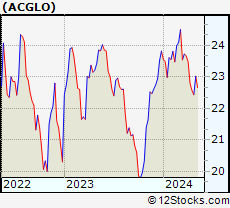 | ACGLO Arch Capital Group Ltd. |
| Sector: Financials | |
| SubSector: Insurance Brokers | |
| MarketCap: 7204.57 Millions | |
| Recent Price: 21.74 Smart Investing & Trading Score: 40 | |
| Day Percent Change: -1.45059% Day Change: -0.04 | |
| Week Change: -0.366636% Year-to-date Change: 3.7% | |
| ACGLO Links: Profile News Message Board | |
| Charts:- Daily , Weekly | |
| Add ACGLO to Watchlist: View: Get Complete ACGLO Trend Analysis ➞ | |
 | HR Healthcare Realty Trust Inc |
| Sector: Financials | |
| SubSector: REIT - Healthcare Facilities | |
| MarketCap: 6350.01 Millions | |
| Recent Price: 18.07 Smart Investing & Trading Score: 50 | |
| Day Percent Change: -1.47219% Day Change: -0.26 | |
| Week Change: 0.055371% Year-to-date Change: 14.0% | |
| HR Links: Profile News Message Board | |
| Charts:- Daily , Weekly | |
| Add HR to Watchlist: View: Get Complete HR Trend Analysis ➞ | |
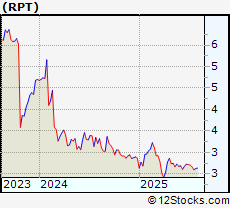 | RPT Rithm Property Trust Inc |
| Sector: Financials | |
| SubSector: REIT - Mortgage | |
| MarketCap: 120.82 Millions | |
| Recent Price: 2.68 Smart Investing & Trading Score: 50 | |
| Day Percent Change: -1.47059% Day Change: -0.01 | |
| Week Change: 0.75188% Year-to-date Change: -3.8% | |
| RPT Links: Profile News Message Board | |
| Charts:- Daily , Weekly | |
| Add RPT to Watchlist: View: Get Complete RPT Trend Analysis ➞ | |
 | HCI HCI Group Inc |
| Sector: Financials | |
| SubSector: Insurance - Property & Casualty | |
| MarketCap: 2210.42 Millions | |
| Recent Price: 178.14 Smart Investing & Trading Score: 70 | |
| Day Percent Change: -1.47124% Day Change: 0.95 | |
| Week Change: 4.44418% Year-to-date Change: 56.5% | |
| HCI Links: Profile News Message Board | |
| Charts:- Daily , Weekly | |
| Add HCI to Watchlist: View: Get Complete HCI Trend Analysis ➞ | |
 | CHCT Community Healthcare Trust Inc |
| Sector: Financials | |
| SubSector: REIT - Healthcare Facilities | |
| MarketCap: 444.22 Millions | |
| Recent Price: 15.45 Smart Investing & Trading Score: 50 | |
| Day Percent Change: -1.46684% Day Change: -0.06 | |
| Week Change: -1.341% Year-to-date Change: -10.9% | |
| CHCT Links: Profile News Message Board | |
| Charts:- Daily , Weekly | |
| Add CHCT to Watchlist: View: Get Complete CHCT Trend Analysis ➞ | |
 | NGHCO National General Holdings Corp. |
| Sector: Financials | |
| SubSector: Property & Casualty Insurance | |
| MarketCap: 1414.12 Millions | |
| Recent Price: 14.09 Smart Investing & Trading Score: 10 | |
| Day Percent Change: -1.46853% Day Change: -9999 | |
| Week Change: -13.9805% Year-to-date Change: 0.0% | |
| NGHCO Links: Profile News Message Board | |
| Charts:- Daily , Weekly | |
| Add NGHCO to Watchlist: View: Get Complete NGHCO Trend Analysis ➞ | |
 | PX P10 Inc |
| Sector: Financials | |
| SubSector: Asset Management | |
| MarketCap: 1321.84 Millions | |
| Recent Price: 11.96 Smart Investing & Trading Score: 30 | |
| Day Percent Change: -1.4827% Day Change: 0.09 | |
| Week Change: -0.581879% Year-to-date Change: -6.3% | |
| PX Links: Profile News Message Board | |
| Charts:- Daily , Weekly | |
| Add PX to Watchlist: View: Get Complete PX Trend Analysis ➞ | |
 | BIF Boulder Growth & Income Fund, Inc. |
| Sector: Financials | |
| SubSector: Closed-End Fund - Equity | |
| MarketCap: 837.847 Millions | |
| Recent Price: 13.28 Smart Investing & Trading Score: 20 | |
| Day Percent Change: -1.48368% Day Change: -9999 | |
| Week Change: 2.31125% Year-to-date Change: 0.0% | |
| BIF Links: Profile News Message Board | |
| Charts:- Daily , Weekly | |
| Add BIF to Watchlist: View: Get Complete BIF Trend Analysis ➞ | |
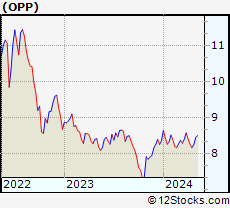 | OPP RiverNorth/DoubleLine Strategic opportunity fund Inc |
| Sector: Financials | |
| SubSector: Closed-End Fund - Debt | |
| MarketCap: 208.33 Millions | |
| Recent Price: 8.65 Smart Investing & Trading Score: 20 | |
| Day Percent Change: -1.48064% Day Change: -0.03 | |
| Week Change: -1.14286% Year-to-date Change: 10.9% | |
| OPP Links: Profile News Message Board | |
| Charts:- Daily , Weekly | |
| Add OPP to Watchlist: View: Get Complete OPP Trend Analysis ➞ | |
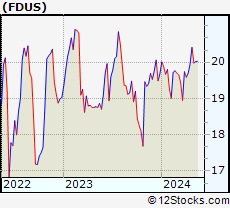 | FDUS Fidus Investment Corp |
| Sector: Financials | |
| SubSector: Asset Management | |
| MarketCap: 756.78 Millions | |
| Recent Price: 21.15 Smart Investing & Trading Score: 10 | |
| Day Percent Change: -1.49045% Day Change: -0.04 | |
| Week Change: -1.12202% Year-to-date Change: 4.6% | |
| FDUS Links: Profile News Message Board | |
| Charts:- Daily , Weekly | |
| Add FDUS to Watchlist: View: Get Complete FDUS Trend Analysis ➞ | |
 | RGA Reinsurance Group Of America, Inc |
| Sector: Financials | |
| SubSector: Insurance - Reinsurance | |
| MarketCap: 12772 Millions | |
| Recent Price: 189.32 Smart Investing & Trading Score: 10 | |
| Day Percent Change: -1.49844% Day Change: -2.36 | |
| Week Change: -2.02857% Year-to-date Change: -10.9% | |
| RGA Links: Profile News Message Board | |
| Charts:- Daily , Weekly | |
| Add RGA to Watchlist: View: Get Complete RGA Trend Analysis ➞ | |
 | WTW Willis Towers Watson Public Limited Co |
| Sector: Financials | |
| SubSector: Insurance Brokers | |
| MarketCap: 32119.6 Millions | |
| Recent Price: 333.70 Smart Investing & Trading Score: 60 | |
| Day Percent Change: -1.50241% Day Change: -4.44 | |
| Week Change: 1.3454% Year-to-date Change: 8.5% | |
| WTW Links: Profile News Message Board | |
| Charts:- Daily , Weekly | |
| Add WTW to Watchlist: View: Get Complete WTW Trend Analysis ➞ | |
 | FBNC First Bancorp |
| Sector: Financials | |
| SubSector: Banks - Regional | |
| MarketCap: 2297.02 Millions | |
| Recent Price: 54.36 Smart Investing & Trading Score: 40 | |
| Day Percent Change: -1.5039% Day Change: -0.39 | |
| Week Change: -1.87726% Year-to-date Change: 27.8% | |
| FBNC Links: Profile News Message Board | |
| Charts:- Daily , Weekly | |
| Add FBNC to Watchlist: View: Get Complete FBNC Trend Analysis ➞ | |
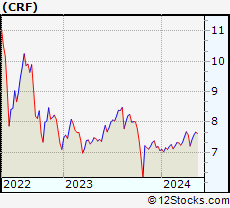 | CRF Cornerstone Total Return Fund |
| Sector: Financials | |
| SubSector: Closed-End Fund - Equity | |
| MarketCap: 937.94 Millions | |
| Recent Price: 7.88 Smart Investing & Trading Score: 40 | |
| Day Percent Change: -1.5% Day Change: -0.02 | |
| Week Change: -0.50505% Year-to-date Change: 0.4% | |
| CRF Links: Profile News Message Board | |
| Charts:- Daily , Weekly | |
| Add CRF to Watchlist: View: Get Complete CRF Trend Analysis ➞ | |
 | EQBK Equity Bancshares Inc |
| Sector: Financials | |
| SubSector: Banks - Regional | |
| MarketCap: 811 Millions | |
| Recent Price: 40.98 Smart Investing & Trading Score: 40 | |
| Day Percent Change: -1.51406% Day Change: -0.59 | |
| Week Change: -2.891% Year-to-date Change: -0.4% | |
| EQBK Links: Profile News Message Board | |
| Charts:- Daily , Weekly | |
| Add EQBK to Watchlist: View: Get Complete EQBK Trend Analysis ➞ | |
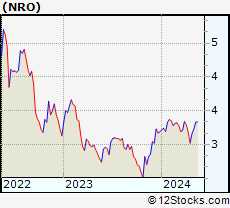 | NRO Neuberger Berman Real Estate Securities Income Fund Inc |
| Sector: Financials | |
| SubSector: Closed-End Fund - Equity | |
| MarketCap: 207.83 Millions | |
| Recent Price: 3.26 Smart Investing & Trading Score: 20 | |
| Day Percent Change: -1.51057% Day Change: -0.01 | |
| Week Change: -0.609756% Year-to-date Change: 3.5% | |
| NRO Links: Profile News Message Board | |
| Charts:- Daily , Weekly | |
| Add NRO to Watchlist: View: Get Complete NRO Trend Analysis ➞ | |
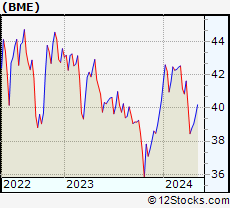 | BME BlackRock Health Sciences Trust |
| Sector: Financials | |
| SubSector: Closed-End Fund - Equity | |
| MarketCap: 479.87 Millions | |
| Recent Price: 36.50 Smart Investing & Trading Score: 30 | |
| Day Percent Change: -1.51106% Day Change: 0.07 | |
| Week Change: -1.69674% Year-to-date Change: 2.3% | |
| BME Links: Profile News Message Board | |
| Charts:- Daily , Weekly | |
| Add BME to Watchlist: View: Get Complete BME Trend Analysis ➞ | |
 | ESRT Empire State Realty Trust Inc |
| Sector: Financials | |
| SubSector: REIT - Diversified | |
| MarketCap: 1351.82 Millions | |
| Recent Price: 7.79 Smart Investing & Trading Score: 70 | |
| Day Percent Change: -1.51707% Day Change: -0.03 | |
| Week Change: -2.25847% Year-to-date Change: -22.8% | |
| ESRT Links: Profile News Message Board | |
| Charts:- Daily , Weekly | |
| Add ESRT to Watchlist: View: Get Complete ESRT Trend Analysis ➞ | |
 | ALEX Alexander & Baldwin Inc |
| Sector: Financials | |
| SubSector: REIT - Retail | |
| MarketCap: 1414.32 Millions | |
| Recent Price: 18.14 Smart Investing & Trading Score: 20 | |
| Day Percent Change: -1.52009% Day Change: 0.02 | |
| Week Change: -6.68724% Year-to-date Change: 5.5% | |
| ALEX Links: Profile News Message Board | |
| Charts:- Daily , Weekly | |
| Add ALEX to Watchlist: View: Get Complete ALEX Trend Analysis ➞ | |
| For tabular summary view of above stock list: Summary View ➞ 0 - 25 , 25 - 50 , 50 - 75 , 75 - 100 , 100 - 125 , 125 - 150 , 150 - 175 , 175 - 200 , 200 - 225 , 225 - 250 , 250 - 275 , 275 - 300 , 300 - 325 , 325 - 350 , 350 - 375 , 375 - 400 , 400 - 425 , 425 - 450 , 450 - 475 , 475 - 500 , 500 - 525 , 525 - 550 , 550 - 575 , 575 - 600 , 600 - 625 , 625 - 650 , 650 - 675 , 675 - 700 , 700 - 725 , 725 - 750 , 750 - 775 , 775 - 800 , 800 - 825 , 825 - 850 , 850 - 875 , 875 - 900 , 900 - 925 , 925 - 950 , 950 - 975 , 975 - 1000 , 1000 - 1025 , 1025 - 1050 , 1050 - 1075 , 1075 - 1100 , 1100 - 1125 , 1125 - 1150 , 1150 - 1175 , 1175 - 1200 , 1200 - 1225 , 1225 - 1250 , 1250 - 1275 , 1275 - 1300 , 1300 - 1325 , 1325 - 1350 , 1350 - 1375 , 1375 - 1400 , 1400 - 1425 , 1425 - 1450 , 1450 - 1475 , 1475 - 1500 , 1500 - 1525 , 1525 - 1550 | ||
| Click To Change The Sort Order: By Market Cap or Company Size Performance: Year-to-date, Week and Day | |
| Select Chart Type: | ||
|
Best Stocks Today 12Stocks.com |
© 2025 12Stocks.com Terms & Conditions Privacy Contact Us
All Information Provided Only For Education And Not To Be Used For Investing or Trading. See Terms & Conditions


One More Thing ... Get Best Stocks Delivered Daily!
Never Ever Miss A Move With Our Top Ten Stocks Lists
Find Best Stocks In Any Market - Bull or Bear Market
Take A Peek At Our Top Ten Stocks Lists: Daily, Weekly, Year-to-Date & Top Trends
Find Best Stocks In Any Market - Bull or Bear Market
Take A Peek At Our Top Ten Stocks Lists: Daily, Weekly, Year-to-Date & Top Trends
Financial Stocks With Best Up Trends [0-bearish to 100-bullish]: PIMCO California[100], Torchmark [100], PIMCO California[100], Triumph Bancorp[100], Lemonade [100], PIMCO Municipal[100], Better Home[100], PIMCO Municipal[100], SuRo Capital[100], Front Yard[100], Atlanticus [100]
Best Financial Stocks Year-to-Date:
Insight Select[12384.6%], Oxford Lane[298.776%], Metalpha Technology[206.195%], Robinhood Markets[191.151%], Better Home[187.309%], Mr. Cooper[133.83%], LoanDepot [131.282%], Banco Santander[130.948%], IHS Holding[125.472%], Cipher Mining[124.638%], Deutsche Bank[123.86%] Best Financial Stocks This Week:
Colony Starwood[15929900%], Blackhawk Network[91300%], Macquarie Global[81662.9%], Credit Suisse[63241.6%], Pennsylvania Real[23823%], First Republic[22570.9%], Select ome[14000%], CorEnergy Infrastructure[6797.78%], FedNat Holding[5525%], BlackRock Municipal[5340%], BlackRock MuniYield[3379.04%] Best Financial Stocks Daily:
PIMCO California[11.9545%], Torchmark [11.8363%], PIMCO California[11.4754%], BlackRock Muni[10.8108%], Blackrock MuniYield[10.72%], Triumph Bancorp[10.2661%], BlackRock MuniYield[8.15348%], Lemonade [7.81815%], Summit [7.79817%], Concord Acquisition[7.63431%], PIMCO Municipal[6.8299%]