
 Login Sign Up


| |||||
 |  | ||||

| 12Stocks.com Market Intelligence |
Best Financial Stocks
| In a hurry? Financial Stocks Lists: Performance Trends Table, Stock Charts
Sort Financial stocks: Daily, Weekly, Year-to-Date, Market Cap & Trends. Filter Financial stocks list by size:All Financial Large Mid-Range Small & MicroCap |
| 12Stocks.com Financial Stocks Performances & Trends Daily | |||||||||
|
|  The overall Smart Investing & Trading Score is 30 (0-bearish to 100-bullish) which puts Financial sector in short term bearish to neutral trend. The Smart Investing & Trading Score from previous trading session is 50 and hence a deterioration of trend.
| ||||||||
Here are the Smart Investing & Trading Scores of the most requested Financial stocks at 12Stocks.com (click stock name for detailed review):
|


| 12Stocks.com: Investing in Financial sector with Stocks | |
|
The following table helps investors and traders sort through current performance and trends (as measured by Smart Investing & Trading Score) of various
stocks in the Financial sector. Quick View: Move mouse or cursor over stock symbol (ticker) to view short-term Technical chart and over stock name to view long term chart. Click on  to add stock symbol to your watchlist and to add stock symbol to your watchlist and  to view watchlist. Click on any ticker or stock name for detailed market intelligence report for that stock. to view watchlist. Click on any ticker or stock name for detailed market intelligence report for that stock. |
12Stocks.com Performance of Stocks in Financial Sector
| Ticker | Stock Name | Watchlist | Category | Recent Price | Smart Investing & Trading Score | Change % | YTD Change% |
| PKBK | Parke Bancorp |   | Banks - Regional | 22.27 | 40 | -0.85 | 15.27% |
| OWL | Blue Owl | | Asset Mgmt | 18.59 | 40 | -0.85 | -19.70% |
| PWP | Perella Weinberg | | Capital Markets | 22.06 | 70 | -0.85 | -5.71% |
| CTBI | Community Trust | | Banks - Regional | 56.42 | 20 | -0.86 | 10.61% |
| IREN | IREN | | Capital Markets | 37.14 | 48 | -0.86 | 99.49% |
| USCB | USCB | | Banks - Regional | 17.21 | 30 | -0.86 | -0.56% |
| RHP | Ryman Hospitality | | REIT - Hotel & Motel | 99.29 | 50 | -0.88 | -0.84% |
| MYF | BlackRock MuniYield | | Closed-End Fund - Debt | 69.05 | 80 | -0.88 | 0.00% |
| PSTL | Postal Realty | | REIT - Office | 15.83 | 40 | -0.88 | 29.63% |
| JXN | Jackson | | Insurance - Life | 96.78 | 36 | -0.88 | 11.76% |
| SIR | Select ome | | REIT - Office | 15.51 | 70 | -0.89 | 0.00% |
| PRAA | PRA | | Credit Services | 16.67 | 40 | -0.89 | -19.04% |
| NASB | NASB | | S&L | 34.50 | 20 | -0.89 | -6.30% |
| TIGR | UP Fintech | | Capital Markets | 11.16 | 20 | -0.89 | 67.07% |
| NRIM | Northrim Bancorp | | Banks - Regional | 90.47 | 0 | -0.90 | 19.42% |
| INBK | First Internet | | Banks - Regional | 24.16 | 40 | -0.90 | -31.25% |
| PLMR | Palomar | | Insurance - Property & Casualty | 115.79 | 10 | -0.90 | 10.93% |
| HHC | Howard Hughes | | Real Estatet | 67.85 | 0 | -0.91 | 0.00% |
| ESS | Essex Property | | REIT | 264.63 | 20 | -0.92 | -3.66% |
| CUBE | CubeSmart | | REIT - Industrial | 40.81 | 40 | -0.92 | 0.54% |
| FUNC | First United | | Banks - Regional | 36.43 | 30 | -0.92 | 11.32% |
| BTA | BlackRock Long-Term | | Closed-End Fund - Debt | 9.70 | 90 | -0.92 | 2.09% |
| OXSQ | Oxford Square | | Asset Mgmt | 2.16 | 0 | -0.92 | -5.22% |
| CFG | Citizens | | Banks - Regional | 51.34 | 40 | -0.93 | 21.17% |
| NGHC | National General | | Insurance | 100.10 | 50 | -0.93 | 0.00% |
| For chart view version of above stock list: Chart View ➞ 0 - 25 , 25 - 50 , 50 - 75 , 75 - 100 , 100 - 125 , 125 - 150 , 150 - 175 , 175 - 200 , 200 - 225 , 225 - 250 , 250 - 275 , 275 - 300 , 300 - 325 , 325 - 350 , 350 - 375 , 375 - 400 , 400 - 425 , 425 - 450 , 450 - 475 , 475 - 500 , 500 - 525 , 525 - 550 , 550 - 575 , 575 - 600 , 600 - 625 , 625 - 650 , 650 - 675 , 675 - 700 , 700 - 725 , 725 - 750 , 750 - 775 , 775 - 800 , 800 - 825 , 825 - 850 , 850 - 875 , 875 - 900 , 900 - 925 , 925 - 950 , 950 - 975 , 975 - 1000 , 1000 - 1025 , 1025 - 1050 , 1050 - 1075 , 1075 - 1100 , 1100 - 1125 , 1125 - 1150 , 1150 - 1175 , 1175 - 1200 , 1200 - 1225 , 1225 - 1250 , 1250 - 1275 , 1275 - 1300 , 1300 - 1325 , 1325 - 1350 , 1350 - 1375 , 1375 - 1400 , 1400 - 1425 , 1425 - 1450 , 1450 - 1475 , 1475 - 1500 , 1500 - 1525 , 1525 - 1550 | ||
 | Click To Change The Sort Order: By Market Cap or Company Size Performance: Year-to-date, Week and Day |  |
|
Get the most comprehensive stock market coverage daily at 12Stocks.com ➞ Best Stocks Today ➞ Best Stocks Weekly ➞ Best Stocks Year-to-Date ➞ Best Stocks Trends ➞  Best Stocks Today 12Stocks.com Best Nasdaq Stocks ➞ Best S&P 500 Stocks ➞ Best Tech Stocks ➞ Best Biotech Stocks ➞ |
| Detailed Overview of Financial Stocks |
| Financial Technical Overview, Leaders & Laggards, Top Financial ETF Funds & Detailed Financial Stocks List, Charts, Trends & More |
| Financial Sector: Technical Analysis, Trends & YTD Performance | |
| Financial sector is composed of stocks
from banks, brokers, insurance, REITs
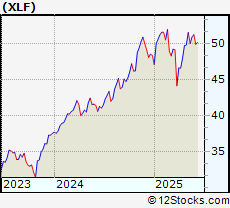
and services subsectors. Financial sector, as represented by XLF, an exchange-traded fund [ETF] that holds basket of Financial stocks (e.g, Bank of America, Goldman Sachs) is up by 12.1335% and is currently underperforming the overall market by -1.2673% year-to-date. Below is a quick view of Technical charts and trends: |
|
 XLF Weekly Chart |
|
| Long Term Trend: Good | |
| Medium Term Trend: Not Good | |
 XLF Daily Chart |
|
| Short Term Trend: Good | |
| Overall Trend Score: 30 | |
| YTD Performance: 12.1335% | |
| **Trend Scores & Views Are Only For Educational Purposes And Not For Investing | |
| 12Stocks.com: Top Performing Financial Sector Stocks | |||||||||||||||||||||||||||||||||||||||||||||||
 The top performing Financial sector stocks year to date are
Now, more recently, over last week, the top performing Financial sector stocks on the move are


|
|||||||||||||||||||||||||||||||||||||||||||||||
| 12Stocks.com: Investing in Financial Sector using Exchange Traded Funds | |
|
The following table shows list of key exchange traded funds (ETF) that
help investors track Financial Index. For detailed view, check out our ETF Funds section of our website. Quick View: Move mouse or cursor over ETF symbol (ticker) to view short-term Technical chart and over ETF name to view long term chart. Click on ticker or stock name for detailed view. Click on to add stock symbol to your watchlist and to view watchlist. |
12Stocks.com List of ETFs that track Financial Index
| Ticker | ETF Name | Watchlist | Recent Price | Smart Investing & Trading Score | Change % | Week % | Year-to-date % |
| CHIX | China Financials | | 10.57 | 20 | 0 | 0 | 0% |
| 12Stocks.com: Charts, Trends, Fundamental Data and Performances of Financial Stocks | |
|
We now take in-depth look at all Financial stocks including charts, multi-period performances and overall trends (as measured by Smart Investing & Trading Score). One can sort Financial stocks (click link to choose) by Daily, Weekly and by Year-to-Date performances. Also, one can sort by size of the company or by market capitalization. |
| Select Your Default Chart Type: | |||||
| |||||
| Click on stock symbol or name for detailed view. Click on to add stock symbol to your watchlist and to view watchlist. Quick View: Move mouse or cursor over "Daily" to quickly view daily Technical stock chart and over "Weekly" to view weekly Technical stock chart. | |||||

 | PKBK Parke Bancorp Inc |
| Sector: Financials | |
| SubSector: Banks - Regional | |
| MarketCap: 266.21 Millions | |
| Recent Price: 22.27 Smart Investing & Trading Score: 40 | |
| Day Percent Change: -0.845948% Day Change: -0.2 | |
| Week Change: -0.890076% Year-to-date Change: 15.3% | |
| PKBK Links: Profile News Message Board | |
| Charts:- Daily , Weekly | |
| Add PKBK to Watchlist: View: Get Complete PKBK Trend Analysis ➞ | |
 | OWL Blue Owl Capital Inc |
| Sector: Financials | |
| SubSector: Asset Management | |
| MarketCap: 27565.7 Millions | |
| Recent Price: 18.59 Smart Investing & Trading Score: 40 | |
| Day Percent Change: -0.853333% Day Change: -0.01 | |
| Week Change: 4.49691% Year-to-date Change: -19.7% | |
| OWL Links: Profile News Message Board | |
| Charts:- Daily , Weekly | |
| Add OWL to Watchlist: View: Get Complete OWL Trend Analysis ➞ | |
 | PWP Perella Weinberg Partners |
| Sector: Financials | |
| SubSector: Capital Markets | |
| MarketCap: 1900.92 Millions | |
| Recent Price: 22.06 Smart Investing & Trading Score: 70 | |
| Day Percent Change: -0.853933% Day Change: -0.19 | |
| Week Change: 1.51864% Year-to-date Change: -5.7% | |
| PWP Links: Profile News Message Board | |
| Charts:- Daily , Weekly | |
| Add PWP to Watchlist: View: Get Complete PWP Trend Analysis ➞ | |
 | CTBI Community Trust Bancorp, Inc |
| Sector: Financials | |
| SubSector: Banks - Regional | |
| MarketCap: 1057.11 Millions | |
| Recent Price: 56.42 Smart Investing & Trading Score: 20 | |
| Day Percent Change: -0.861009% Day Change: -0.33 | |
| Week Change: -3.34076% Year-to-date Change: 10.6% | |
| CTBI Links: Profile News Message Board | |
| Charts:- Daily , Weekly | |
| Add CTBI to Watchlist: View: Get Complete CTBI Trend Analysis ➞ | |
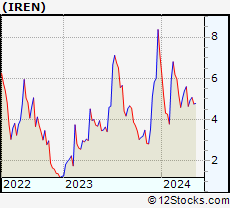 | IREN IREN Ltd |
| Sector: Financials | |
| SubSector: Capital Markets | |
| MarketCap: 7088.72 Millions | |
| Recent Price: 37.14 Smart Investing & Trading Score: 48 | |
| Day Percent Change: -0.86% Day Change: -0.17 | |
| Week Change: 2.67% Year-to-date Change: 99.5% | |
| IREN Links: Profile News Message Board | |
| Charts:- Daily , Weekly | |
| Add IREN to Watchlist: View: Get Complete IREN Trend Analysis ➞ | |
 | USCB USCB Financial Holdings Inc |
| Sector: Financials | |
| SubSector: Banks - Regional | |
| MarketCap: 349.97 Millions | |
| Recent Price: 17.21 Smart Investing & Trading Score: 30 | |
| Day Percent Change: -0.864055% Day Change: -0.21 | |
| Week Change: -1.26219% Year-to-date Change: -0.6% | |
| USCB Links: Profile News Message Board | |
| Charts:- Daily , Weekly | |
| Add USCB to Watchlist: View: Get Complete USCB Trend Analysis ➞ | |
 | RHP Ryman Hospitality Properties Inc |
| Sector: Financials | |
| SubSector: REIT - Hotel & Motel | |
| MarketCap: 6349.11 Millions | |
| Recent Price: 99.29 Smart Investing & Trading Score: 50 | |
| Day Percent Change: -0.878507% Day Change: -0.41 | |
| Week Change: -1.47847% Year-to-date Change: -0.8% | |
| RHP Links: Profile News Message Board | |
| Charts:- Daily , Weekly | |
| Add RHP to Watchlist: View: Get Complete RHP Trend Analysis ➞ | |
 | MYF BlackRock MuniYield Investment Fund |
| Sector: Financials | |
| SubSector: Closed-End Fund - Debt | |
| MarketCap: 160.507 Millions | |
| Recent Price: 69.05 Smart Investing & Trading Score: 80 | |
| Day Percent Change: -0.875682% Day Change: -9999 | |
| Week Change: 382.193% Year-to-date Change: 0.0% | |
| MYF Links: Profile News Message Board | |
| Charts:- Daily , Weekly | |
| Add MYF to Watchlist: View: Get Complete MYF Trend Analysis ➞ | |
 | PSTL Postal Realty Trust Inc |
| Sector: Financials | |
| SubSector: REIT - Office | |
| MarketCap: 479.94 Millions | |
| Recent Price: 15.83 Smart Investing & Trading Score: 40 | |
| Day Percent Change: -0.876644% Day Change: -0.03 | |
| Week Change: -0.814536% Year-to-date Change: 29.6% | |
| PSTL Links: Profile News Message Board | |
| Charts:- Daily , Weekly | |
| Add PSTL to Watchlist: View: Get Complete PSTL Trend Analysis ➞ | |
 | JXN Jackson Financial Inc |
| Sector: Financials | |
| SubSector: Insurance - Life | |
| MarketCap: 6646.14 Millions | |
| Recent Price: 96.78 Smart Investing & Trading Score: 36 | |
| Day Percent Change: -0.88% Day Change: -0.85 | |
| Week Change: -1.05% Year-to-date Change: 11.8% | |
| JXN Links: Profile News Message Board | |
| Charts:- Daily , Weekly | |
| Add JXN to Watchlist: View: Get Complete JXN Trend Analysis ➞ | |
 | SIR Select Income REIT |
| Sector: Financials | |
| SubSector: REIT - Office | |
| MarketCap: 2284.85 Millions | |
| Recent Price: 15.51 Smart Investing & Trading Score: 70 | |
| Day Percent Change: -0.894569% Day Change: -9999 | |
| Week Change: 14000% Year-to-date Change: 0.0% | |
| SIR Links: Profile News Message Board | |
| Charts:- Daily , Weekly | |
| Add SIR to Watchlist: View: Get Complete SIR Trend Analysis ➞ | |
 | PRAA PRA Group Inc |
| Sector: Financials | |
| SubSector: Credit Services | |
| MarketCap: 671.29 Millions | |
| Recent Price: 16.67 Smart Investing & Trading Score: 40 | |
| Day Percent Change: -0.891795% Day Change: -0.06 | |
| Week Change: -2.96857% Year-to-date Change: -19.0% | |
| PRAA Links: Profile News Message Board | |
| Charts:- Daily , Weekly | |
| Add PRAA to Watchlist: View: Get Complete PRAA Trend Analysis ➞ | |
 | NASB NASB Financial, Inc. |
| Sector: Financials | |
| SubSector: Savings & Loans | |
| MarketCap: 287.77 Millions | |
| Recent Price: 34.50 Smart Investing & Trading Score: 20 | |
| Day Percent Change: -0.890549% Day Change: -9999 | |
| Week Change: 1.11372% Year-to-date Change: -6.3% | |
| NASB Links: Profile News Message Board | |
| Charts:- Daily , Weekly | |
| Add NASB to Watchlist: View: Get Complete NASB Trend Analysis ➞ | |
 | TIGR UP Fintech Holding Ltd ADR |
| Sector: Financials | |
| SubSector: Capital Markets | |
| MarketCap: 2091.14 Millions | |
| Recent Price: 11.16 Smart Investing & Trading Score: 20 | |
| Day Percent Change: -0.888099% Day Change: 0.7 | |
| Week Change: -9.19447% Year-to-date Change: 67.1% | |
| TIGR Links: Profile News Message Board | |
| Charts:- Daily , Weekly | |
| Add TIGR to Watchlist: View: Get Complete TIGR Trend Analysis ➞ | |
 | NRIM Northrim Bancorp, Inc |
| Sector: Financials | |
| SubSector: Banks - Regional | |
| MarketCap: 502.01 Millions | |
| Recent Price: 90.47 Smart Investing & Trading Score: 0 | |
| Day Percent Change: -0.898236% Day Change: -0.16 | |
| Week Change: -0.473047% Year-to-date Change: 19.4% | |
| NRIM Links: Profile News Message Board | |
| Charts:- Daily , Weekly | |
| Add NRIM to Watchlist: View: Get Complete NRIM Trend Analysis ➞ | |
 | INBK First Internet Bancorp |
| Sector: Financials | |
| SubSector: Banks - Regional | |
| MarketCap: 212.86 Millions | |
| Recent Price: 24.16 Smart Investing & Trading Score: 40 | |
| Day Percent Change: -0.902379% Day Change: -0.2 | |
| Week Change: -1.1052% Year-to-date Change: -31.2% | |
| INBK Links: Profile News Message Board | |
| Charts:- Daily , Weekly | |
| Add INBK to Watchlist: View: Get Complete INBK Trend Analysis ➞ | |
 | PLMR Palomar Holdings Inc |
| Sector: Financials | |
| SubSector: Insurance - Property & Casualty | |
| MarketCap: 3299.86 Millions | |
| Recent Price: 115.79 Smart Investing & Trading Score: 10 | |
| Day Percent Change: -0.898665% Day Change: 1.8 | |
| Week Change: -6.01842% Year-to-date Change: 10.9% | |
| PLMR Links: Profile News Message Board | |
| Charts:- Daily , Weekly | |
| Add PLMR to Watchlist: View: Get Complete PLMR Trend Analysis ➞ | |
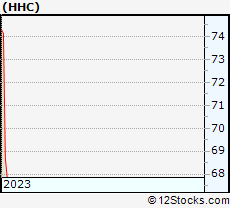 | HHC The Howard Hughes Corporation |
| Sector: Financials | |
| SubSector: Real Estate Development | |
| MarketCap: 2002.49 Millions | |
| Recent Price: 67.85 Smart Investing & Trading Score: 0 | |
| Day Percent Change: -0.905506% Day Change: -9999 | |
| Week Change: -2.64026% Year-to-date Change: 0.0% | |
| HHC Links: Profile News Message Board | |
| Charts:- Daily , Weekly | |
| Add HHC to Watchlist: View: Get Complete HHC Trend Analysis ➞ | |
 | ESS Essex Property Trust, Inc |
| Sector: Financials | |
| SubSector: REIT - Residential | |
| MarketCap: 17873 Millions | |
| Recent Price: 264.63 Smart Investing & Trading Score: 20 | |
| Day Percent Change: -0.921038% Day Change: -2.27 | |
| Week Change: -1.30166% Year-to-date Change: -3.7% | |
| ESS Links: Profile News Message Board | |
| Charts:- Daily , Weekly | |
| Add ESS to Watchlist: View: Get Complete ESS Trend Analysis ➞ | |
 | CUBE CubeSmart |
| Sector: Financials | |
| SubSector: REIT - Industrial | |
| MarketCap: 9564.24 Millions | |
| Recent Price: 40.81 Smart Investing & Trading Score: 40 | |
| Day Percent Change: -0.922554% Day Change: -0.24 | |
| Week Change: -2.22808% Year-to-date Change: 0.5% | |
| CUBE Links: Profile News Message Board | |
| Charts:- Daily , Weekly | |
| Add CUBE to Watchlist: View: Get Complete CUBE Trend Analysis ➞ | |
 | FUNC First United Corp |
| Sector: Financials | |
| SubSector: Banks - Regional | |
| MarketCap: 239.91 Millions | |
| Recent Price: 36.43 Smart Investing & Trading Score: 30 | |
| Day Percent Change: -0.924667% Day Change: -0.25 | |
| Week Change: -1.93809% Year-to-date Change: 11.3% | |
| FUNC Links: Profile News Message Board | |
| Charts:- Daily , Weekly | |
| Add FUNC to Watchlist: View: Get Complete FUNC Trend Analysis ➞ | |
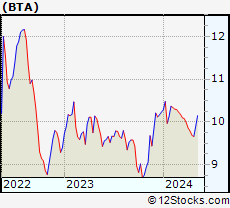 | BTA BlackRock Long-Term Municipal Advantage Trust |
| Sector: Financials | |
| SubSector: Closed-End Fund - Debt | |
| MarketCap: 124.86 Millions | |
| Recent Price: 9.70 Smart Investing & Trading Score: 90 | |
| Day Percent Change: -0.919305% Day Change: -0.02 | |
| Week Change: 4.41335% Year-to-date Change: 2.1% | |
| BTA Links: Profile News Message Board | |
| Charts:- Daily , Weekly | |
| Add BTA to Watchlist: View: Get Complete BTA Trend Analysis ➞ | |
 | OXSQ Oxford Square Capital Corp |
| Sector: Financials | |
| SubSector: Asset Management | |
| MarketCap: 171.68 Millions | |
| Recent Price: 2.16 Smart Investing & Trading Score: 0 | |
| Day Percent Change: -0.917431% Day Change: -0.03 | |
| Week Change: -1.81818% Year-to-date Change: -5.2% | |
| OXSQ Links: Profile News Message Board | |
| Charts:- Daily , Weekly | |
| Add OXSQ to Watchlist: View: Get Complete OXSQ Trend Analysis ➞ | |
 | CFG Citizens Financial Group Inc |
| Sector: Financials | |
| SubSector: Banks - Regional | |
| MarketCap: 22305.1 Millions | |
| Recent Price: 51.34 Smart Investing & Trading Score: 40 | |
| Day Percent Change: -0.926283% Day Change: -0.38 | |
| Week Change: -0.715529% Year-to-date Change: 21.2% | |
| CFG Links: Profile News Message Board | |
| Charts:- Daily , Weekly | |
| Add CFG to Watchlist: View: Get Complete CFG Trend Analysis ➞ | |
 | NGHC National General Holdings Corp. |
| Sector: Financials | |
| SubSector: Property & Casualty Insurance | |
| MarketCap: 1713.62 Millions | |
| Recent Price: 100.10 Smart Investing & Trading Score: 50 | |
| Day Percent Change: -0.930325% Day Change: -9999 | |
| Week Change: 1.07027% Year-to-date Change: 0.0% | |
| NGHC Links: Profile News Message Board | |
| Charts:- Daily , Weekly | |
| Add NGHC to Watchlist: View: Get Complete NGHC Trend Analysis ➞ | |
| For tabular summary view of above stock list: Summary View ➞ 0 - 25 , 25 - 50 , 50 - 75 , 75 - 100 , 100 - 125 , 125 - 150 , 150 - 175 , 175 - 200 , 200 - 225 , 225 - 250 , 250 - 275 , 275 - 300 , 300 - 325 , 325 - 350 , 350 - 375 , 375 - 400 , 400 - 425 , 425 - 450 , 450 - 475 , 475 - 500 , 500 - 525 , 525 - 550 , 550 - 575 , 575 - 600 , 600 - 625 , 625 - 650 , 650 - 675 , 675 - 700 , 700 - 725 , 725 - 750 , 750 - 775 , 775 - 800 , 800 - 825 , 825 - 850 , 850 - 875 , 875 - 900 , 900 - 925 , 925 - 950 , 950 - 975 , 975 - 1000 , 1000 - 1025 , 1025 - 1050 , 1050 - 1075 , 1075 - 1100 , 1100 - 1125 , 1125 - 1150 , 1150 - 1175 , 1175 - 1200 , 1200 - 1225 , 1225 - 1250 , 1250 - 1275 , 1275 - 1300 , 1300 - 1325 , 1325 - 1350 , 1350 - 1375 , 1375 - 1400 , 1400 - 1425 , 1425 - 1450 , 1450 - 1475 , 1475 - 1500 , 1500 - 1525 , 1525 - 1550 | ||
| Click To Change The Sort Order: By Market Cap or Company Size Performance: Year-to-date, Week and Day | |
| Select Chart Type: | ||
|
Best Stocks Today 12Stocks.com |
© 2025 12Stocks.com Terms & Conditions Privacy Contact Us
All Information Provided Only For Education And Not To Be Used For Investing or Trading. See Terms & Conditions


One More Thing ... Get Best Stocks Delivered Daily!
Never Ever Miss A Move With Our Top Ten Stocks Lists
Find Best Stocks In Any Market - Bull or Bear Market
Take A Peek At Our Top Ten Stocks Lists: Daily, Weekly, Year-to-Date & Top Trends
Find Best Stocks In Any Market - Bull or Bear Market
Take A Peek At Our Top Ten Stocks Lists: Daily, Weekly, Year-to-Date & Top Trends
Financial Stocks With Best Up Trends [0-bearish to 100-bullish]: PIMCO California[100], Torchmark [100], PIMCO California[100], Triumph Bancorp[100], Lemonade [100], PIMCO Municipal[100], Better Home[100], PIMCO Municipal[100], SuRo Capital[100], Front Yard[100], Atlanticus [100]
Best Financial Stocks Year-to-Date:
Insight Select[12384.6%], Oxford Lane[298.776%], Metalpha Technology[206.195%], Robinhood Markets[191.151%], Better Home[187.309%], Mr. Cooper[133.83%], LoanDepot [131.282%], Banco Santander[130.948%], IHS Holding[125.472%], Cipher Mining[124.638%], Deutsche Bank[123.86%] Best Financial Stocks This Week:
Colony Starwood[15929900%], Blackhawk Network[91300%], Macquarie Global[81662.9%], Credit Suisse[63241.6%], Pennsylvania Real[23823%], First Republic[22570.9%], Select ome[14000%], CorEnergy Infrastructure[6797.78%], FedNat Holding[5525%], BlackRock Municipal[5340%], BlackRock MuniYield[3379.04%] Best Financial Stocks Daily:
PIMCO California[11.9545%], Torchmark [11.8363%], PIMCO California[11.4754%], BlackRock Muni[10.8108%], Blackrock MuniYield[10.72%], Triumph Bancorp[10.2661%], BlackRock MuniYield[8.15348%], Lemonade [7.81815%], Summit [7.79817%], Concord Acquisition[7.63431%], PIMCO Municipal[6.8299%]